Last observation: sept. 2026 (N = 32)
First observation: janv. 1970 (N = 14)
Last data update: 15 oct. 2026, 23:29
Last compile: 16 oct. 2026, 01:37
`ENQ-CONJ-MENAGES` |>
  filter(INDICATEUR %in% c("IND_SYNT_CONF")) |>
  month_to_date() |>
  ggplot() + theme_minimal() + xlab("") + ylab("Confiance des ménages") +
  geom_line(aes(x = date, y = OBS_VALUE)) +
  scale_x_date(breaks = seq(1960, 2100, 5) |> paste0("-01-01") |> as.Date(),
               labels = date_format("%Y")) +
  theme(legend.position = c(0.15, 0.9),
        legend.title = element_blank()) +
  scale_y_continuous(breaks = seq(-500, 200, 5))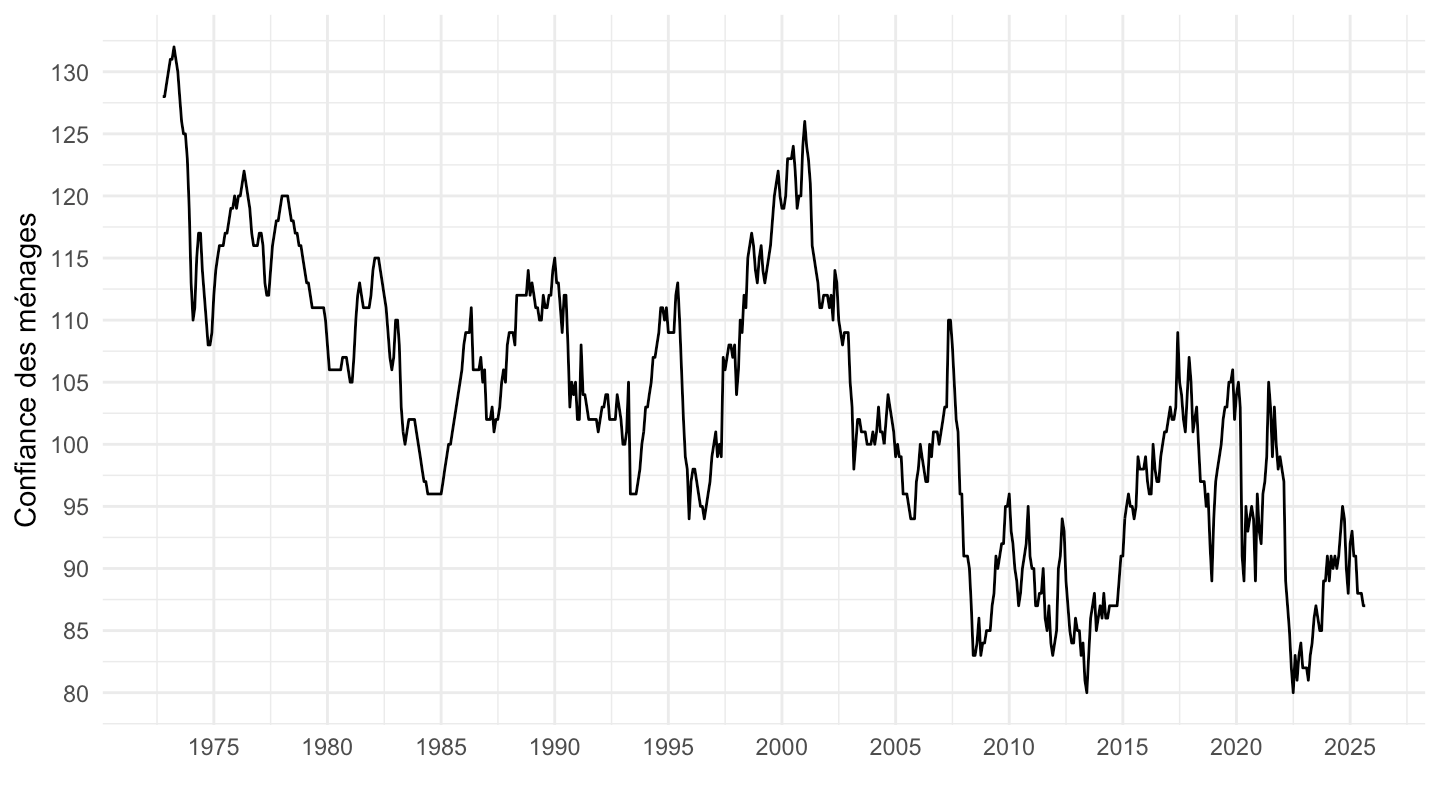
`ENQ-CONJ-MENAGES` |>
  filter(INDICATEUR %in% c("IND_SYNT_CONF")) |>
  month_to_date() |>
  filter(date >= as.Date("2005-01-01")) |>
  ggplot() + theme_minimal() + xlab("") + ylab("Confiance des ménages") +
  geom_line(aes(x = date, y = OBS_VALUE)) +
  scale_x_date(breaks = seq(1960, 2100, 2) |> paste0("-01-01") |> as.Date(),
               labels = date_format("%Y")) +
  theme(legend.position = c(0.15, 0.9),
        legend.title = element_blank()) +
  scale_y_continuous(breaks = seq(-500, 200, 5))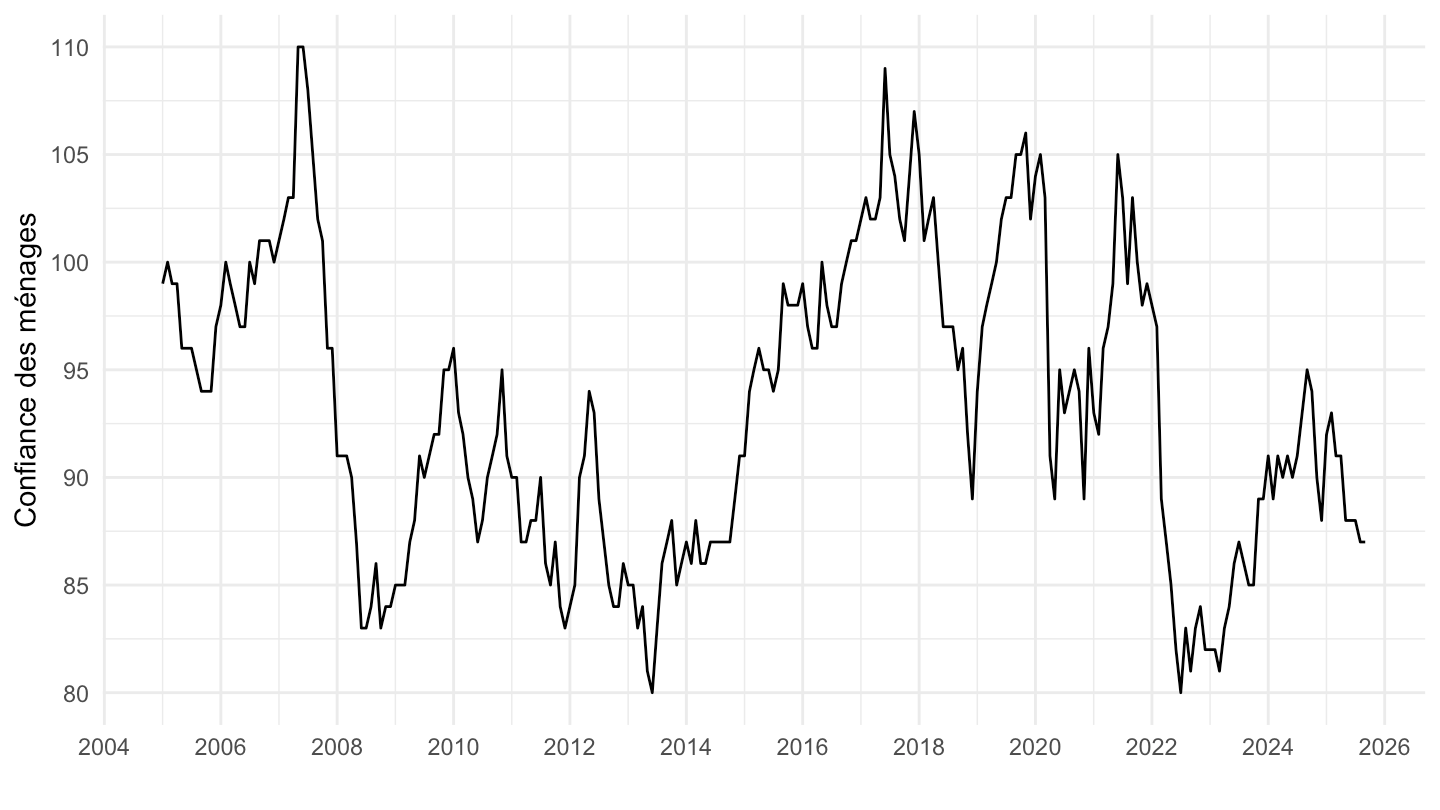
`ENQ-CONJ-MENAGES` |>
  filter(INDICATEUR %in% c("CAMME_NVP", "CAMME_NVF"),
         CORRECTION == "CVS") |>
  month_to_date() |>
  ggplot() + theme_minimal() + xlab("") + ylab("Solde d'opinions, Niveau de vie") +
  geom_line(aes(x = date, y = OBS_VALUE, color = Indicateur)) +
  scale_x_date(breaks = seq(1960, 2100, 5) |> paste0("-01-01") |> as.Date(),
               labels = date_format("%Y")) +
  theme(legend.position = c(0.8, 0.9),
        legend.title = element_blank()) +
  scale_y_continuous(breaks = seq(-500, 200, 5))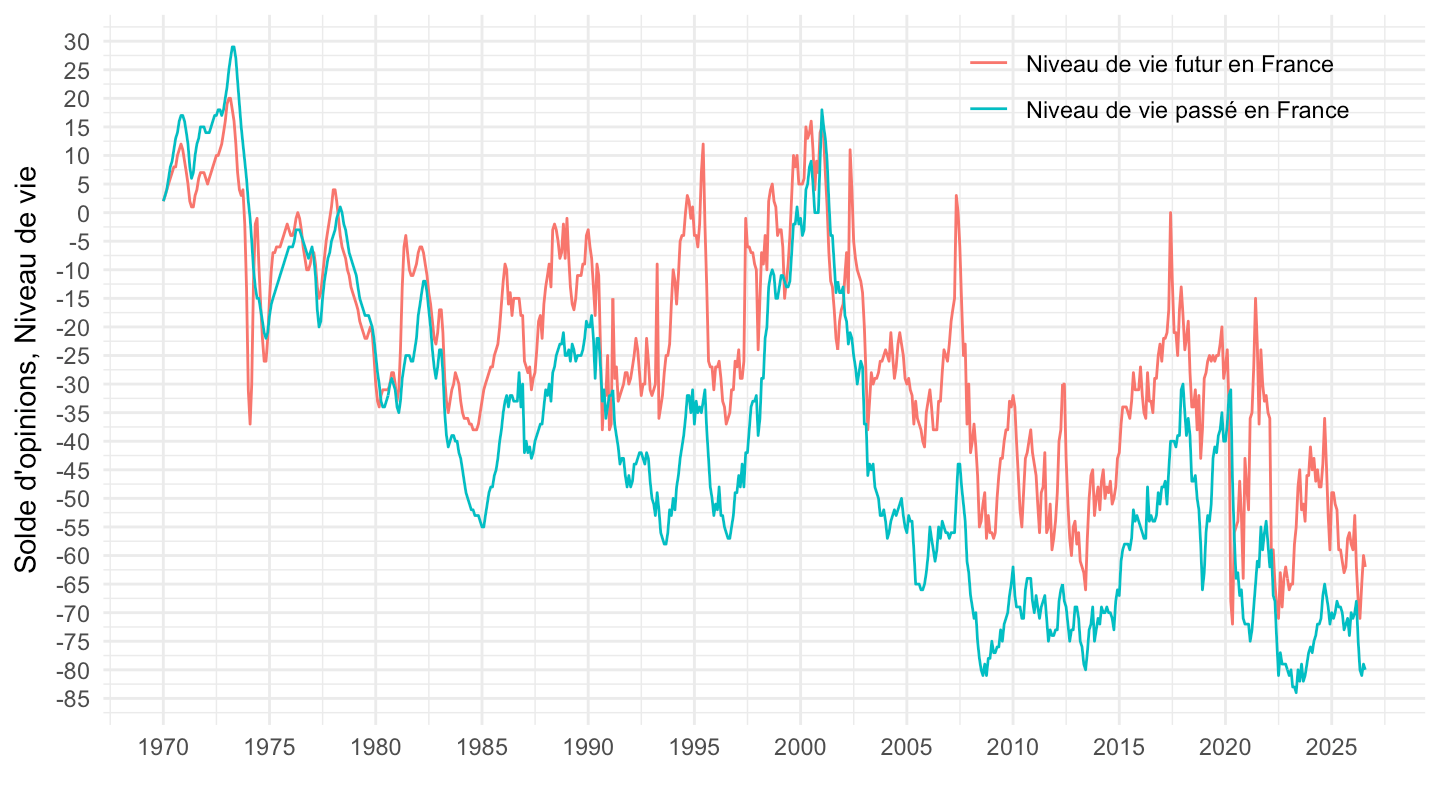
`ENQ-CONJ-MENAGES` |>
  filter(INDICATEUR %in% c("CAMME_NVP", "CAMME_NVF"),
         CORRECTION == "CVS") |>
  month_to_date() |>
  filter(date >= as.Date("2005-01-01")) |>
  ggplot() + theme_minimal() + xlab("") + ylab("Solde d'opinions, Niveau de vie") +
  geom_line(aes(x = date, y = OBS_VALUE, color = Indicateur)) +
  scale_x_date(breaks = seq(1960, 2100, 2) |> paste0("-01-01") |> as.Date(),
               labels = date_format("%Y")) +
  theme(legend.position = c(0.8, 0.9),
        legend.title = element_blank()) +
  scale_y_continuous(breaks = seq(-500, 200, 5))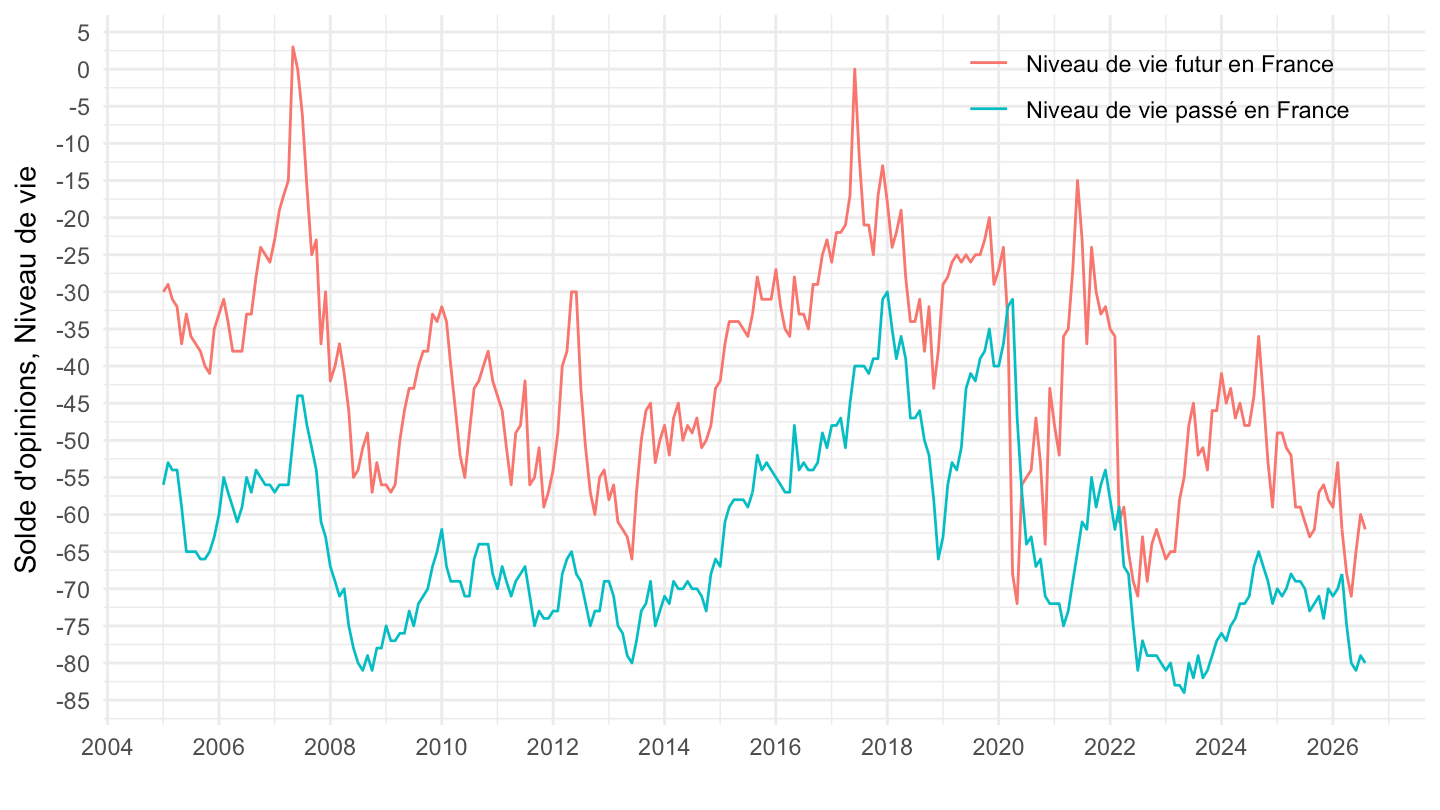
`ENQ-CONJ-MENAGES` |>
  filter(INDICATEUR %in% c("CAMME_NVP", "CAMME_NVF"),
         CORRECTION == "CVS") |>
  month_to_date() |>
  filter(date >= as.Date("2017-01-01")) |>
  ggplot() + theme_minimal() + xlab("") + ylab("Solde d'opinions, Niveau de vie") +
  geom_line(aes(x = date, y = OBS_VALUE, color = Indicateur)) +
  scale_x_date(breaks = seq(1960, 2100, 1) |> paste0("-01-01") |> as.Date(),
               labels = date_format("%Y")) +
  theme(legend.position = c(0.8, 0.9),
        legend.title = element_blank()) +
  scale_y_continuous(breaks = seq(-500, 200, 5))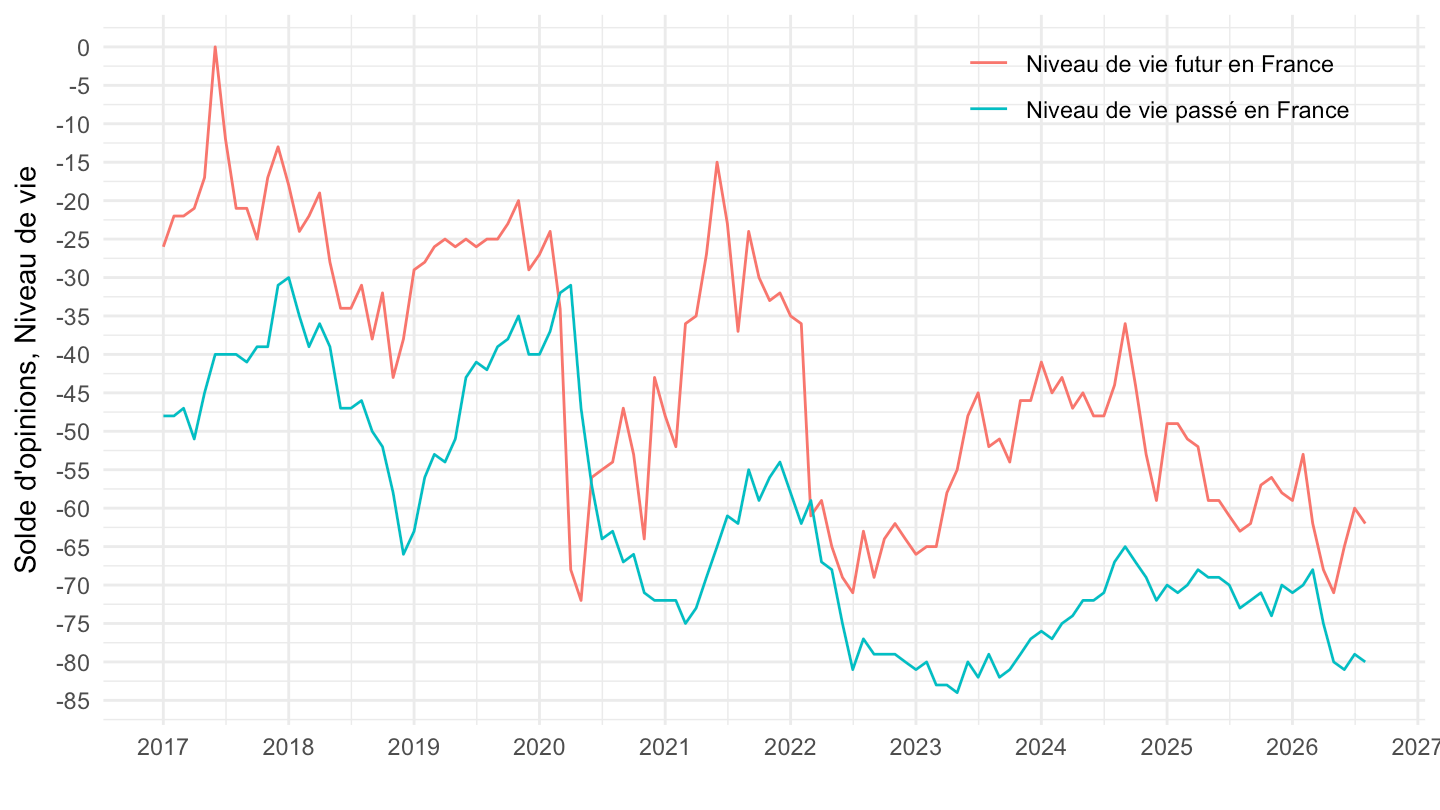
`ENQ-CONJ-MENAGES` |>
  filter(INDICATEUR %in% c("CAMME_PP", "CAMME_PF"),
         CORRECTION == "CVS") |>
  month_to_date() |>
  ggplot() + theme_minimal() + xlab("") + ylab("Solde d'opinions, Inflation") +
  geom_line(aes(x = date, y = OBS_VALUE, color = Indicateur)) +
  scale_x_date(breaks = seq(1960, 2100, 5) |> paste0("-01-01") |> as.Date(),
               labels = date_format("%Y")) +
  theme(legend.position = c(0.8, 0.9),
        legend.title = element_blank()) +
  scale_y_continuous(breaks = seq(-500, 200, 5))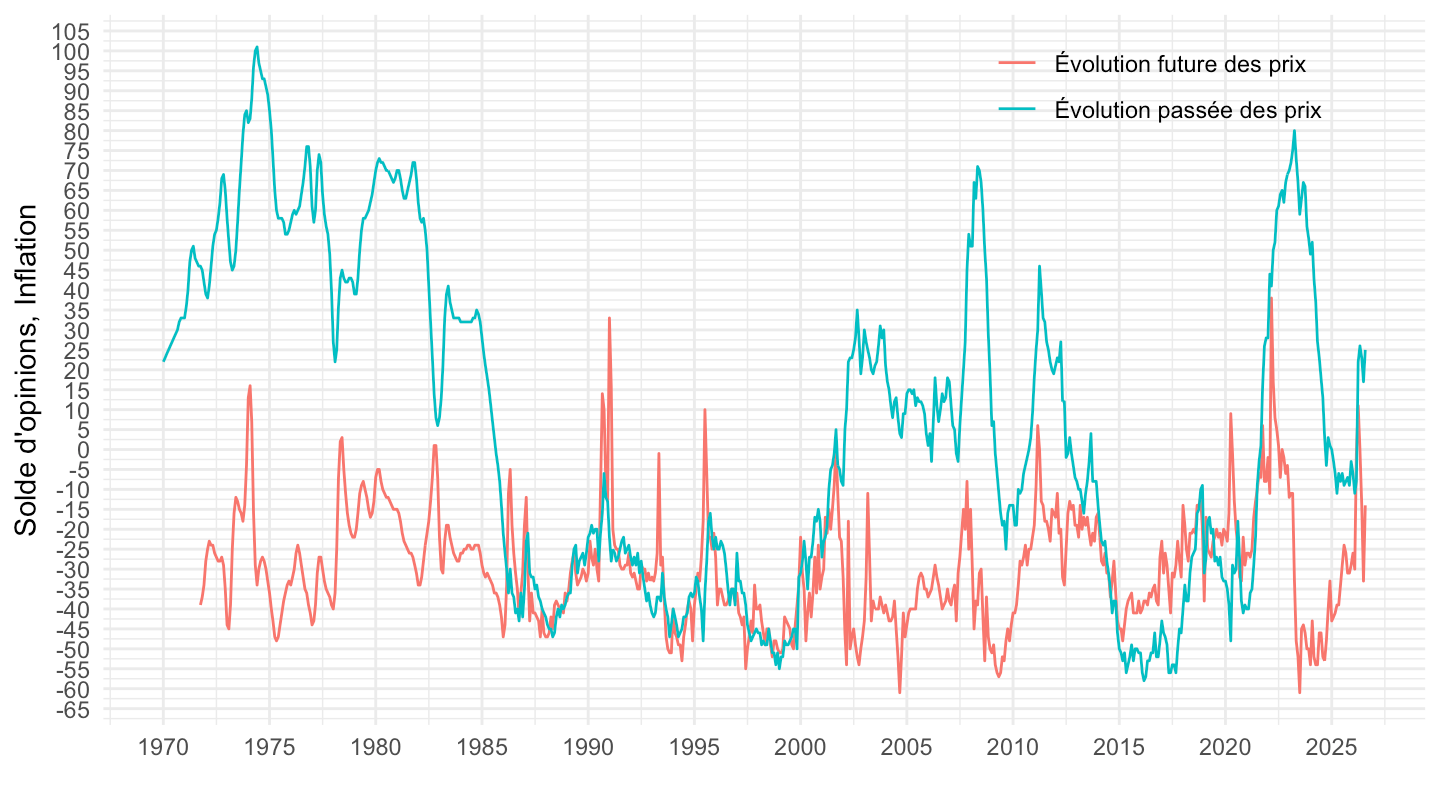
`ENQ-CONJ-MENAGES` |>
  filter(INDICATEUR %in% c("CAMME_PP", "CAMME_PF"),
         CORRECTION == "CVS") |>
  month_to_date() |>
  filter(date >= as.Date("2005-01-01")) |>
  ggplot() + theme_minimal() + xlab("") + ylab("Solde d'opinions, Inflation") +
  geom_line(aes(x = date, y = OBS_VALUE, color = Indicateur)) +
  scale_x_date(breaks = seq(1960, 2100, 2) |> paste0("-01-01") |> as.Date(),
               labels = date_format("%Y")) +
  theme(legend.position = c(0.8, 0.9),
        legend.title = element_blank()) +
  scale_y_continuous(breaks = seq(-500, 200, 5))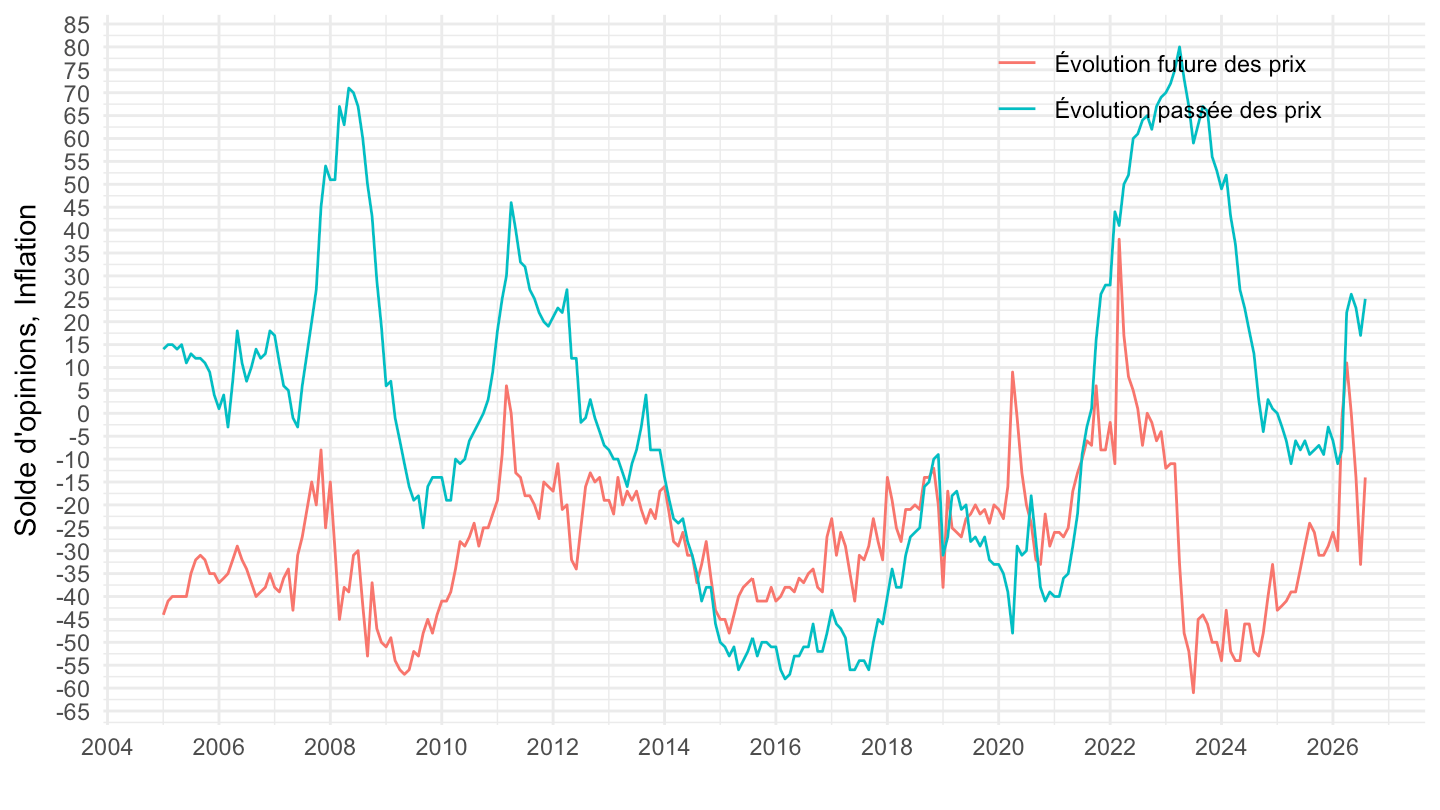
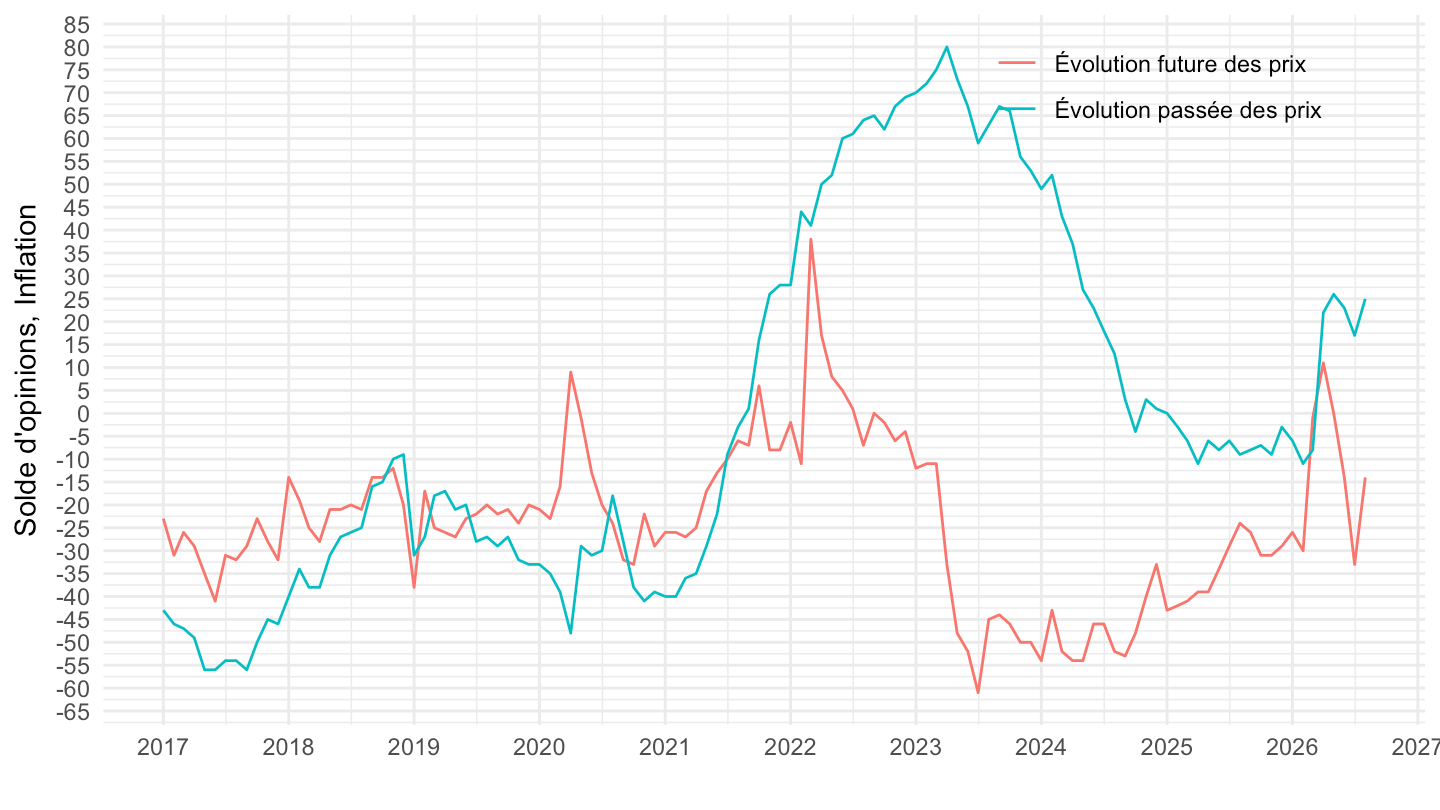
`ENQ-CONJ-MENAGES` |>
  filter(INDICATEUR %in% c("CAMME_PP", "CAMME_PF"),
         CORRECTION == "CVS") |>
  month_to_date() |>
  filter(date >= as.Date("2017-01-01")) |>
  ggplot() + theme_minimal() + xlab("") + ylab("Solde d'opinions, Inflation") +
  geom_line(aes(x = date, y = OBS_VALUE, color = Indicateur)) +
  scale_x_date(breaks = seq(1960, 2100, 1) |> paste0("-01-01") |> as.Date(),
               labels = date_format("%Y")) +
  theme(legend.position = c(0.8, 0.9),
        legend.title = element_blank()) +
  scale_y_continuous(breaks = seq(-500, 200, 5))