Last observation: 2019 (N = 18)
First observation: 1967 (N = 3)
Last data update: 02 août 2026, 11:04
Last compile: 10 oct. 2026, 00:59
ECRT2022 |>
  group_by(variable) |>
  summarise(Nobs = n()) |>
  arrange(-Nobs) |>
print_table_conditional()| variable | Nobs |
|---|---|
| D5/D1...3 | 57 |
| D5/D1...6 | 57 |
| D9/D1...2 | 57 |
| D9/D1...5 | 57 |
| D9/D5...4 | 57 |
| D9/D5...7 | 57 |
| Ensemble | 48 |
| Cadres y c. chefs d'entreprises | 24 |
| Commerce | 24 |
| Construction | 24 |
| Employés | 24 |
| Femmes | 24 |
| Hommes | 24 |
| Industrie | 24 |
| Ouvriers | 24 |
| Professions intermédiaires | 24 |
| Services | 24 |
ECRT2022 |>
  group_by(date) |>
  summarise(Nobs = n()) |>
  arrange(-Nobs) |>
print_table_conditional()ECRT2022 |>
filter(sheet == "F24") |>
ggplot() + theme_minimal() + xlab("") + ylab("") +
#scale_color_manual(values = viridis(5)[1:4]) +
geom_line(aes(x = date, y = value, color = variable)) +
theme(legend.title = element_blank(),
legend.position = c(0.3, 0.89)) +
scale_x_date(breaks = seq(1950, 2100, 2) |> paste0("-01-01") |> as.Date(),
labels = date_format("%Y")) +
scale_y_log10(breaks = seq(100, 20000, 10))
ECRT2022 |>
  filter(sheet == "F25") |>
  ggplot() + theme_minimal() + xlab("") + ylab("") +
  #scale_color_manual(values = viridis(8)[1:7]) +
  geom_line(aes(x = date, y = value, color = variable)) +
  theme(legend.title = element_blank(),
        legend.position = c(0.2, 0.2)) +
  scale_x_date(breaks = seq(1950, 2100, 2) |> paste0("-01-01") |> as.Date(),
               labels = date_format("%Y")) +
  scale_y_continuous(breaks = seq(1000, 20000, 200),
                     labels = scales::dollar_format(accuracy = 1, pre = "", su = "€"))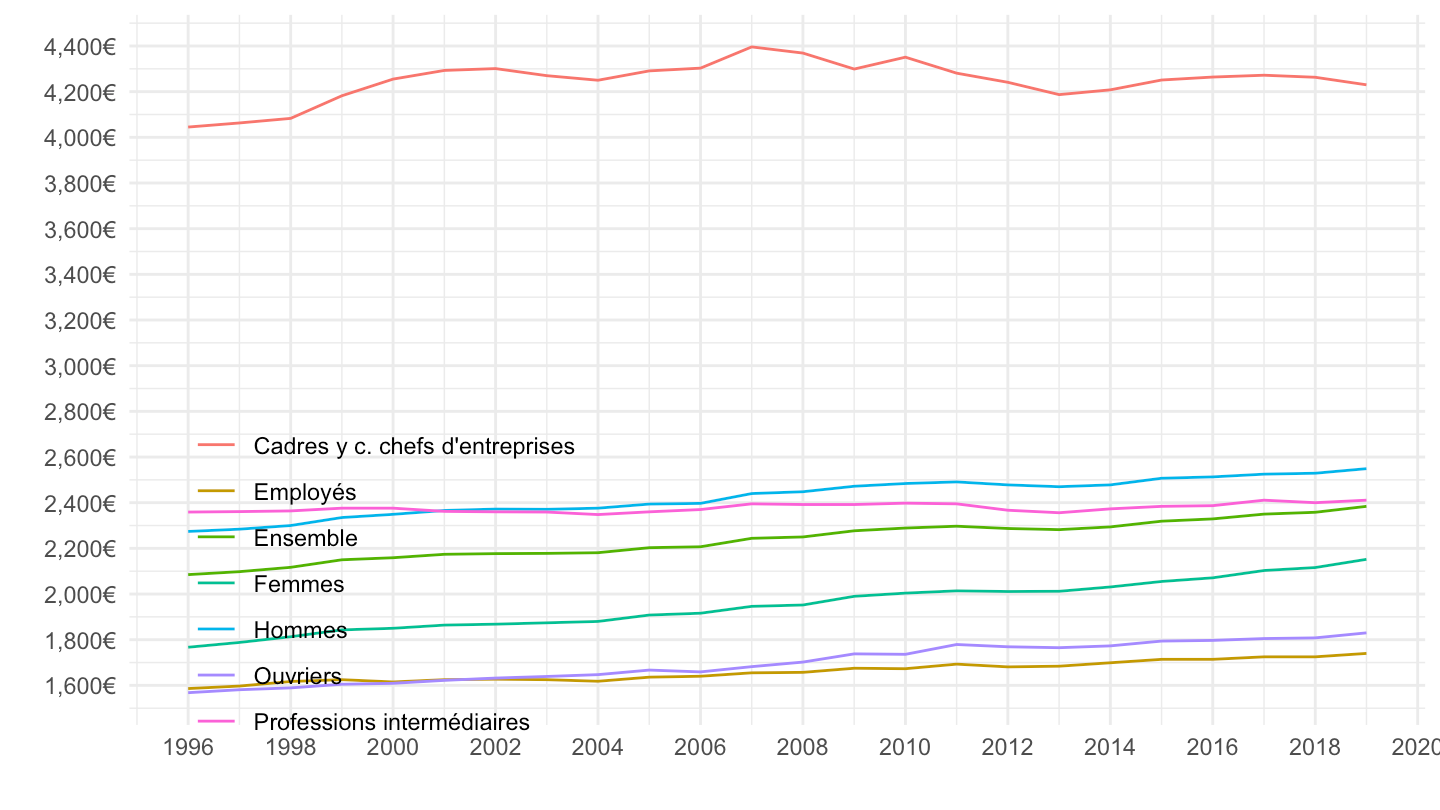
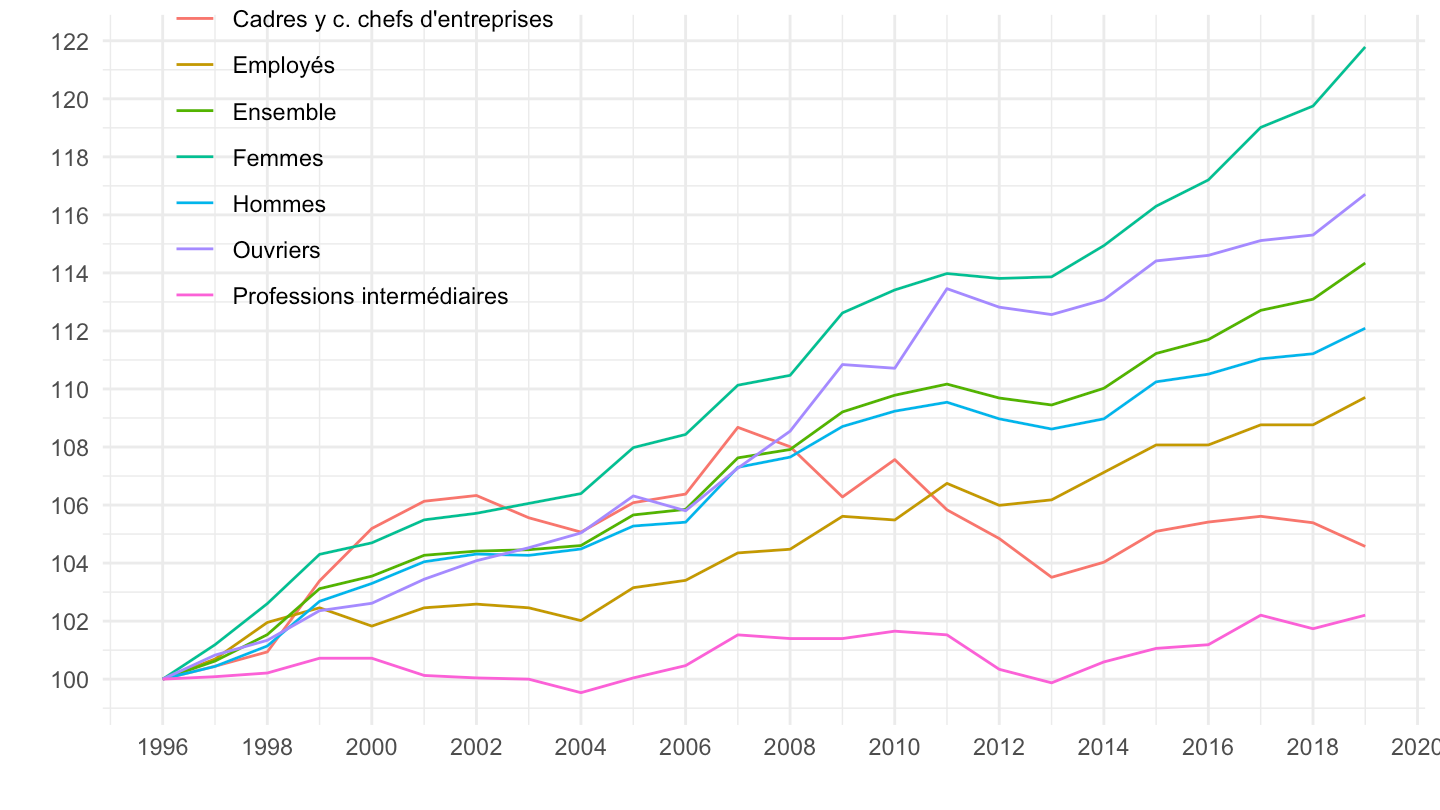
ECRT2022 |>
  filter(sheet == "F25") |>
  group_by(variable) |>
  mutate(value = 100*value/value[1]) |>
  ggplot() + theme_minimal() + xlab("") + ylab("") +
  #scale_color_manual(values = viridis(8)[1:7]) +
  geom_line(aes(x = date, y = value, color = variable)) +
  theme(legend.title = element_blank(),
        legend.position = c(0.2, 0.8)) +
  scale_x_date(breaks = seq(1950, 2100, 2) |> paste0("-01-01") |> as.Date(),
               labels = date_format("%Y")) +
  scale_y_continuous(breaks = seq(100, 200, 2))