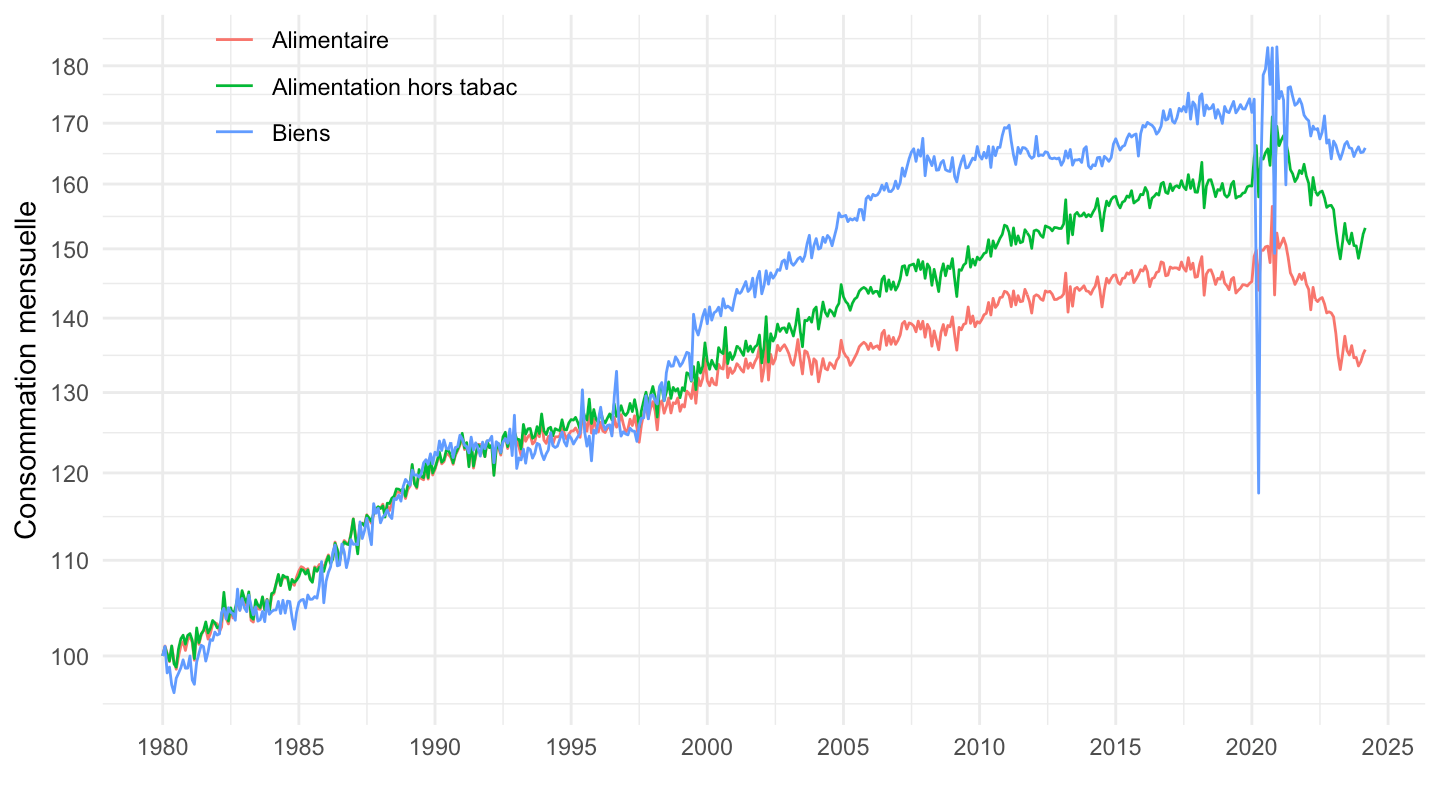
Consommation des ménages en biens - CONSO-MENAGES-2014-vieux

Données - INSEE

Info

source dataset Title Updated
insee CONSO-MENAGES-2014 Consommation des ménages en biens - CONSO-MENAGES-2014 2026-08-16

LAST_UPDATE

Code
`CONSO-MENAGES-2014` |>
  group_by(LAST_UPDATE) |>
  summarise(Nobs = n()) |>
  print_table_conditional()
LAST_UPDATE Nobs
2024-04-30 8496

Source

  • s1036 - Consommation des ménages (base 2014). html

PRODUIT_CONSO_MENAGES

Code
`CONSO-MENAGES-2014` |>
  left_join(PRODUIT_CONSO_MENAGES,  by = "PRODUIT_CONSO_MENAGES") |>
  group_by(PRODUIT_CONSO_MENAGES, Produit_conso_menages) |>
  summarise(Nobs = n()) |>
  arrange(-Nobs) |>
  print_table_conditional()
PRODUIT_CONSO_MENAGES Produit_conso_menages Nobs
ALIMENTAIRE Alimentaire 531
ALIMENTAIRE-HORS-TABAC Alimentation hors tabac 531
BIENS Biens 531
BIENS-DURABLES Biens durables 531
BIENS-DURABLES-EQUIPEMENT Biens durables d'équipement personnel 531
BIENS-FABRIQUES Biens fabriqués 531
BIENS-FABRIQUES-AUTRES Autres biens fabriqués 531
BIENS-MANUFACTURES Biens manufacturés 531
ENERGIE_C2 Cokéfaction et raffinage (C2) 531
ENERGIE_DE Énergie, eau et déchets (DE) 531
ENERGIE_DEC2 Énergie, eau, déchets, cokéfaction et raffinage (DE, C2) 531
ENERGIE_PETROLE Énergie hors produits pétroliers 531
EQUIPEMENT-LOGEMENT Équipement du logement 531
MATERIELS-TRANSPORT Matériels de transport 531
PRODUITS-PETROLIERS Produits pétroliers 531
TEXTILE Textile-cuir 531

TITLE_FR

Code
`CONSO-MENAGES-2014` |>
  group_by(IDBANK, TITLE_FR) |>
  summarise(Nobs = n()) |>
  arrange(-Nobs) |>
  print_table_conditional()
IDBANK TITLE_FR Nobs
010565748 Consommation mensuelle des ménages en biens - Alimentaire hors tabac - Volumes aux prix de l'année précédente, chaînés depuis 2014 - Série CVS-CJO - Série arrêtée 531
010565749 Consommation mensuelle des ménages en biens - Cokéfaction et raffinage - Volumes aux prix de l'année précédente, chaînés depuis 2014 - Série CVS-CJO - Série arrêtée 531
010565750 Consommation mensuelle des ménages en biens - Matériels de transport - Volumes aux prix de l'année précédente, chaînés depuis 2014 - Série CVS-CJO - Série arrêtée 531
010565751 Consommation mensuelle des ménages en biens - Énergie, eau et déchets - Volumes aux prix de l'année précédente, chaînés depuis 2014 - Série CVS-CJO - Série arrêtée 531
010565752 Consommation mensuelle des ménages en biens - Alimentaire - Volumes aux prix de l'année précédente, chaînés depuis 2014 - Série CVS-CJO - Série arrêtée 531
010565753 Consommation mensuelle des ménages en biens - Biens - Volumes aux prix de l'année précédente, chaînés depuis 2014 - Série CVS-CJO - Série arrêtée 531
010565754 Consommation mensuelle des ménages en biens - Produits pétroliers - Volumes aux prix de l'année précédente, chaînés depuis 2014 - Série CVS-CJO - Série arrêtée 531
010565755 Consommation mensuelle des ménages en biens - Biens manufacturés - Volumes aux prix de l'année précédente, chaînés depuis 2014 - Série CVS-CJO - Série arrêtée 531
010565756 Consommation mensuelle des ménages en biens - Énergie hors produits pétroliers - Volumes aux prix de l'année précédente, chaînés depuis 2014 - Série CVS-CJO - Série arrêtée 531
010565757 Consommation mensuelle des ménages en biens - Énergie, eau, déchets, cokéfaction et raffinage - Volumes aux prix de l'année précédente, chaînés depuis 2014 - Série CVS-CJO - Série arrêtée 531
010565758 Consommation mensuelle des ménages en biens - Autres biens durables - Volumes aux prix de l'année précédente, chaînés depuis 2014 - Série CVS-CJO - Série arrêtée 531
010565759 Consommation mensuelle des ménages en biens - Biens durables - Volumes aux prix de l'année précédente, chaînés depuis 2014 - Série CVS-CJO - Série arrêtée 531
010565760 Consommation mensuelle des ménages en biens - Textile-cuir - Volumes aux prix de l'année précédente, chaînés depuis 2014 - Série CVS-CJO - Série arrêtée 531
010565761 Consommation mensuelle des ménages en biens - Autres biens fabriqués - Volumes aux prix de l'année précédente, chaînés depuis 2014 - Série CVS-CJO - Série arrêtée 531
010565762 Consommation mensuelle des ménages en biens - Biens fabriqués - Volumes aux prix de l'année précédente, chaînés depuis 2014 - Série CVS-CJO - Série arrêtée 531
010565763 Consommation mensuelle des ménages en biens - Équipement du logement - Volumes aux prix de l'année précédente, chaînés depuis 2014 - Série CVS-CJO - Série arrêtée 531

TIME_PERIOD

Code
`CONSO-MENAGES-2014` |>
  group_by(TIME_PERIOD) |>
  summarise(Nobs = n()) |>
  arrange(desc(TIME_PERIOD)) |>
  print_table_conditional()

Table

Exemple

Code
`CONSO-MENAGES-2014` |>
  filter(TIME_PERIOD %in% c("1980-01", "2000-01", "2020-01")) |>
  left_join(PRODUIT_CONSO_MENAGES,  by = "PRODUIT_CONSO_MENAGES") |>
  select_if(function(col) length(unique(col)) > 1) |>
  select(-IDBANK, -TITLE_FR, -TITLE_EN, -OBS_REV) |>
  spread(TIME_PERIOD, OBS_VALUE) |>
  arrange(-`2020-01`) |>
  print_table_conditional()
PRODUIT_CONSO_MENAGES Produit_conso_menages 1980-01 2000-01 2020-01
BIENS Biens 27.688 38.549 47.578
BIENS-MANUFACTURES Biens manufacturés 23.478 32.237 40.729
BIENS-FABRIQUES Biens fabriqués 10.056 14.908 22.151
ALIMENTAIRE Alimentaire 11.882 15.629 17.253
ALIMENTAIRE-HORS-TABAC Alimentation hors tabac 9.917 13.300 15.835
BIENS-DURABLES Biens durables 3.434 6.372 11.120
ENERGIE_DEC2 Énergie, eau, déchets, cokéfaction et raffinage (DE, C2) 6.772 8.823 8.186
BIENS-FABRIQUES-AUTRES Autres biens fabriqués 3.142 4.761 6.705
MATERIELS-TRANSPORT Matériels de transport 3.281 5.213 5.784
PRODUITS-PETROLIERS Produits pétroliers 5.535 6.193 5.048
TEXTILE Textile-cuir 4.025 3.952 4.329
ENERGIE_DE Énergie, eau et déchets (DE) 2.209 3.950 4.201
EQUIPEMENT-LOGEMENT Équipement du logement 0.413 1.076 4.061
ENERGIE_C2 Cokéfaction et raffinage (C2) 4.818 4.877 3.993
ENERGIE_PETROLE Énergie hors produits pétroliers 1.463 2.680 3.139
BIENS-DURABLES-EQUIPEMENT Biens durables d'équipement personnel 0.631 0.946 1.306

Total, Alimentaire, Alimentaire XTabac

All

Indice

Code
`CONSO-MENAGES-2014` |>
  filter(PRODUIT_CONSO_MENAGES %in% c("BIENS", "ALIMENTAIRE", "ALIMENTAIRE-HORS-TABAC")) |>
  left_join(PRODUIT_CONSO_MENAGES,  by = "PRODUIT_CONSO_MENAGES") |>
  month_to_date() |>
  group_by(Produit_conso_menages) |>
  arrange(date) |>
  mutate(OBS_VALUE = 100*OBS_VALUE/OBS_VALUE[1]) |>
  ggplot() + geom_line(aes(x = date, y = OBS_VALUE, color = Produit_conso_menages)) +
  theme_minimal() + ylab("Consommation mensuelle") + xlab("") +
  theme(legend.title = element_blank(),
        legend.position = c(0.2, 0.9)) +
  scale_x_date(breaks = seq(1950, 2100, 5) |> paste0("-01-01") |> as.Date(),
               labels = date_format("%Y")) +
  scale_y_log10(breaks = seq(100, 300, 10))

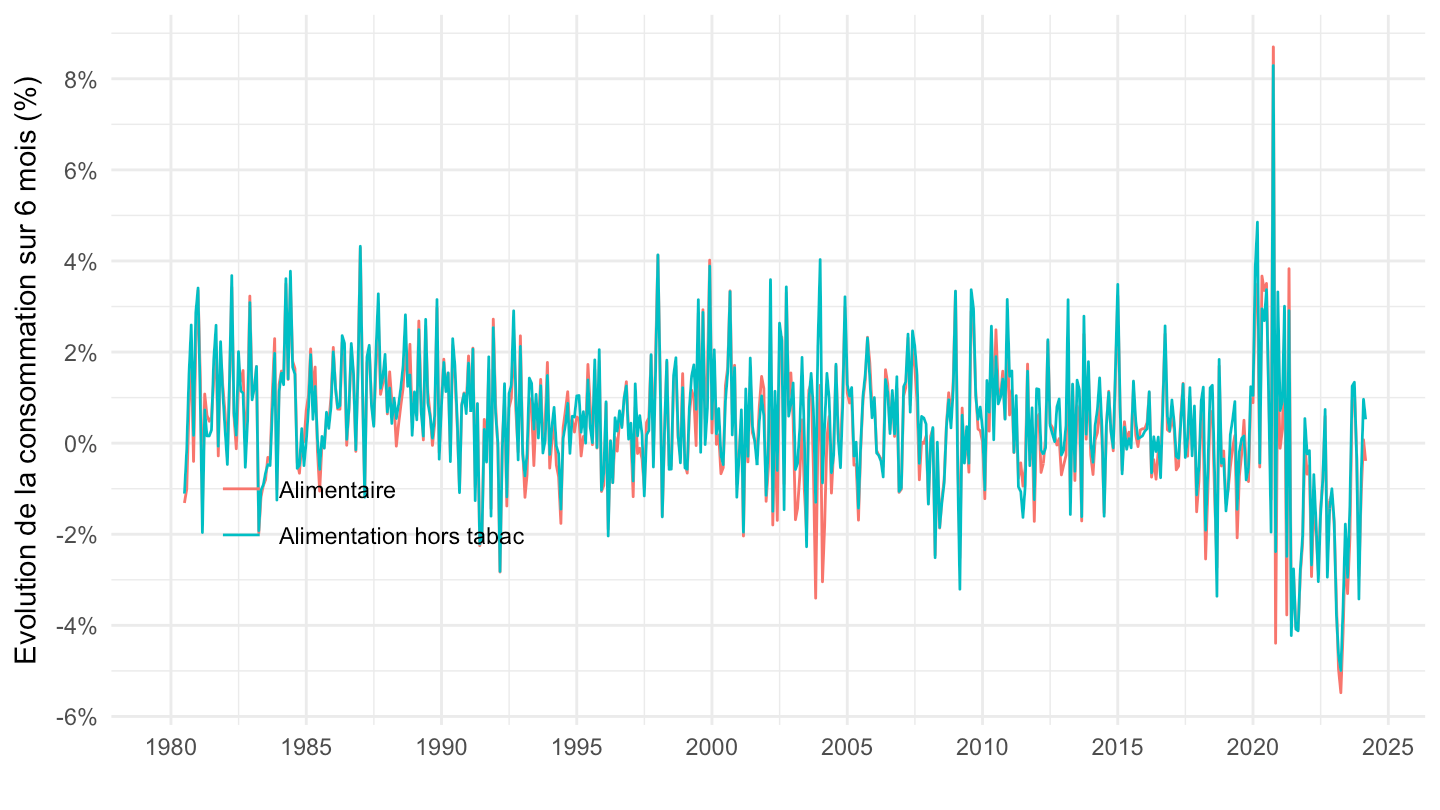
Baisse sur 6 mois

Code
invisible(Sys.setlocale("LC_TIME", "fr_CA.UTF-8"))
`CONSO-MENAGES-2014` |>
  filter(PRODUIT_CONSO_MENAGES %in% c("ALIMENTAIRE", "ALIMENTAIRE-HORS-TABAC")) |>
  left_join(PRODUIT_CONSO_MENAGES,  by = "PRODUIT_CONSO_MENAGES") |>
  month_to_date() |>
  arrange((date)) |>
  group_by(Produit_conso_menages) |>
  mutate(OBS_VALUE2 = OBS_VALUE/lag(OBS_VALUE, 6)-1) |>
  ggplot() + geom_line(aes(x = date, y = OBS_VALUE2, color = Produit_conso_menages)) +
  theme_minimal() + ylab("Evolution de la consommation sur 6 mois (%)") + xlab("") +
  theme(legend.title = element_blank(),
        legend.position = c(0.2, 0.3)) +
  scale_x_date(breaks = seq(1950, 2100, 5) |> paste0("-01-01") |> as.Date(),
               labels = date_format("%Y")) +
  scale_y_continuous(breaks = 0.01*seq(-100, 500, 2),
                labels = percent_format(accuracy = 1))

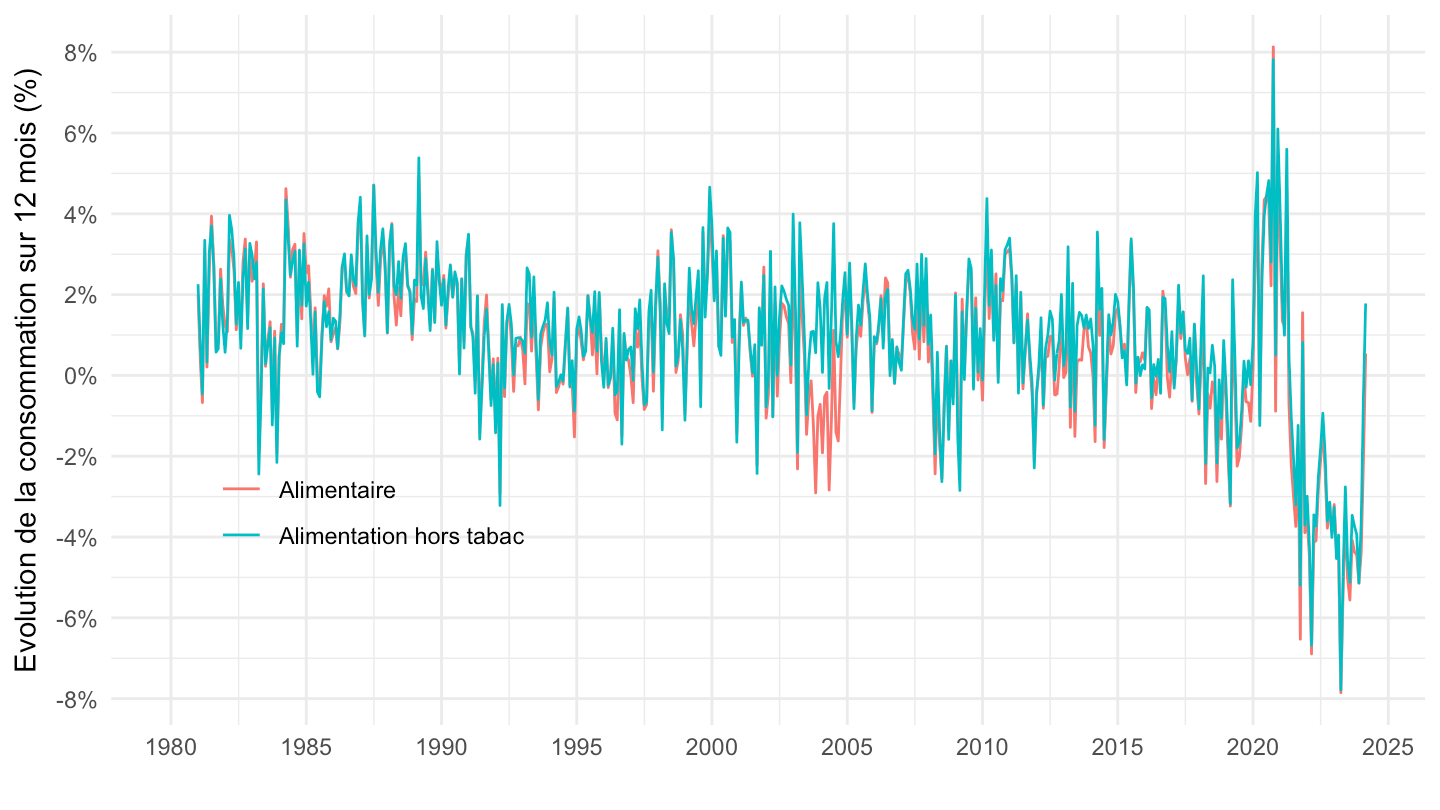
Baisse sur 12 mois

Code
invisible(Sys.setlocale("LC_TIME", "fr_CA.UTF-8"))
`CONSO-MENAGES-2014` |>
  filter(PRODUIT_CONSO_MENAGES %in% c("ALIMENTAIRE", "ALIMENTAIRE-HORS-TABAC")) |>
  left_join(PRODUIT_CONSO_MENAGES,  by = "PRODUIT_CONSO_MENAGES") |>
  month_to_date() |>
  arrange((date)) |>
  group_by(Produit_conso_menages) |>
  mutate(OBS_VALUE2 = OBS_VALUE/lag(OBS_VALUE, 12)-1) |>
  ggplot() + geom_line(aes(x = date, y = OBS_VALUE2, color = Produit_conso_menages)) +
  theme_minimal() + ylab("Evolution de la consommation sur 12 mois (%)") + xlab("") +
  theme(legend.title = element_blank(),
        legend.position = c(0.2, 0.3)) +
  scale_x_date(breaks = seq(1950, 2100, 5) |> paste0("-01-01") |> as.Date(),
               labels = date_format("%Y")) +
  scale_y_continuous(breaks = 0.01*seq(-100, 500, 2),
                labels = percent_format(accuracy = 1))

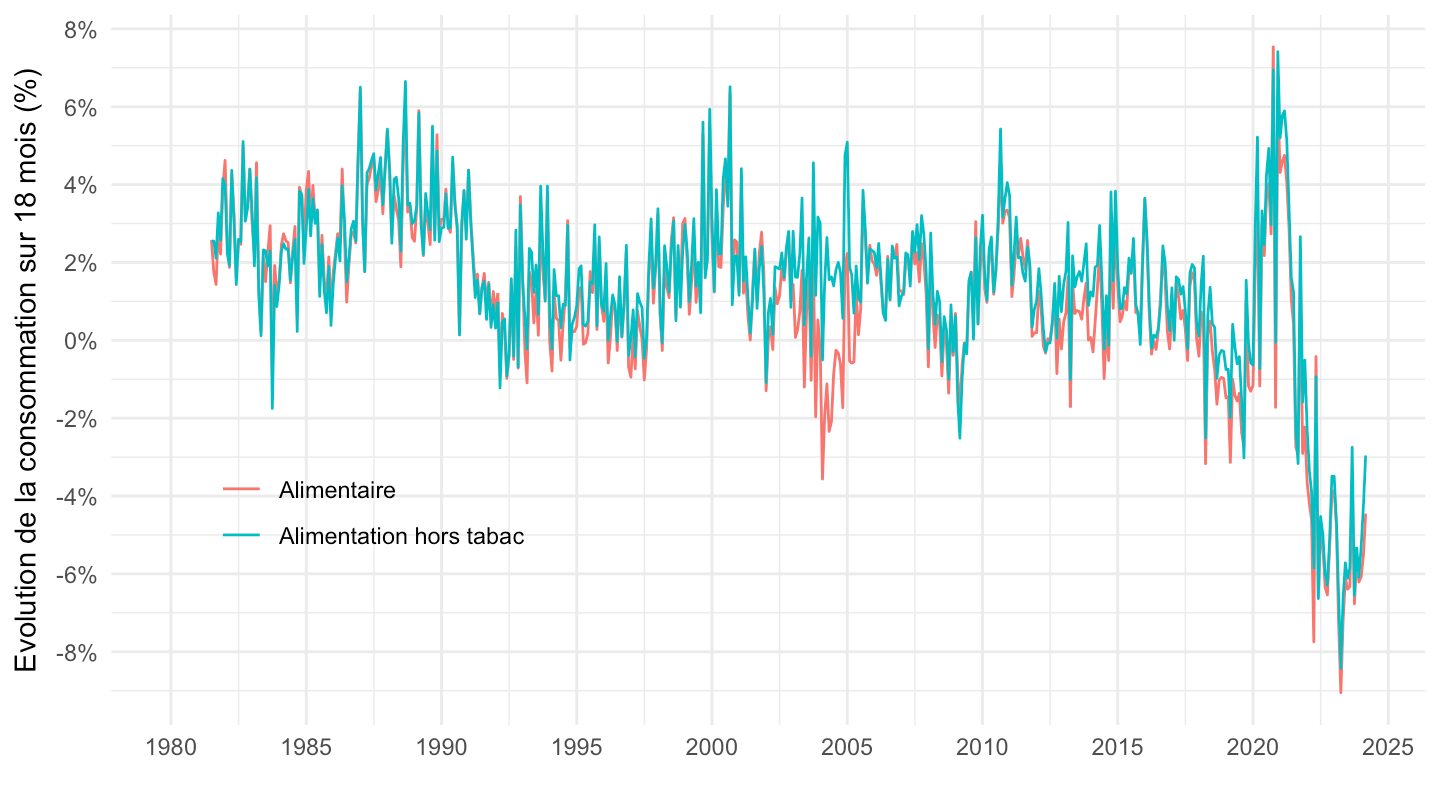
Baisse sur 18 mois

Code
invisible(Sys.setlocale("LC_TIME", "fr_CA.UTF-8"))
`CONSO-MENAGES-2014` |>
  filter(PRODUIT_CONSO_MENAGES %in% c("ALIMENTAIRE", "ALIMENTAIRE-HORS-TABAC")) |>
  left_join(PRODUIT_CONSO_MENAGES,  by = "PRODUIT_CONSO_MENAGES") |>
  month_to_date() |>
  arrange((date)) |>
  group_by(Produit_conso_menages) |>
  mutate(OBS_VALUE2 = OBS_VALUE/lag(OBS_VALUE, 18)-1) |>
  arrange(desc(date)) |>
  ggplot() + geom_line(aes(x = date, y = OBS_VALUE2, color = Produit_conso_menages)) +
  theme_minimal() + ylab("Evolution de la consommation sur 18 mois (%)") + xlab("") +
  theme(legend.title = element_blank(),
        legend.position = c(0.2, 0.3)) +
  scale_x_date(breaks = seq(1950, 2100, 5) |> paste0("-01-01") |> as.Date(),
               labels = date_format("%Y")) +
  scale_y_continuous(breaks = 0.01*seq(-100, 500, 2),
                labels = percent_format(accuracy = 1))

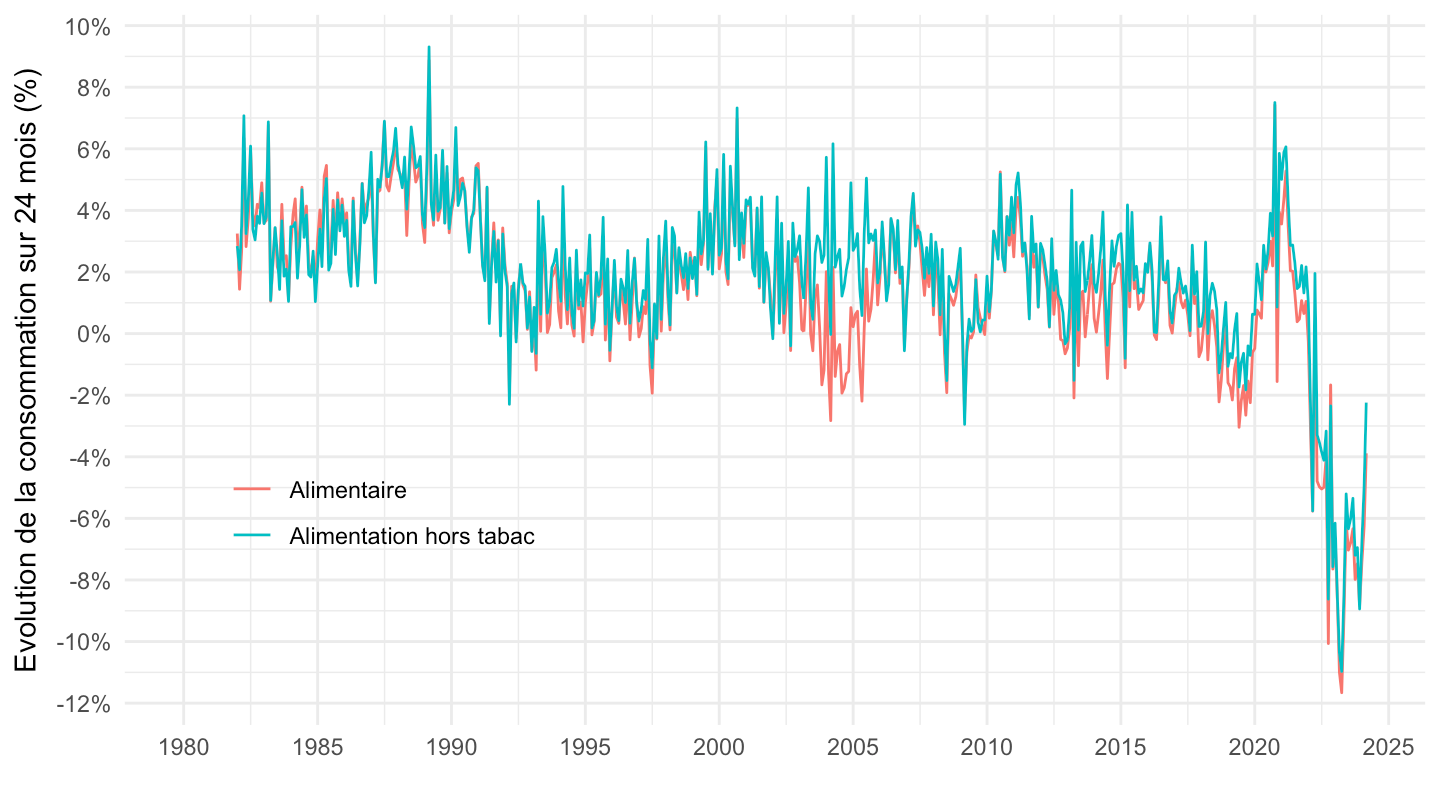
Baisse sur 24 mois

Code
invisible(Sys.setlocale("LC_TIME", "fr_CA.UTF-8"))
`CONSO-MENAGES-2014` |>
  filter(PRODUIT_CONSO_MENAGES %in% c("ALIMENTAIRE", "ALIMENTAIRE-HORS-TABAC")) |>
  left_join(PRODUIT_CONSO_MENAGES,  by = "PRODUIT_CONSO_MENAGES") |>
  month_to_date() |>
  arrange((date)) |>
  group_by(Produit_conso_menages) |>
  mutate(OBS_VALUE2 = OBS_VALUE/lag(OBS_VALUE, 24)-1) |>
  ggplot() + geom_line(aes(x = date, y = OBS_VALUE2, color = Produit_conso_menages)) +
  theme_minimal() + ylab("Evolution de la consommation sur 24 mois (%)") + xlab("") +
  theme(legend.title = element_blank(),
        legend.position = c(0.2, 0.3)) +
  scale_x_date(breaks = seq(1950, 2100, 5) |> paste0("-01-01") |> as.Date(),
               labels = date_format("%Y")) +
  scale_y_continuous(breaks = 0.01*seq(-100, 500, 2),
                labels = percent_format(accuracy = 1))

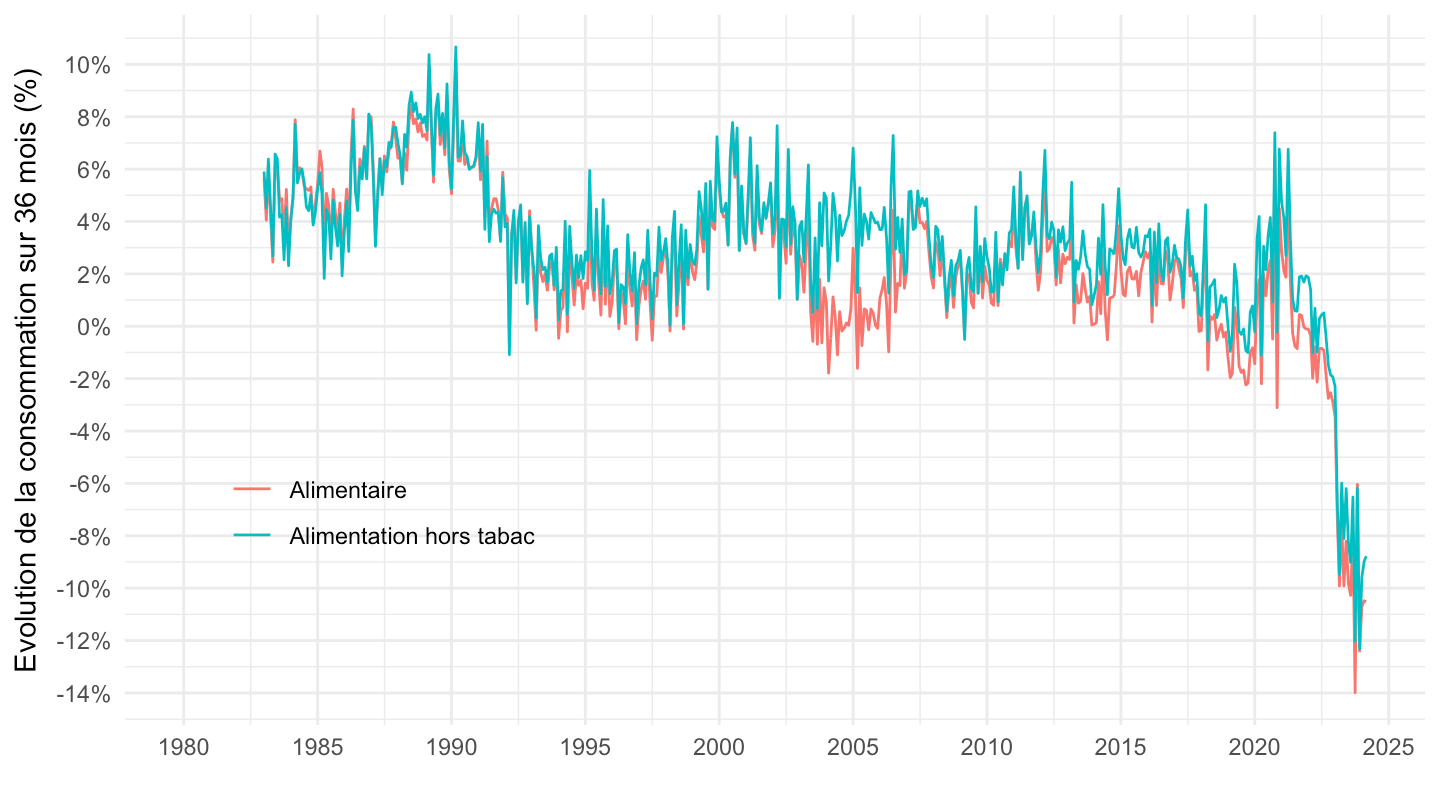
Baisse sur 36 mois

Code
invisible(Sys.setlocale("LC_TIME", "fr_CA.UTF-8"))
`CONSO-MENAGES-2014` |>
  filter(PRODUIT_CONSO_MENAGES %in% c("ALIMENTAIRE", "ALIMENTAIRE-HORS-TABAC")) |>
  left_join(PRODUIT_CONSO_MENAGES,  by = "PRODUIT_CONSO_MENAGES") |>
  month_to_date() |>
  arrange((date)) |>
  group_by(Produit_conso_menages) |>
  mutate(OBS_VALUE2 = OBS_VALUE/lag(OBS_VALUE, 36)-1) |>
  ggplot() + geom_line(aes(x = date, y = OBS_VALUE2, color = Produit_conso_menages)) +
  theme_minimal() + ylab("Evolution de la consommation sur 36 mois (%)") + xlab("") +
  theme(legend.title = element_blank(),
        legend.position = c(0.2, 0.3)) +
  scale_x_date(breaks = seq(1950, 2100, 5) |> paste0("-01-01") |> as.Date(),
               labels = date_format("%Y")) +
  scale_y_continuous(breaks = 0.01*seq(-100, 500, 2),
                labels = percent_format(accuracy = 1))

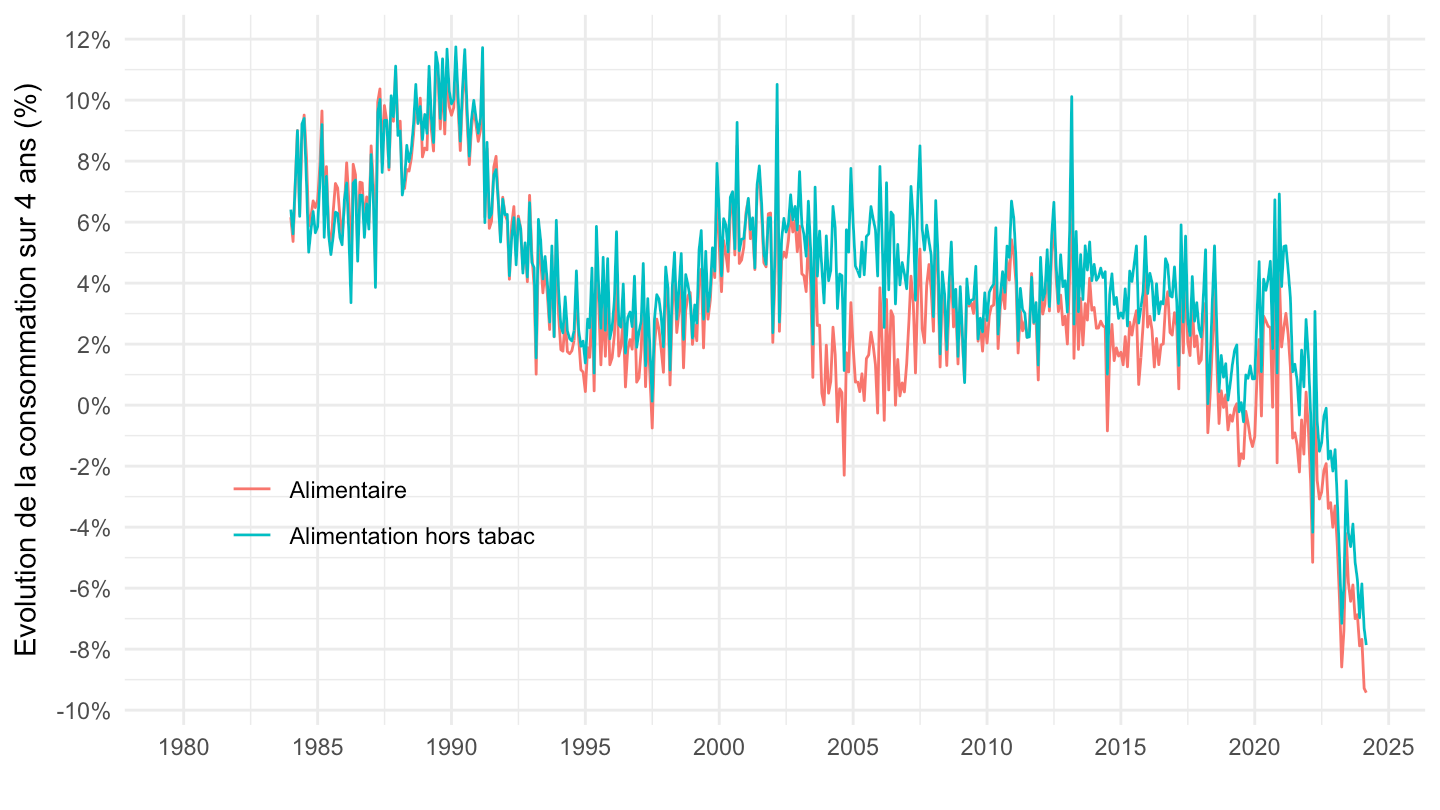
Baisse sur 48 mois

Code
invisible(Sys.setlocale("LC_TIME", "fr_CA.UTF-8"))
`CONSO-MENAGES-2014` |>
  filter(PRODUIT_CONSO_MENAGES %in% c("ALIMENTAIRE", "ALIMENTAIRE-HORS-TABAC")) |>
  left_join(PRODUIT_CONSO_MENAGES,  by = "PRODUIT_CONSO_MENAGES") |>
  month_to_date() |>
  arrange((date)) |>
  group_by(Produit_conso_menages) |>
  mutate(OBS_VALUE2 = OBS_VALUE/lag(OBS_VALUE, 48)-1) |>
  ggplot() + geom_line(aes(x = date, y = OBS_VALUE2, color = Produit_conso_menages)) +
  theme_minimal() + ylab("Evolution de la consommation sur 4 ans (%)") + xlab("") +
  theme(legend.title = element_blank(),
        legend.position = c(0.2, 0.3)) +
  scale_x_date(breaks = seq(1950, 2100, 5) |> paste0("-01-01") |> as.Date(),
               labels = date_format("%Y")) +
  scale_y_continuous(breaks = 0.01*seq(-100, 500, 2),
                labels = percent_format(accuracy = 1))

1996-

Code
`CONSO-MENAGES-2014` |>
  filter(PRODUIT_CONSO_MENAGES %in% c("BIENS", "ALIMENTAIRE", "ALIMENTAIRE-HORS-TABAC")) |>
  left_join(PRODUIT_CONSO_MENAGES,  by = "PRODUIT_CONSO_MENAGES") |>
  month_to_date() |>
  filter(date >= as.Date("1996-01-01")) |>
  group_by(Produit_conso_menages) |>
  arrange(date) |>
  mutate(OBS_VALUE = 100*OBS_VALUE/OBS_VALUE[1]) |>
  ggplot() + geom_line(aes(x = date, y = OBS_VALUE, color = Produit_conso_menages)) +
  theme_minimal() + ylab("Consommation mensuelle") + xlab("") +
  theme(legend.title = element_blank(),
        legend.position = c(0.2, 0.8)) +
  scale_x_date(breaks = seq(1950, 2100, 2) |> paste0("-01-01") |> as.Date(),
               labels = date_format("%Y")) +
  scale_y_log10(breaks = seq(10, 300, 10))

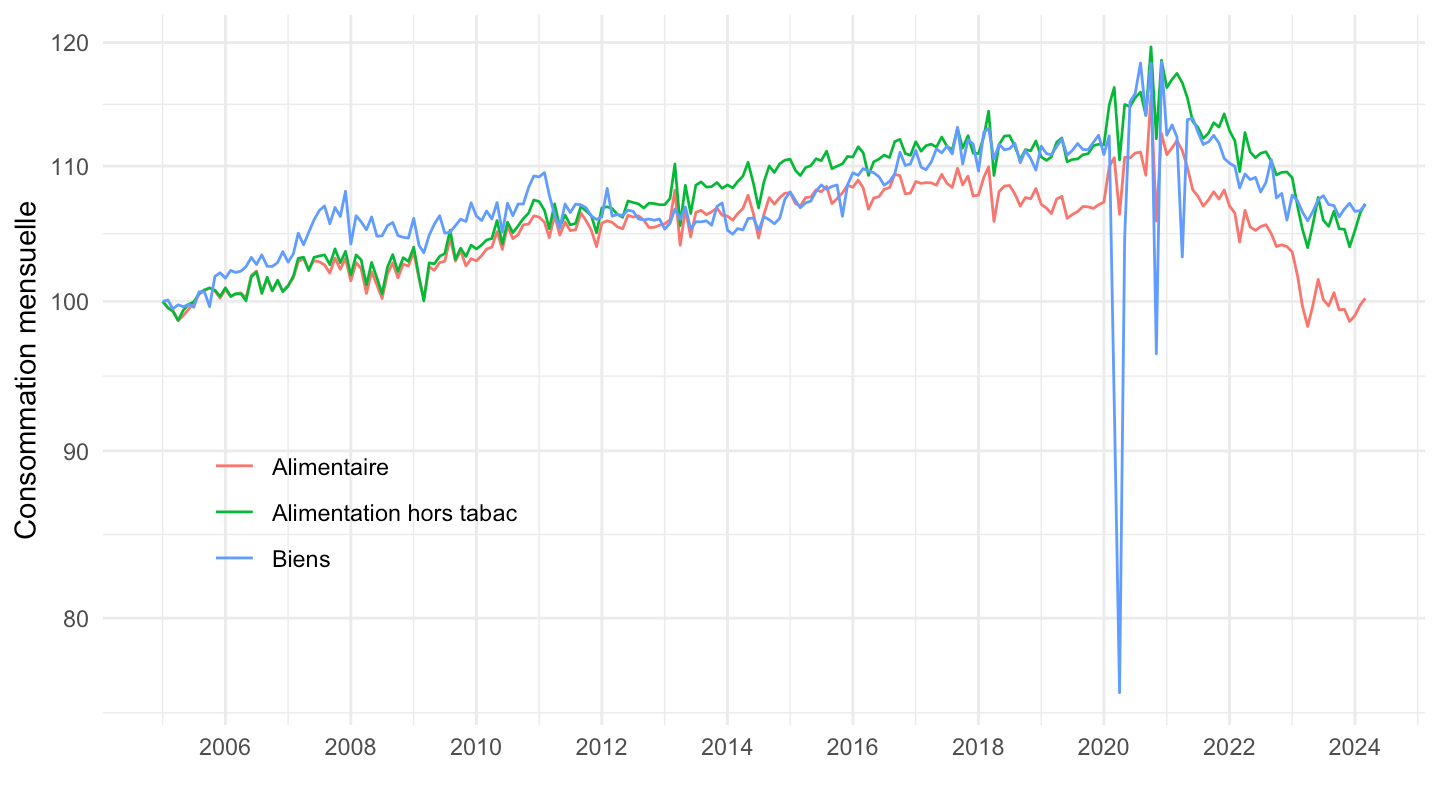
2005-

Code
`CONSO-MENAGES-2014` |>
  filter(PRODUIT_CONSO_MENAGES %in% c("BIENS", "ALIMENTAIRE", "ALIMENTAIRE-HORS-TABAC")) |>
  left_join(PRODUIT_CONSO_MENAGES,  by = "PRODUIT_CONSO_MENAGES") |>
  month_to_date() |>
  filter(date >= as.Date("2005-01-01")) |>
  group_by(Produit_conso_menages) |>
  arrange(date) |>
  mutate(OBS_VALUE = 100*OBS_VALUE/OBS_VALUE[1]) |>
  ggplot() + geom_line(aes(x = date, y = OBS_VALUE, color = Produit_conso_menages)) +
  theme_minimal() + ylab("Consommation mensuelle") + xlab("") +
  theme(legend.title = element_blank(),
        legend.position = c(0.2, 0.3)) +
  scale_x_date(breaks = seq(1950, 2100, 2) |> paste0("-01-01") |> as.Date(),
               labels = date_format("%Y")) +
  scale_y_log10(breaks = seq(10, 300, 10))

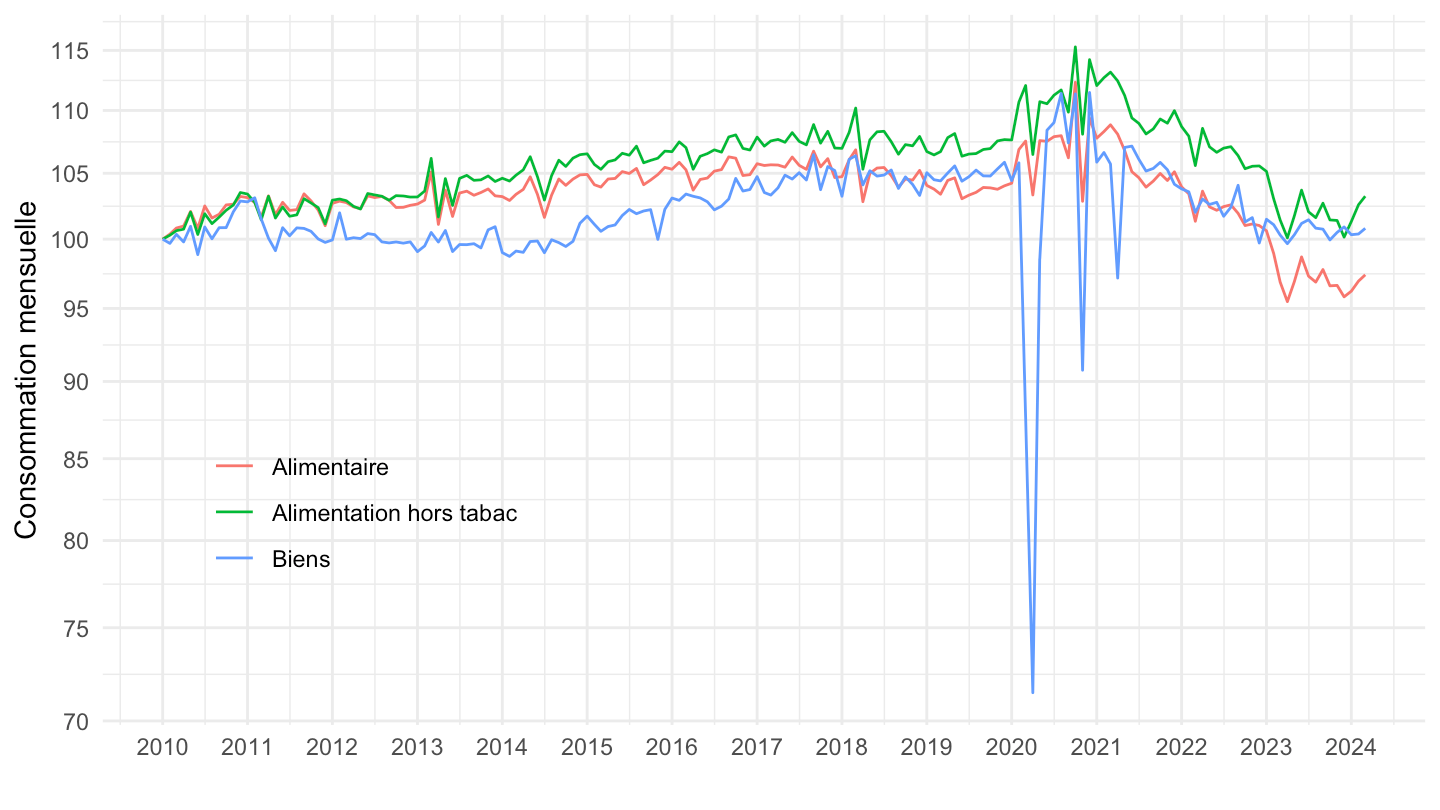
2010-

Code
`CONSO-MENAGES-2014` |>
  filter(PRODUIT_CONSO_MENAGES %in% c("BIENS", "ALIMENTAIRE", "ALIMENTAIRE-HORS-TABAC")) |>
  left_join(PRODUIT_CONSO_MENAGES,  by = "PRODUIT_CONSO_MENAGES") |>
  month_to_date() |>
  filter(date >= as.Date("2010-01-01")) |>
  group_by(Produit_conso_menages) |>
  arrange(date) |>
  mutate(OBS_VALUE = 100*OBS_VALUE/OBS_VALUE[1]) |>
  ggplot() + geom_line(aes(x = date, y = OBS_VALUE, color = Produit_conso_menages)) +
  theme_minimal() + ylab("Consommation mensuelle") + xlab("") +
  theme(legend.title = element_blank(),
        legend.position = c(0.2, 0.3)) +
  scale_x_date(breaks = seq(1950, 2100, 1) |> paste0("-01-01") |> as.Date(),
               labels = date_format("%Y")) +
  scale_y_log10(breaks = seq(10, 300, 5))

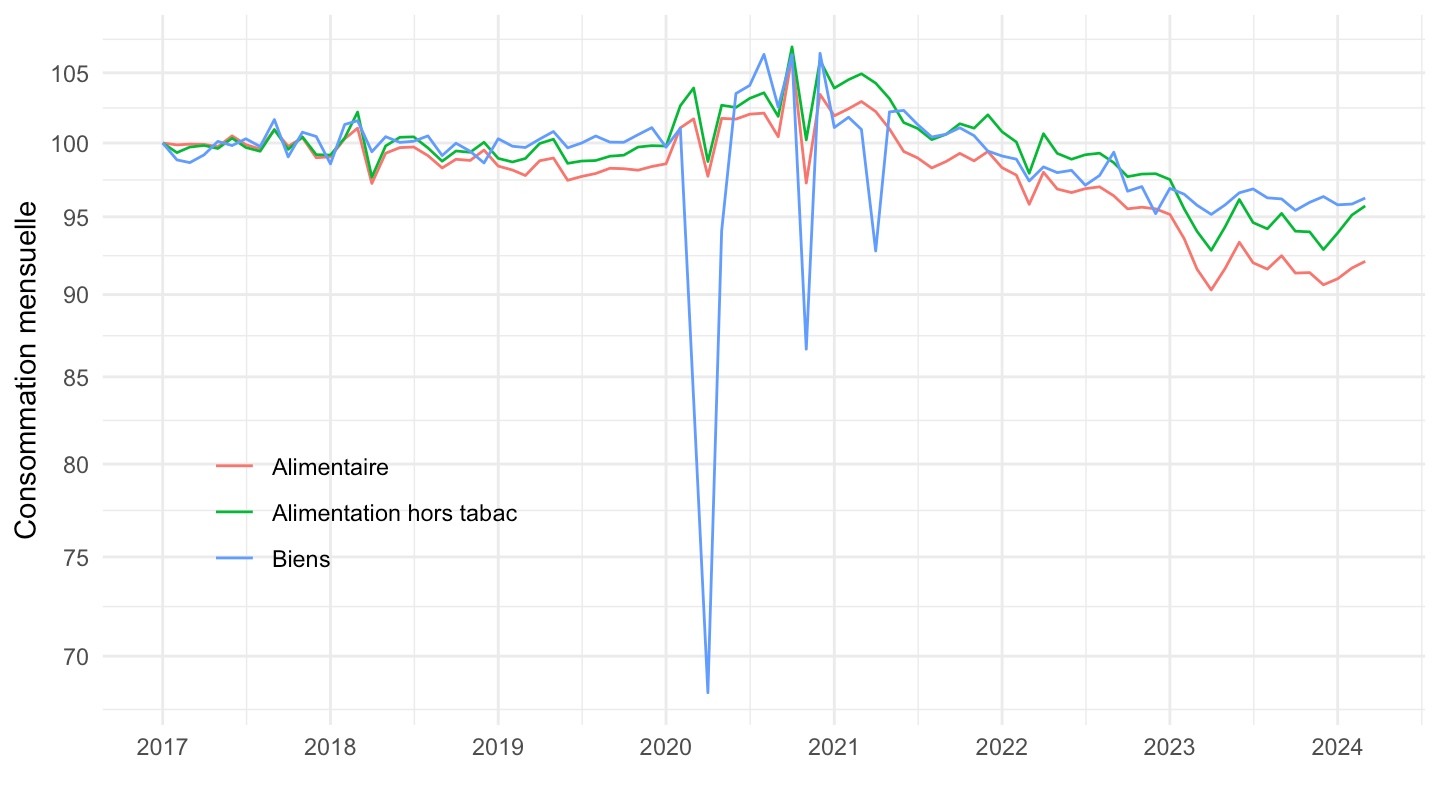
2017-

Code
`CONSO-MENAGES-2014` |>
  filter(PRODUIT_CONSO_MENAGES %in% c("BIENS", "ALIMENTAIRE", "ALIMENTAIRE-HORS-TABAC")) |>
  left_join(PRODUIT_CONSO_MENAGES,  by = "PRODUIT_CONSO_MENAGES") |>
  month_to_date() |>
  filter(date >= as.Date("2017-01-01")) |>
  group_by(Produit_conso_menages) |>
  arrange(date) |>
  mutate(OBS_VALUE = 100*OBS_VALUE/OBS_VALUE[1]) |>
  ggplot() + geom_line(aes(x = date, y = OBS_VALUE, color = Produit_conso_menages)) +
  theme_minimal() + ylab("Consommation mensuelle") + xlab("") +
  theme(legend.title = element_blank(),
        legend.position = c(0.2, 0.3)) +
  scale_x_date(breaks = seq(1950, 2100, 1) |> paste0("-01-01") |> as.Date(),
               labels = date_format("%Y")) +
  scale_y_log10(breaks = seq(10, 300, 5))

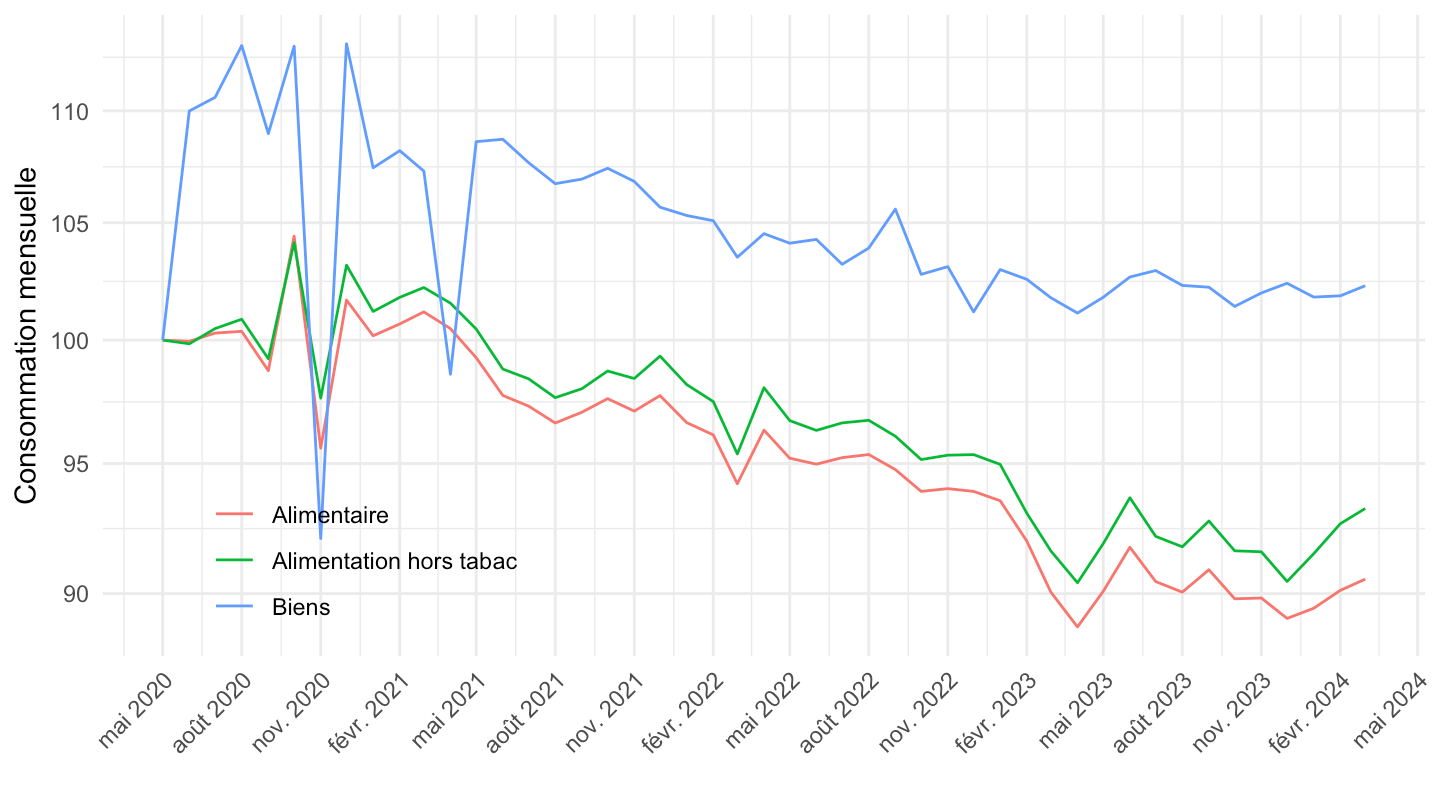
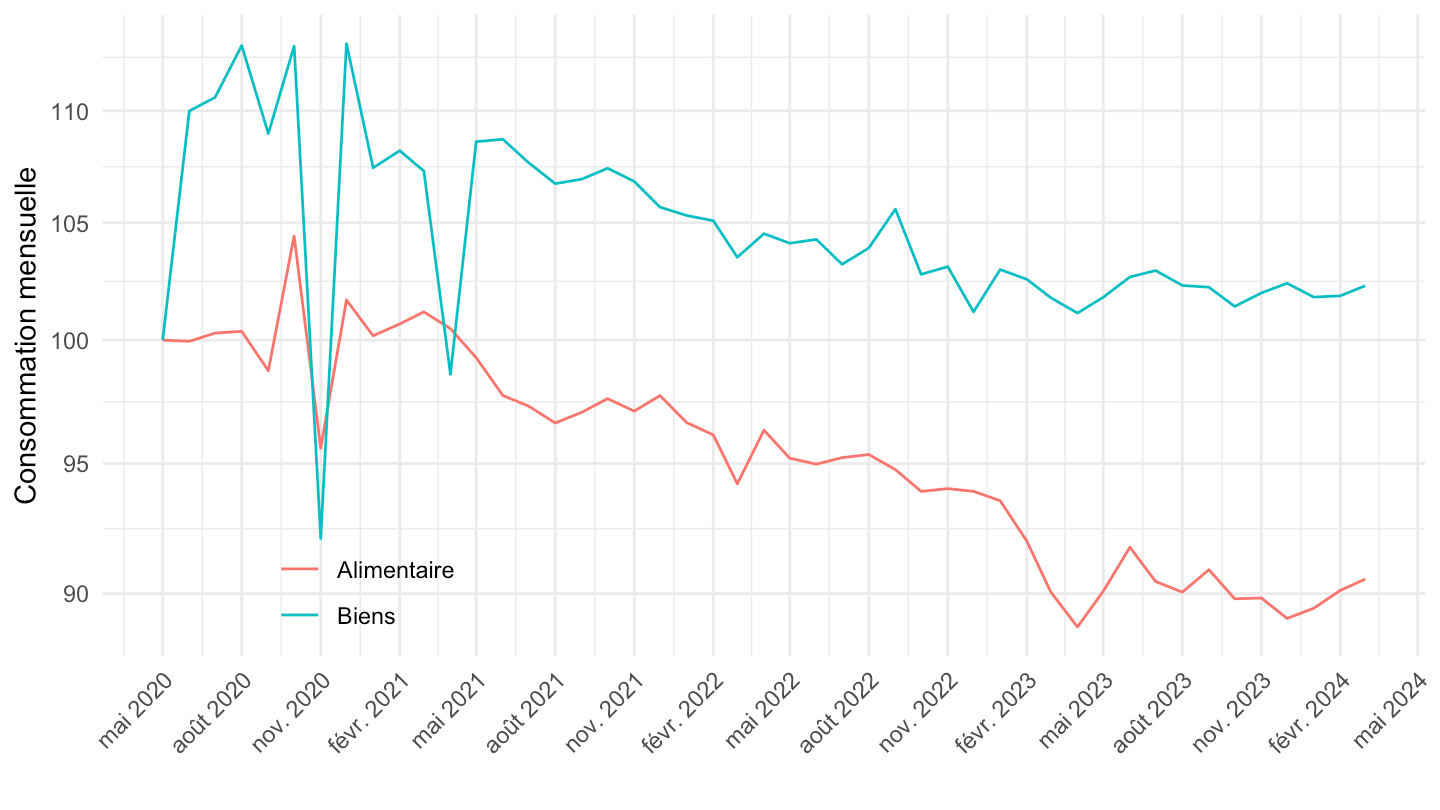
Mai 2020-

Code
invisible(Sys.setlocale("LC_TIME", "fr_CA.UTF-8"))
`CONSO-MENAGES-2014` |>
  filter(PRODUIT_CONSO_MENAGES %in% c("BIENS", "ALIMENTAIRE", "ALIMENTAIRE-HORS-TABAC")) |>
  left_join(PRODUIT_CONSO_MENAGES,  by = "PRODUIT_CONSO_MENAGES") |>
  month_to_date() |>
  filter(date >= as.Date("2020-05-01")) |>
  group_by(Produit_conso_menages) |>
  arrange(date) |>
  mutate(OBS_VALUE = 100*OBS_VALUE/OBS_VALUE[1]) |>
  ggplot() + geom_line(aes(x = date, y = OBS_VALUE, color = Produit_conso_menages)) +
  theme_minimal() + ylab("Consommation mensuelle") + xlab("") +
  theme(legend.title = element_blank(),
               axis.text.x = element_text(angle = 45, vjust = 1, hjust = 1),
        legend.position = c(0.2, 0.15)) +
  scale_x_date(breaks = "3 months",
               labels = date_format("%b %Y")) +
  scale_y_log10(breaks = seq(10, 300, 5))

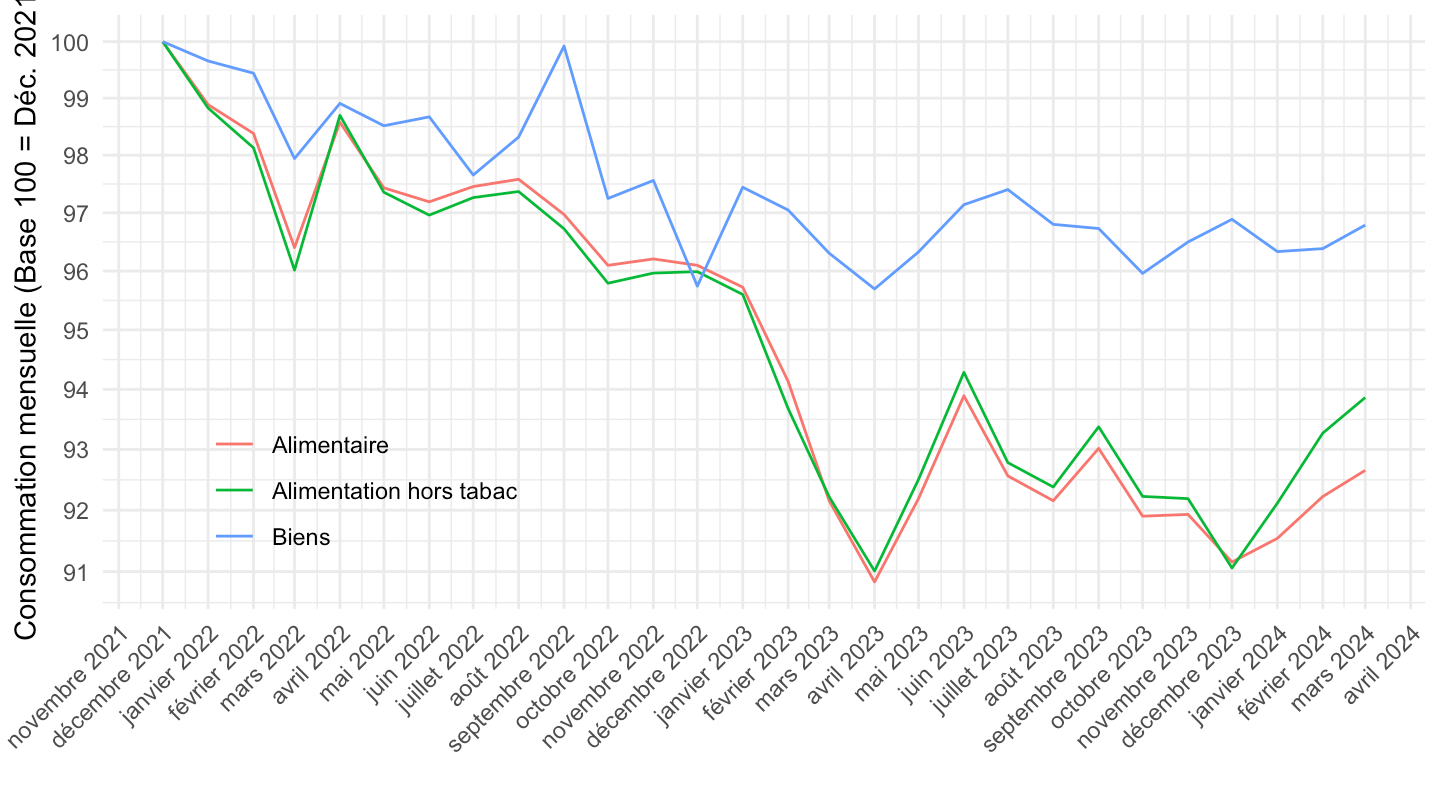
Dec 2021-

Code
invisible(Sys.setlocale("LC_TIME", "fr_CA.UTF-8"))
`CONSO-MENAGES-2014` |>
  filter(PRODUIT_CONSO_MENAGES %in% c("BIENS", "ALIMENTAIRE", "ALIMENTAIRE-HORS-TABAC")) |>
  left_join(PRODUIT_CONSO_MENAGES,  by = "PRODUIT_CONSO_MENAGES") |>
  month_to_date() |>
  filter(date >= as.Date("2021-12-01")) |>
  group_by(Produit_conso_menages) |>
  arrange(date) |>
  mutate(OBS_VALUE = 100*OBS_VALUE/OBS_VALUE[1]) |>
  ggplot() + geom_line(aes(x = date, y = OBS_VALUE, color = Produit_conso_menages)) +
  theme_minimal() + ylab("Consommation mensuelle (Base 100 = Déc. 2021)") + xlab("") +
  theme(legend.title = element_blank(),
               axis.text.x = element_text(angle = 45, vjust = 1, hjust = 1),
        legend.position = c(0.2, 0.2)) +
  scale_x_date(breaks = "1 month",
               labels = date_format("%B %Y")) +
  scale_y_log10(breaks = seq(10, 300, 1))

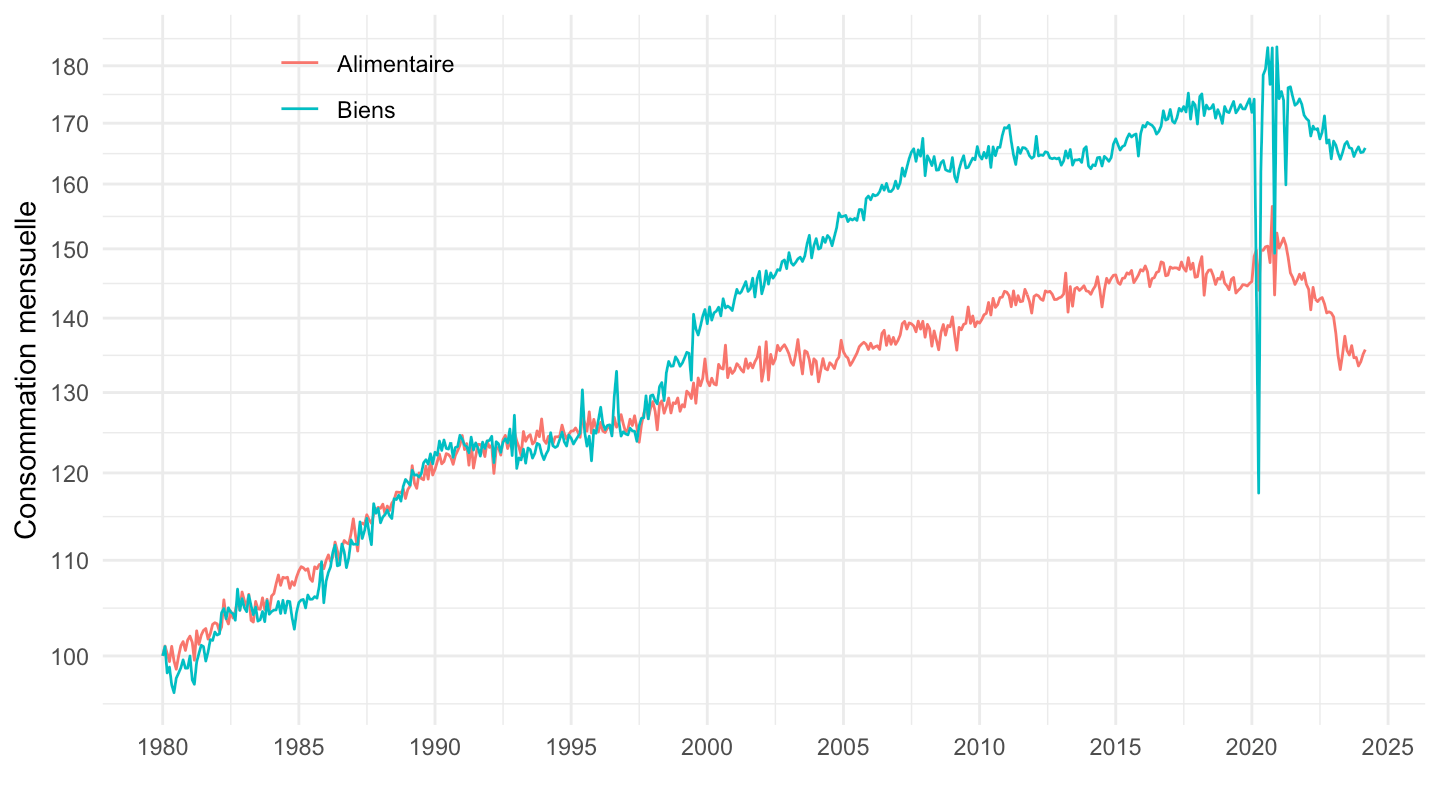
Total, Alimentaire

All

Code
`CONSO-MENAGES-2014` |>
  filter(PRODUIT_CONSO_MENAGES %in% c("BIENS", "ALIMENTAIRE")) |>
  left_join(PRODUIT_CONSO_MENAGES,  by = "PRODUIT_CONSO_MENAGES") |>
  month_to_date() |>
  group_by(Produit_conso_menages) |>
  arrange(date) |>
  mutate(OBS_VALUE = 100*OBS_VALUE/OBS_VALUE[1]) |>
  ggplot() + geom_line(aes(x = date, y = OBS_VALUE, color = Produit_conso_menages)) +
  theme_minimal() + ylab("Consommation mensuelle") + xlab("") +
  theme(legend.title = element_blank(),
        legend.position = c(0.2, 0.9)) +
  scale_x_date(breaks = seq(1950, 2100, 5) |> paste0("-01-01") |> as.Date(),
               labels = date_format("%Y")) +
  scale_y_log10(breaks = seq(100, 300, 10))

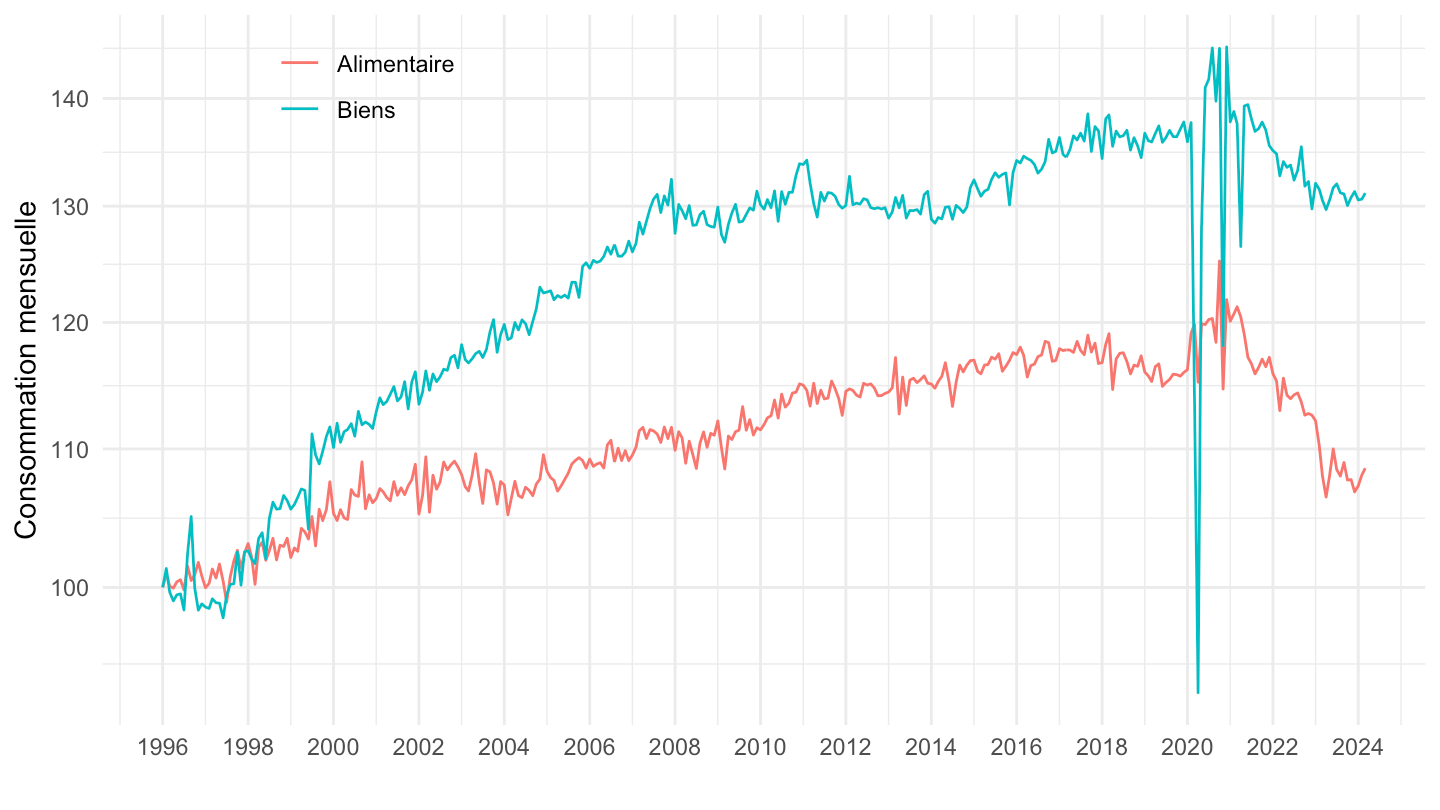
1996-

Code
`CONSO-MENAGES-2014` |>
  filter(PRODUIT_CONSO_MENAGES %in% c("BIENS", "ALIMENTAIRE")) |>
  left_join(PRODUIT_CONSO_MENAGES,  by = "PRODUIT_CONSO_MENAGES") |>
  month_to_date() |>
  filter(date >= as.Date("1996-01-01")) |>
  group_by(Produit_conso_menages) |>
  arrange(date) |>
  mutate(OBS_VALUE = 100*OBS_VALUE/OBS_VALUE[1]) |>
  ggplot() + geom_line(aes(x = date, y = OBS_VALUE, color = Produit_conso_menages)) +
  theme_minimal() + ylab("Consommation mensuelle") + xlab("") +
  theme(legend.title = element_blank(),
        legend.position = c(0.2, 0.9)) +
  scale_x_date(breaks = seq(1950, 2100, 2) |> paste0("-01-01") |> as.Date(),
               labels = date_format("%Y")) +
  scale_y_log10(breaks = seq(10, 300, 10))

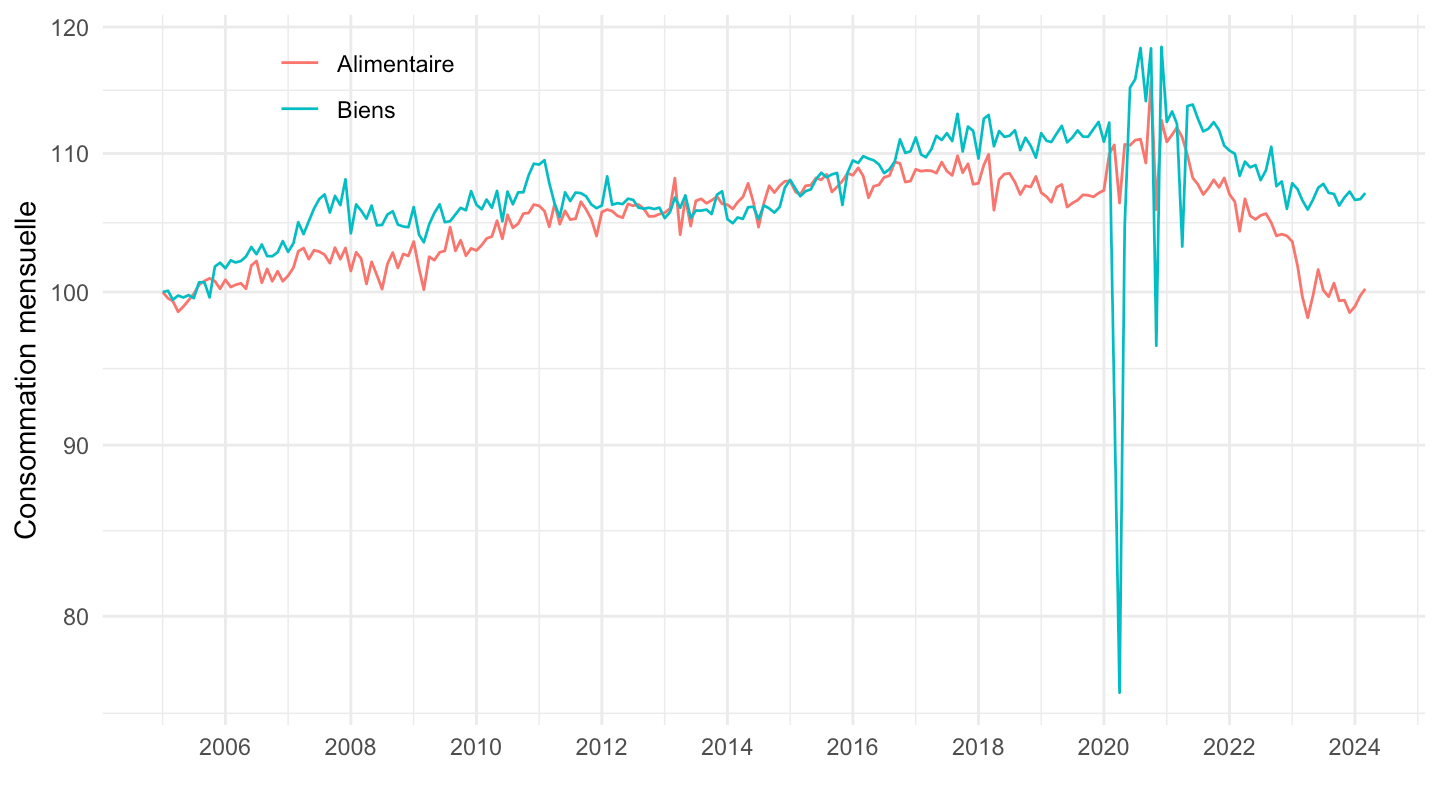
2005-

Code
`CONSO-MENAGES-2014` |>
  filter(PRODUIT_CONSO_MENAGES %in% c("BIENS", "ALIMENTAIRE")) |>
  left_join(PRODUIT_CONSO_MENAGES,  by = "PRODUIT_CONSO_MENAGES") |>
  month_to_date() |>
  filter(date >= as.Date("2005-01-01")) |>
  group_by(Produit_conso_menages) |>
  arrange(date) |>
  mutate(OBS_VALUE = 100*OBS_VALUE/OBS_VALUE[1]) |>
  ggplot() + geom_line(aes(x = date, y = OBS_VALUE, color = Produit_conso_menages)) +
  theme_minimal() + ylab("Consommation mensuelle") + xlab("") +
  theme(legend.title = element_blank(),
        legend.position = c(0.2, 0.9)) +
  scale_x_date(breaks = seq(1950, 2100, 2) |> paste0("-01-01") |> as.Date(),
               labels = date_format("%Y")) +
  scale_y_log10(breaks = seq(10, 300, 10))

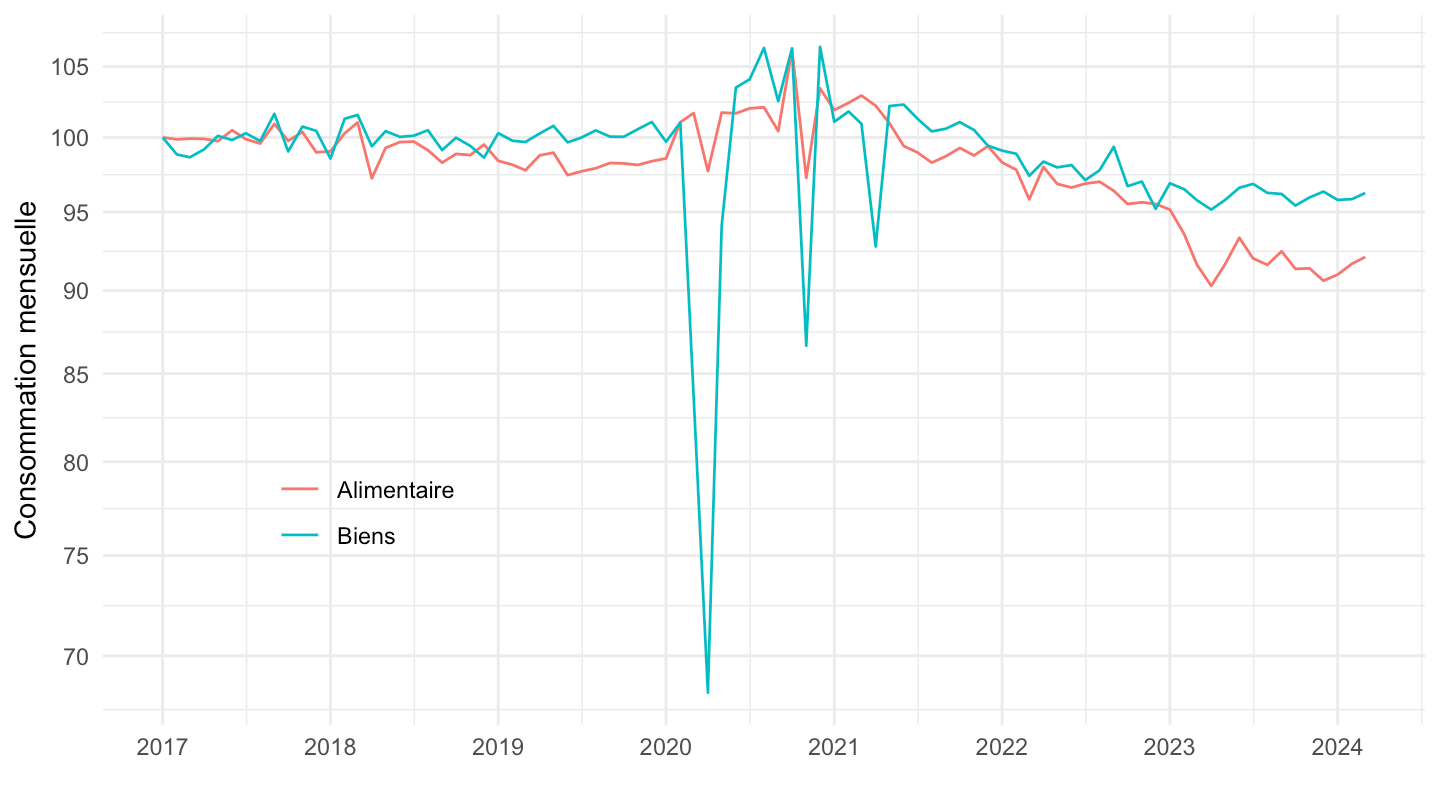
2017-

Code
`CONSO-MENAGES-2014` |>
  filter(PRODUIT_CONSO_MENAGES %in% c("BIENS", "ALIMENTAIRE")) |>
  left_join(PRODUIT_CONSO_MENAGES,  by = "PRODUIT_CONSO_MENAGES") |>
  month_to_date() |>
  filter(date >= as.Date("2017-01-01")) |>
  group_by(Produit_conso_menages) |>
  arrange(date) |>
  mutate(OBS_VALUE = 100*OBS_VALUE/OBS_VALUE[1]) |>
  ggplot() + geom_line(aes(x = date, y = OBS_VALUE, color = Produit_conso_menages)) +
  theme_minimal() + ylab("Consommation mensuelle") + xlab("") +
  theme(legend.title = element_blank(),
        legend.position = c(0.2, 0.3)) +
  scale_x_date(breaks = seq(1950, 2100, 1) |> paste0("-01-01") |> as.Date(),
               labels = date_format("%Y")) +
  scale_y_log10(breaks = seq(10, 300, 5))

Mai 2020-

Code
invisible(Sys.setlocale("LC_TIME", "fr_CA.UTF-8"))
`CONSO-MENAGES-2014` |>
  filter(PRODUIT_CONSO_MENAGES %in% c("BIENS", "ALIMENTAIRE")) |>
  left_join(PRODUIT_CONSO_MENAGES,  by = "PRODUIT_CONSO_MENAGES") |>
  month_to_date() |>
  filter(date >= as.Date("2020-05-01")) |>
  group_by(Produit_conso_menages) |>
  arrange(date) |>
  mutate(OBS_VALUE = 100*OBS_VALUE/OBS_VALUE[1]) |>
  ggplot() + geom_line(aes(x = date, y = OBS_VALUE, color = Produit_conso_menages)) +
  theme_minimal() + ylab("Consommation mensuelle") + xlab("") +
  theme(legend.title = element_blank(),
               axis.text.x = element_text(angle = 45, vjust = 1, hjust = 1),
        legend.position = c(0.2, 0.1)) +
  scale_x_date(breaks = "3 months",
               labels = date_format("%b %Y")) +
  scale_y_log10(breaks = seq(10, 300, 5))

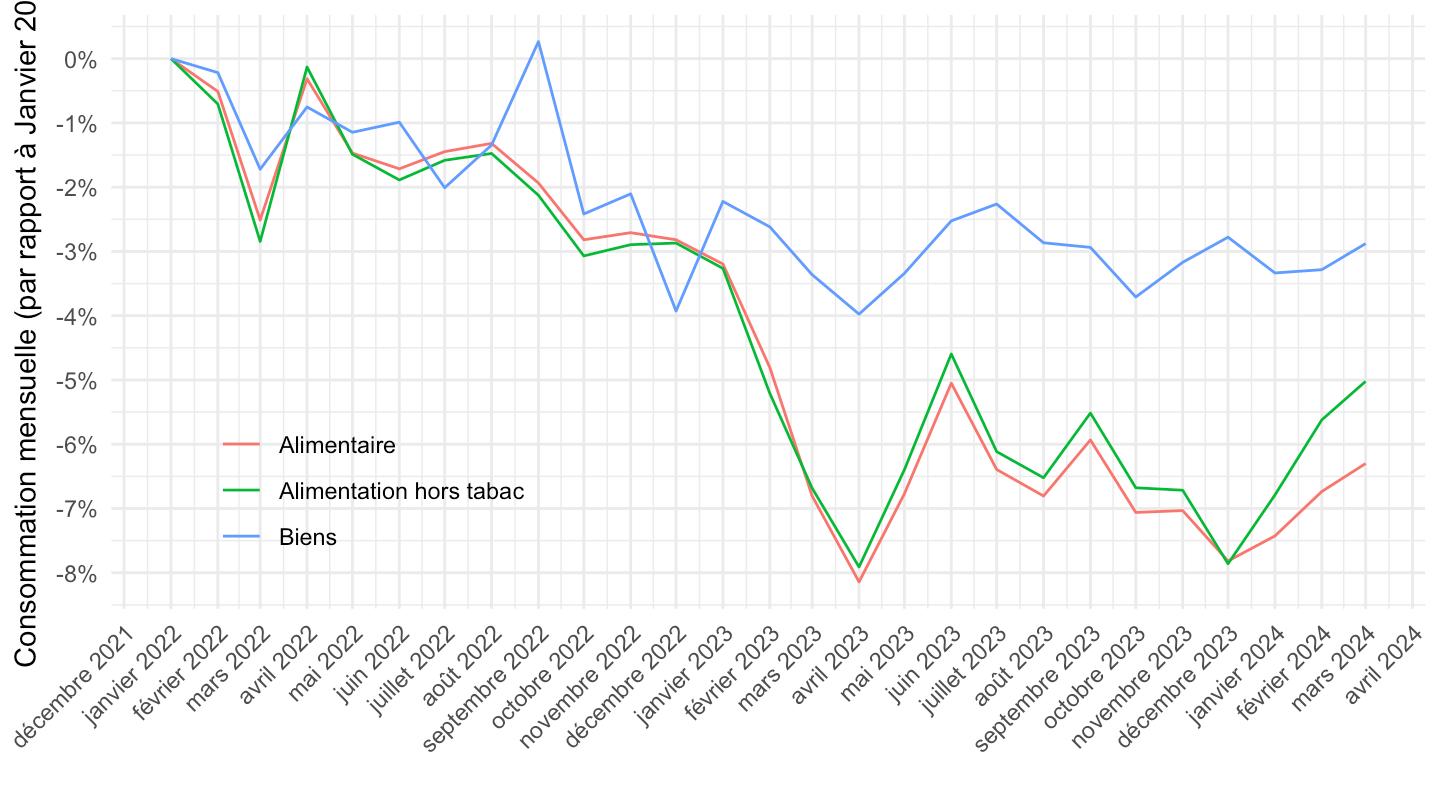
Dec 2021-

Code
invisible(Sys.setlocale("LC_TIME", "fr_CA.UTF-8"))
`CONSO-MENAGES-2014` |>
  filter(PRODUIT_CONSO_MENAGES %in% c("BIENS", "ALIMENTAIRE", "ALIMENTAIRE-HORS-TABAC")) |>
  left_join(PRODUIT_CONSO_MENAGES,  by = "PRODUIT_CONSO_MENAGES") |>
  month_to_date() |>
  filter(date >= as.Date("2022-01-01")) |>
  group_by(Produit_conso_menages) |>
  arrange(date) |>
  mutate(OBS_VALUE = OBS_VALUE/OBS_VALUE[1]-1) |>
  ggplot() + geom_line(aes(x = date, y = OBS_VALUE, color = Produit_conso_menages)) +
  theme_minimal() + ylab("Consommation mensuelle (par rapport à Janvier 2022)") + xlab("") +
  theme(legend.title = element_blank(),
               axis.text.x = element_text(angle = 45, vjust = 1, hjust = 1),
        legend.position = c(0.2, 0.2)) +
  scale_x_date(breaks = "1 month",
               labels = date_format("%B %Y")) +
  scale_y_continuous(breaks = 0.01*seq(-100, 300, 1),
                labels = percent_format(acc = 1))

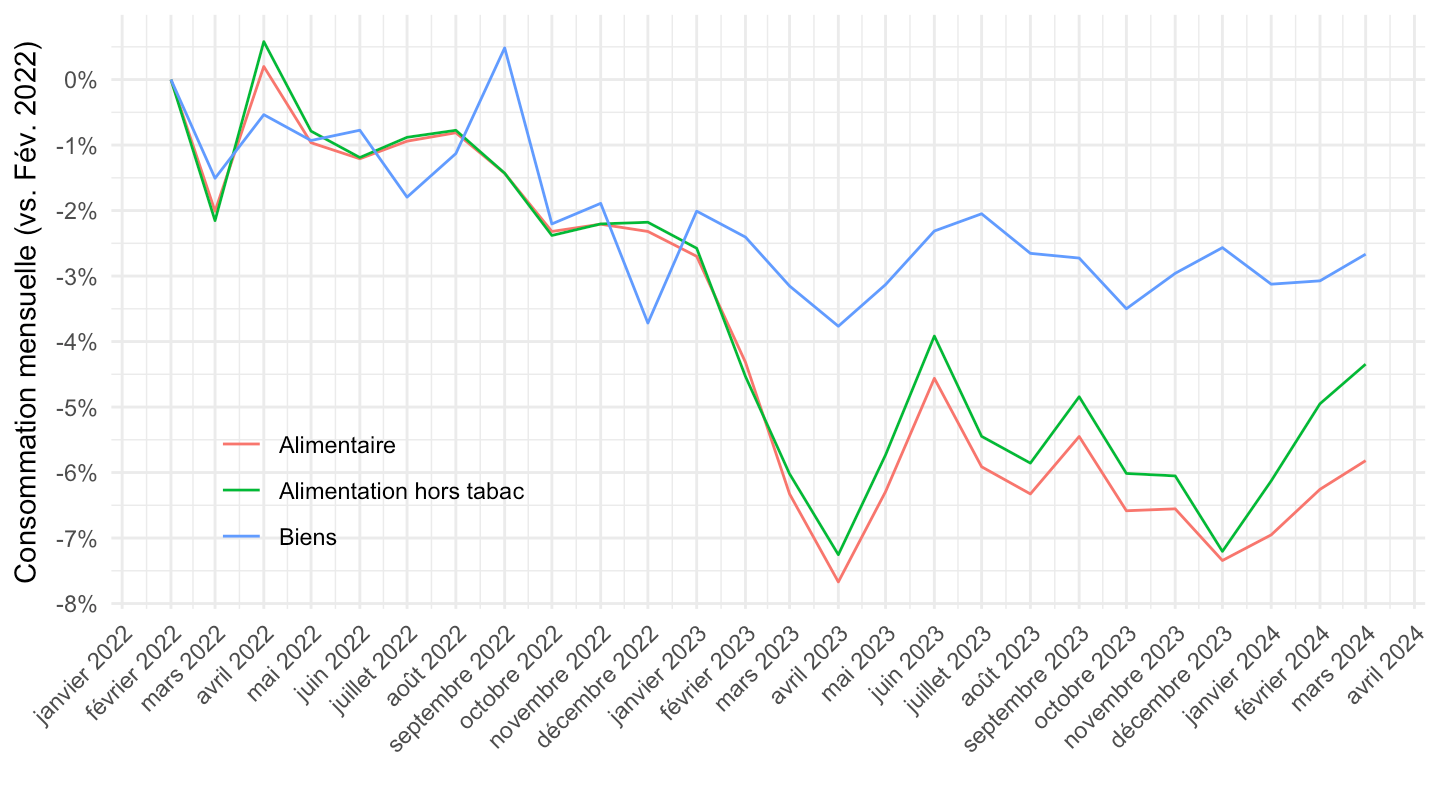
Feb 2022

Code
invisible(Sys.setlocale("LC_TIME", "fr_CA.UTF-8"))
`CONSO-MENAGES-2014` |>
  filter(PRODUIT_CONSO_MENAGES %in% c("BIENS", "ALIMENTAIRE", "ALIMENTAIRE-HORS-TABAC")) |>
  left_join(PRODUIT_CONSO_MENAGES,  by = "PRODUIT_CONSO_MENAGES") |>
  month_to_date() |>
  filter(date >= as.Date("2022-02-01")) |>
  group_by(Produit_conso_menages) |>
  arrange(date) |>
  mutate(OBS_VALUE = OBS_VALUE/OBS_VALUE[1]-1) |>
  ggplot() + geom_line(aes(x = date, y = OBS_VALUE, color = Produit_conso_menages)) +
  theme_minimal() + ylab("Consommation mensuelle (vs. Fév. 2022)") + xlab("") +
  theme(legend.title = element_blank(),
               axis.text.x = element_text(angle = 45, vjust = 1, hjust = 1),
        legend.position = c(0.2, 0.2)) +
  scale_x_date(breaks = "1 month",
               labels = date_format("%B %Y")) +
  scale_y_continuous(breaks = 0.01*seq(-100, 300, 1),
                labels = percent_format(acc = 1))

24 months

Code
invisible(Sys.setlocale("LC_TIME", "fr_CA.UTF-8"))
`CONSO-MENAGES-2014` |>
  filter(PRODUIT_CONSO_MENAGES %in% c("BIENS", "ALIMENTAIRE", "ALIMENTAIRE-HORS-TABAC")) |>
  left_join(PRODUIT_CONSO_MENAGES,  by = "PRODUIT_CONSO_MENAGES") |>
  month_to_date() |>
  filter(date >= Sys.Date() - months(24)) |>
  group_by(Produit_conso_menages) |>
  arrange(date) |>
  mutate(OBS_VALUE = OBS_VALUE/OBS_VALUE[1]-1) |>
  ggplot() + geom_line(aes(x = date, y = OBS_VALUE, color = Produit_conso_menages)) +
  theme_minimal() + ylab("Consommation mensuelle (par rapport à Janvier 2022)") + xlab("") +
  theme(legend.title = element_blank(),
               axis.text.x = element_text(angle = 45, vjust = 1, hjust = 1),
        legend.position = c(0.2, 0.2)) +
  scale_x_date(breaks = "1 month",
               labels = date_format("%B %Y")) +
  scale_y_continuous(breaks = 0.01*seq(-100, 300, 1),
                labels = percent_format(acc = 1))

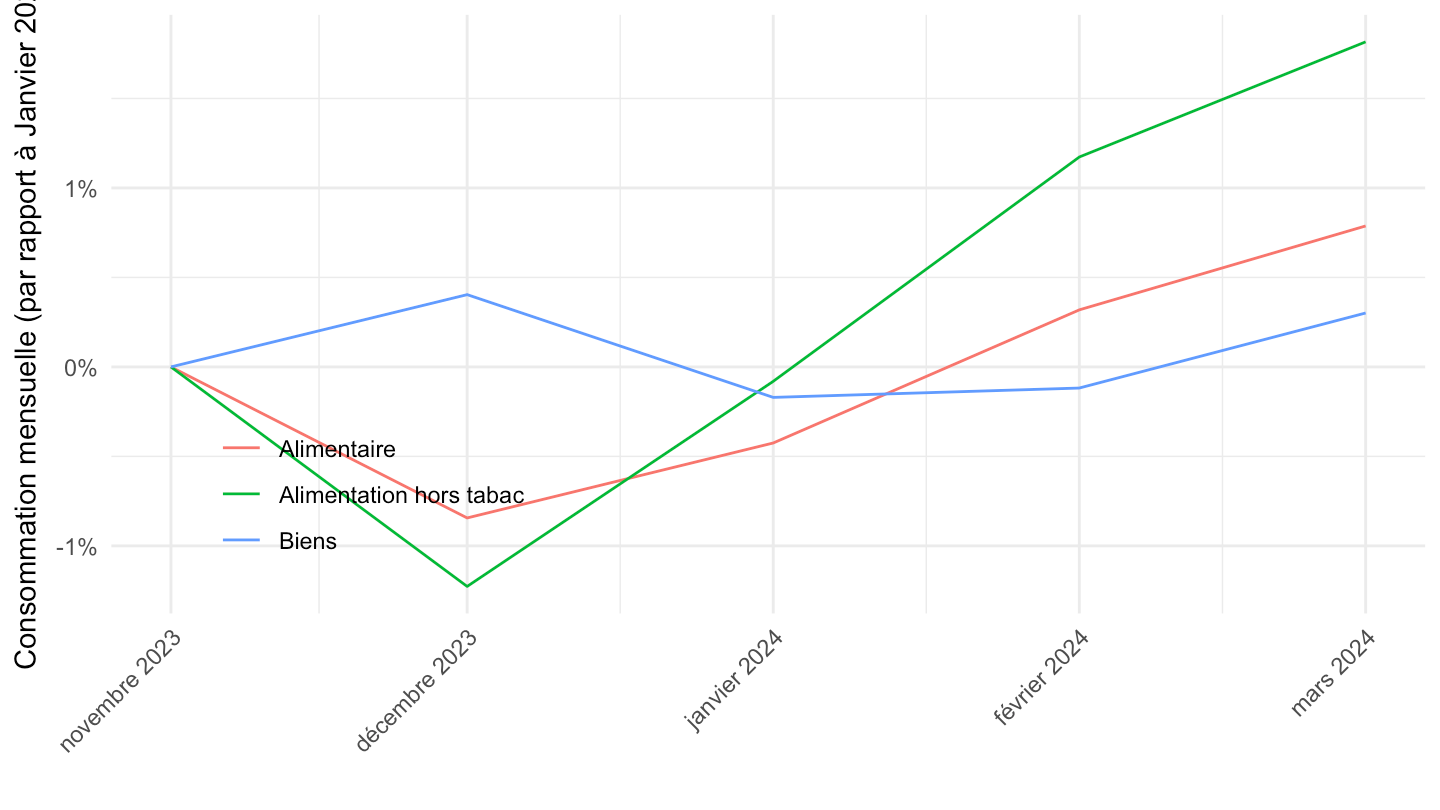
18 months

Code
invisible(Sys.setlocale("LC_TIME", "fr_CA.UTF-8"))
`CONSO-MENAGES-2014` |>
  filter(PRODUIT_CONSO_MENAGES %in% c("BIENS", "ALIMENTAIRE", "ALIMENTAIRE-HORS-TABAC")) |>
  left_join(PRODUIT_CONSO_MENAGES,  by = "PRODUIT_CONSO_MENAGES") |>
  month_to_date() |>
  filter(date >= Sys.Date() - months(18)) |>
  group_by(Produit_conso_menages) |>
  arrange(date) |>
  mutate(OBS_VALUE = OBS_VALUE/OBS_VALUE[1]-1) |>
  ggplot() + geom_line(aes(x = date, y = OBS_VALUE, color = Produit_conso_menages)) +
  theme_minimal() + ylab("Consommation mensuelle (par rapport à Janvier 2022)") + xlab("") +
  theme(legend.title = element_blank(),
               axis.text.x = element_text(angle = 45, vjust = 1, hjust = 1),
        legend.position = c(0.2, 0.2)) +
  scale_x_date(breaks = "1 month",
               labels = date_format("%B %Y")) +
  scale_y_continuous(breaks = 0.01*seq(-100, 300, 1),
                labels = percent_format(acc = 1))

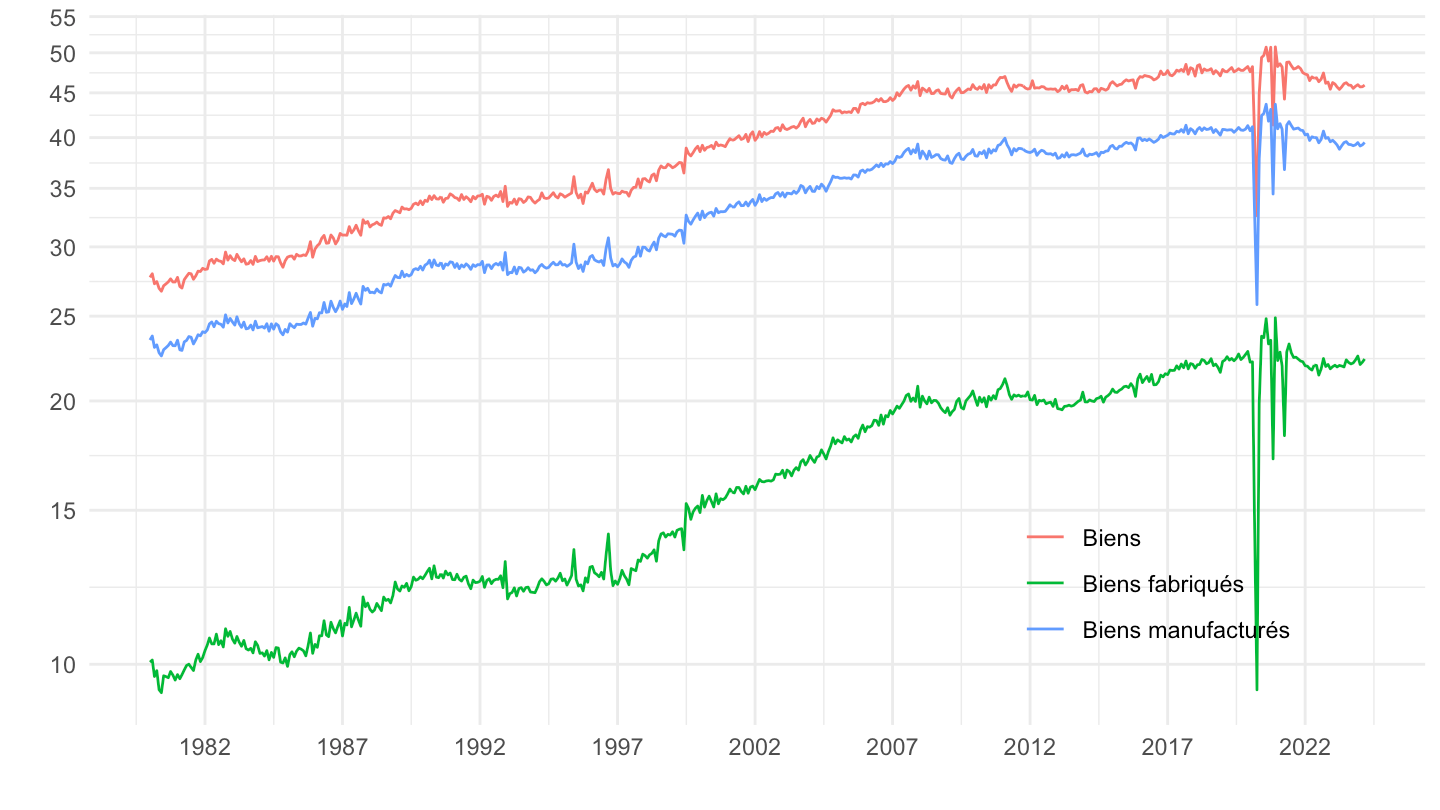
Biens, Biens Manufacturés, Biens Fabriqués

All

Code
`CONSO-MENAGES-2014` |>
  filter(PRODUIT_CONSO_MENAGES %in% c("BIENS", "BIENS-MANUFACTURES", "BIENS-FABRIQUES")) |>
  left_join(PRODUIT_CONSO_MENAGES,  by = "PRODUIT_CONSO_MENAGES") |>
  month_to_date() |>
  ggplot() + geom_line(aes(x = date, y = OBS_VALUE, color = Produit_conso_menages)) +
  xlab("") + ylab("") +  theme_minimal() +
  scale_x_date(breaks = "5 years",
               labels = date_format("%Y")) +
  scale_y_log10(breaks = seq(0, 120, 5)) +
  theme(legend.position = c(0.8, 0.2),
        legend.title = element_blank())

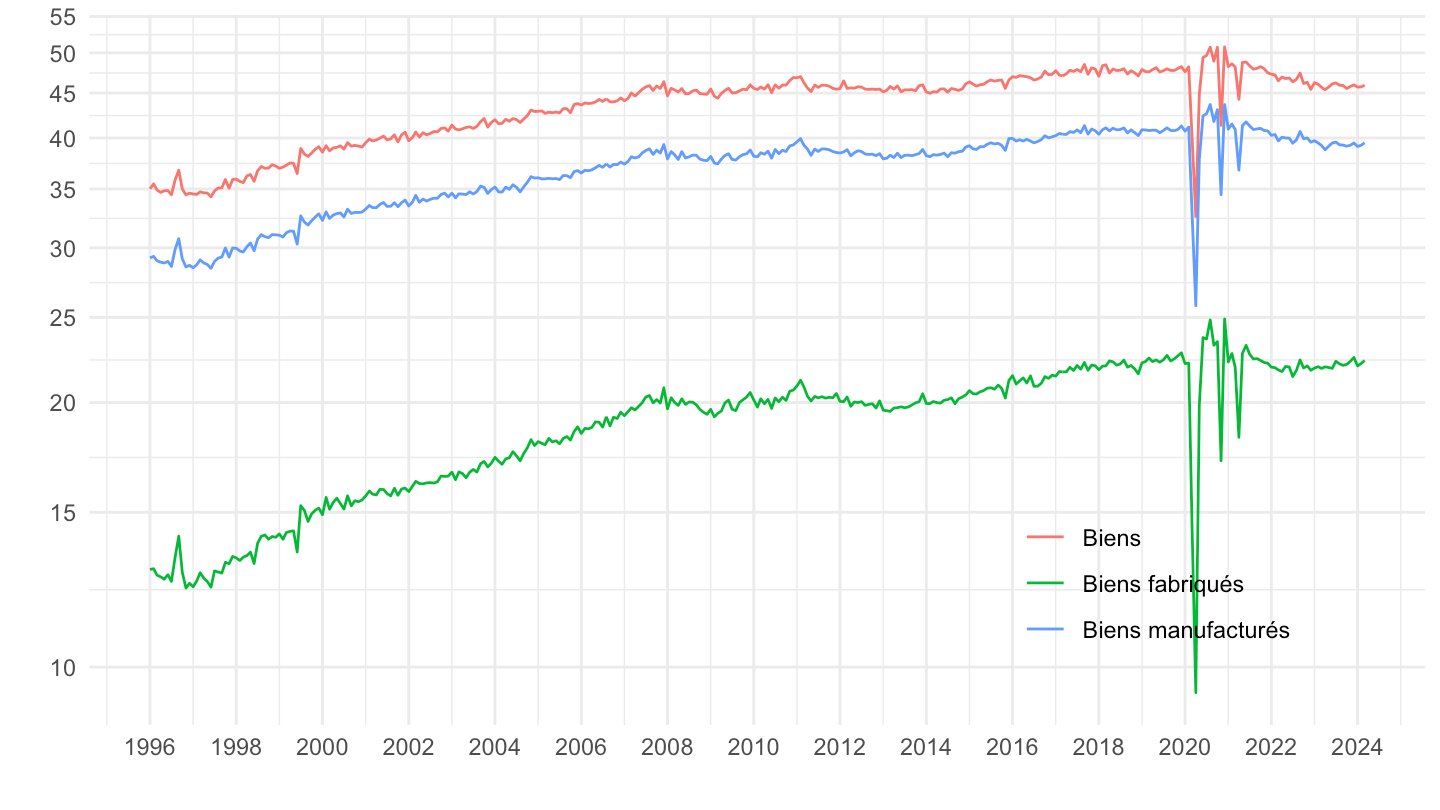
1996-

Code
`CONSO-MENAGES-2014` |>
  filter(PRODUIT_CONSO_MENAGES %in% c("BIENS", "BIENS-MANUFACTURES", "BIENS-FABRIQUES")) |>
  left_join(PRODUIT_CONSO_MENAGES,  by = "PRODUIT_CONSO_MENAGES") |>
  month_to_date() |>
  filter(date >= as.Date("1996-01-01")) |>
  ggplot() + geom_line(aes(x = date, y = OBS_VALUE, color = Produit_conso_menages)) +
  xlab("") + ylab("") +  theme_minimal() +
  scale_x_date(breaks = seq(1920, 2100, 2) |> paste0("-01-01") |> as.Date(),
               labels = date_format("%Y")) +
  scale_y_log10(breaks = seq(0, 120, 5)) +
  
  theme(legend.position = c(0.8, 0.2),
        legend.title = element_blank())

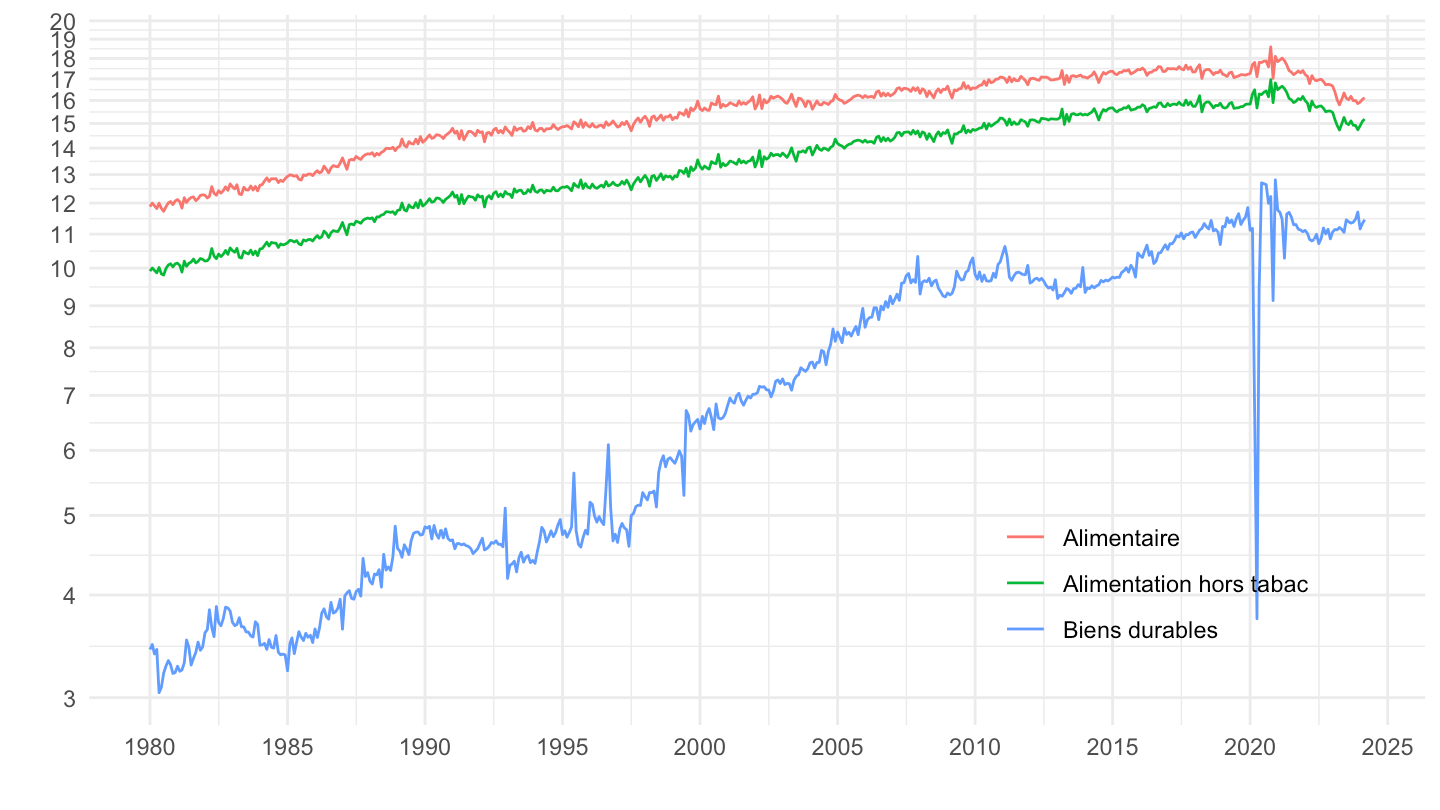
Alimentaire, Alimentaire hors Tabac, Biens durables

All

Code
`CONSO-MENAGES-2014` |>
  filter(PRODUIT_CONSO_MENAGES %in% c("ALIMENTAIRE", "ALIMENTAIRE-HORS-TABAC", "BIENS-DURABLES")) |>
  left_join(PRODUIT_CONSO_MENAGES,  by = "PRODUIT_CONSO_MENAGES") |>
  month_to_date() |>
  ggplot() + geom_line(aes(x = date, y = OBS_VALUE, color = Produit_conso_menages)) +
  xlab("") + ylab("") +  theme_minimal() +
  scale_x_date(breaks = seq(1920, 2100, 5) |> paste0("-01-01") |> as.Date(),
               labels = date_format("%Y")) +
  scale_y_log10(breaks = seq(0, 120, 1)) +
  
  theme(legend.position = c(0.8, 0.2),
        legend.title = element_blank())

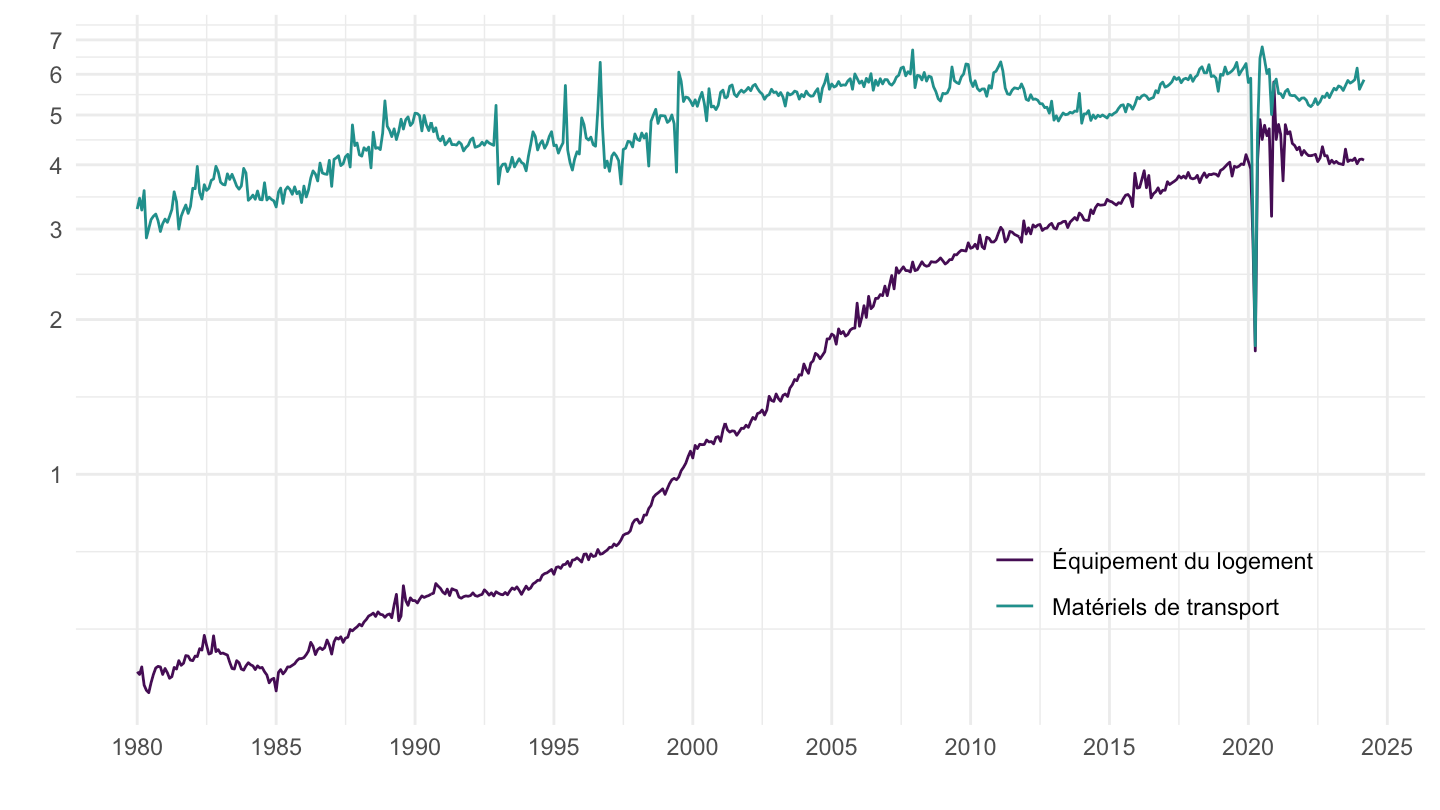
Equipement du logement, Matériels de Transport

Code
`CONSO-MENAGES-2014` |>
  filter(PRODUIT_CONSO_MENAGES %in% c("MATERIELS-TRANSPORT", "EQUIPEMENT-LOGEMENT")) |>
  left_join(PRODUIT_CONSO_MENAGES,  by = "PRODUIT_CONSO_MENAGES") |>
  month_to_date() |>
  ggplot() + geom_line(aes(x = date, y = OBS_VALUE, color = Produit_conso_menages)) +
  xlab("") + ylab("") +  theme_minimal() +
  scale_x_date(breaks = seq(1920, 2100, 5) |> paste0("-01-01") |> as.Date(),
               labels = date_format("%Y")) +
  scale_y_log10(breaks = seq(0, 120, 1)) +
  scale_color_manual(values = viridis(3)[1:2]) +
  theme(legend.position = c(0.8, 0.2),
        legend.title = element_blank())

Dec 2021

Table

Code
`CONSO-MENAGES-2014` |>
  left_join(PRODUIT_CONSO_MENAGES,  by = "PRODUIT_CONSO_MENAGES") |>
  filter(TIME_PERIOD %in% c("2021-12", "2023-05")) |>
  select(TIME_PERIOD, PRODUIT_CONSO_MENAGES, Produit_conso_menages, OBS_VALUE) |>
  spread(TIME_PERIOD, OBS_VALUE) |>
  mutate(croissance = round(100*(`2023-05`/`2021-12`-1), 1)) |>
  arrange(croissance) |>
  print_table_conditional()
PRODUIT_CONSO_MENAGES Produit_conso_menages 2021-12 2023-05 croissance
ALIMENTAIRE Alimentaire 17.400 16.041 -7.8
ALIMENTAIRE-HORS-TABAC Alimentation hors tabac 16.183 14.970 -7.5
BIENS-DURABLES-EQUIPEMENT Biens durables d'équipement personnel 1.552 1.474 -5.0
BIENS-MANUFACTURES Biens manufacturés 40.752 39.149 -3.9
EQUIPEMENT-LOGEMENT Équipement du logement 4.177 4.015 -3.9
BIENS Biens 47.450 45.707 -3.7
TEXTILE Textile-cuir 4.272 4.129 -3.3
BIENS-FABRIQUES-AUTRES Autres biens fabriqués 6.830 6.655 -2.6
ENERGIE_C2 Cokéfaction et raffinage (C2) 3.705 3.646 -1.6
PRODUITS-PETROLIERS Produits pétroliers 4.757 4.694 -1.3
BIENS-FABRIQUES Biens fabriqués 22.174 21.925 -1.1
ENERGIE_DEC2 Énergie, eau, déchets, cokéfaction et raffinage (DE, C2) 7.919 7.871 -0.6
ENERGIE_DE Énergie, eau et déchets (DE) 4.251 4.242 -0.2
ENERGIE_PETROLE Énergie hors produits pétroliers 3.187 3.193 0.2
BIENS-DURABLES Biens durables 11.077 11.149 0.6
MATERIELS-TRANSPORT Matériels de transport 5.392 5.668 5.1

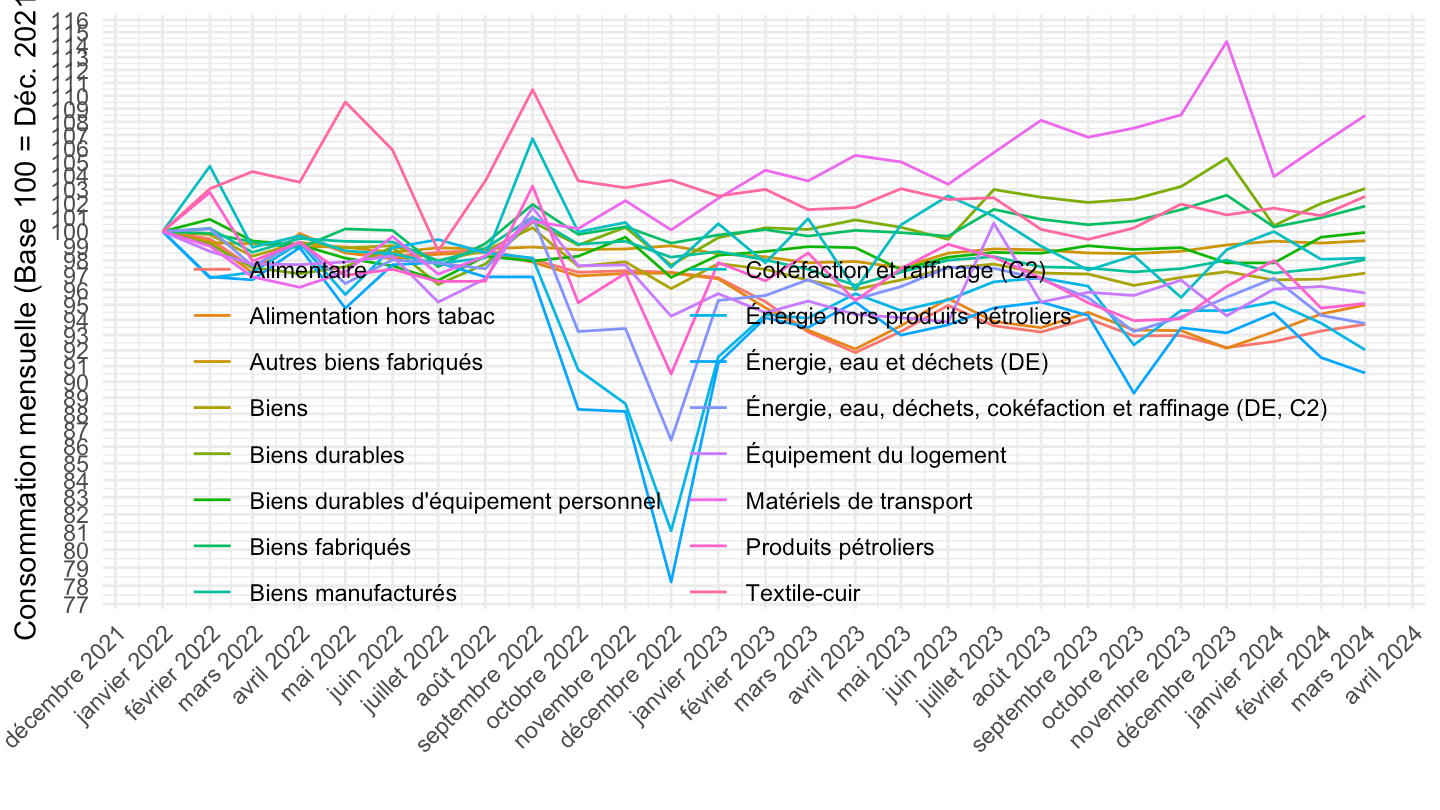
Graph

Code
invisible(Sys.setlocale("LC_TIME", "fr_CA.UTF-8"))
`CONSO-MENAGES-2014` |>
  left_join(PRODUIT_CONSO_MENAGES,  by = "PRODUIT_CONSO_MENAGES") |>
  month_to_date() |>
  filter(date >= as.Date("2022-01-01")) |>
  group_by(Produit_conso_menages) |>
  arrange(date) |>
  mutate(OBS_VALUE = 100*OBS_VALUE/OBS_VALUE[1]) |>
  ggplot() + geom_line(aes(x = date, y = OBS_VALUE, color = Produit_conso_menages)) +
  theme_minimal() + ylab("Consommation mensuelle (Base 100 = Déc. 2021)") + xlab("") +
  theme(legend.title = element_blank(),
               axis.text.x = element_text(angle = 45, vjust = 1, hjust = 1),
        legend.position = c(0.5, 0.3)) +
  scale_x_date(breaks = "1 month",
               labels = date_format("%B %Y")) +
  scale_y_log10(breaks = seq(10, 300, 1)) +
  guides(color=guide_legend(ncol=2))

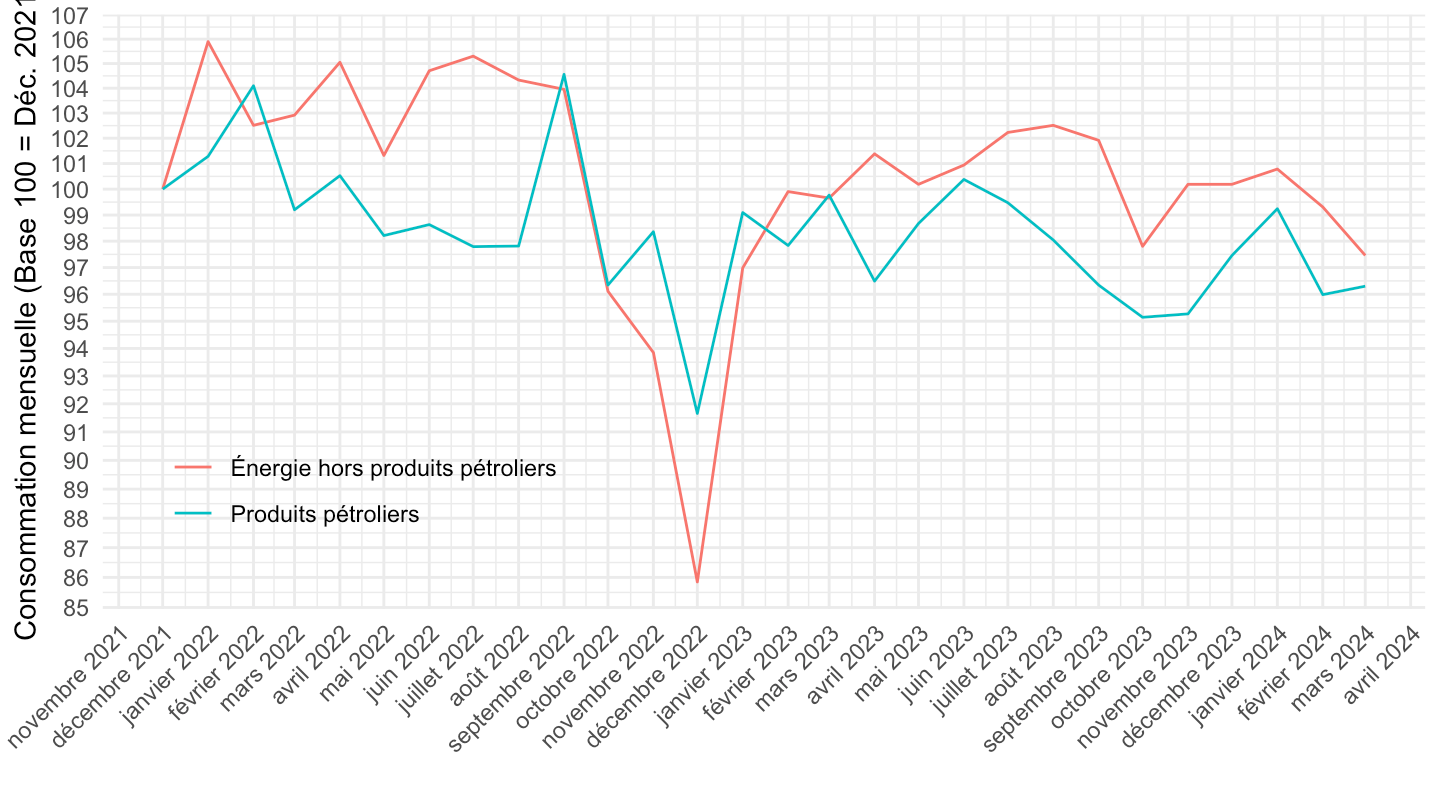
Produits pétroliers

Code
invisible(Sys.setlocale("LC_TIME", "fr_CA.UTF-8"))
`CONSO-MENAGES-2014` |>
  filter(PRODUIT_CONSO_MENAGES %in% c("PRODUITS-PETROLIERS", "ENERGIE_PETROLE")) |>
  left_join(PRODUIT_CONSO_MENAGES,  by = "PRODUIT_CONSO_MENAGES") |>
  month_to_date() |>
  filter(date >= as.Date("2021-12-01")) |>
  group_by(Produit_conso_menages) |>
  arrange(date) |>
  mutate(OBS_VALUE = 100*OBS_VALUE/OBS_VALUE[1]) |>
  ggplot() + geom_line(aes(x = date, y = OBS_VALUE, color = Produit_conso_menages)) +
  theme_minimal() + ylab("Consommation mensuelle (Base 100 = Déc. 2021)") + xlab("") +
  theme(legend.title = element_blank(),
               axis.text.x = element_text(angle = 45, vjust = 1, hjust = 1),
        legend.position = c(0.2, 0.2)) +
  scale_x_date(breaks = "1 month",
               labels = date_format("%B %Y")) +
  scale_y_log10(breaks = seq(10, 300, 1))