Code
WEO %>%
  left_join(CL_SUBJECT_WEO, by = "SUBJECT") %>%
  group_by(SUBJECT, Subject) %>%
  summarise(Nobs = n()) %>%
  arrange(-Nobs) %>%
{if (is_html_output()) datatable(., filter = 'top', rownames = F) else .}Data - IMF
WEO %>%
left_join(CL_SUBJECT_WEO, by = "SUBJECT") %>%
group_by(SUBJECT, Subject) %>%
summarise(Nobs = n()) %>%
arrange(-Nobs) %>%
{if (is_html_output()) datatable(., filter = 'top', rownames = F) else .}WEO_PUB_OCT2020 %>%
left_join(REF_AREA, by = "REF_AREA") %>%
group_by(REF_AREA, Ref_area) %>%
summarise(Nobs = n()) %>%
arrange(-Nobs) %>%
mutate(Flag = gsub(" ", "-", str_to_lower(gsub(" ", "-", Ref_area))),
Flag = paste0('<img src="../../icon/flag/vsmall/', Flag, '.png" alt="Flag">')) %>%
select(Flag, everything()) %>%
{if (is_html_output()) datatable(., filter = 'top', rownames = F, escape = F) else .}WEO %>%
left_join(CL_AREA_WEO, by = "iso2c") %>%
filter(SUBJECT == "NGAP_NPGDP",
Iso2c %in% c("Italy", "France", "Greece", "Spain", "Germany"),
date >= as.Date("2000-01-01")) %>%
ggplot() +
geom_line(aes(x = date, y = value/100, color = Iso2c)) +
theme_minimal() +
scale_x_date(breaks = seq(1920, 2100, 2) %>% paste0("-01-01") %>% as.Date,
labels = date_format("%Y")) +
theme(legend.position = c(0.15, 0.2),
legend.title = element_blank()) +
scale_y_continuous(breaks = 0.01*seq(-90, 90, 2),
labels = percent_format(accuracy = 1)) +
ylab("Output Gap (% of Potential Output)") + xlab("")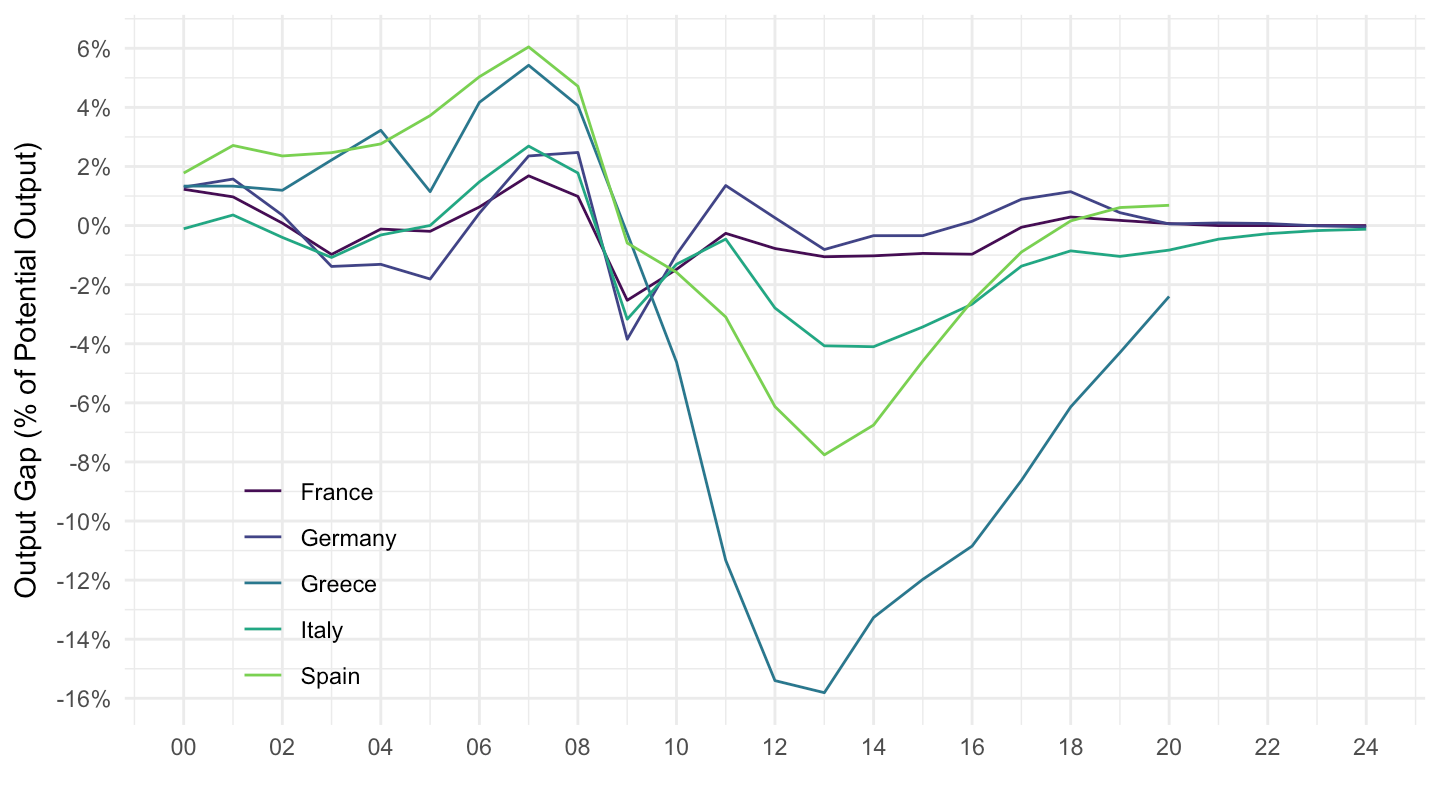
WEO_PUB_OCT2020 %>%
  time_to_date %>%
  left_join(REF_AREA, by = "REF_AREA") %>%
  filter(CONCEPT == "NGAP_NPGDP",
         Ref_area %in% c("Italy", "France", "Greece", "Spain", "Germany"),
         date >= as.Date("2000-01-01")) %>%
  ggplot() +
  geom_line(aes(x = date, y = OBS_VALUE/100, color = Ref_area)) +
  scale_color_manual(values = c("#ED2939", "#000000", "#0D5EAF", "#009246", "#FFC400")) +
  theme_minimal() +
  scale_x_date(breaks = seq(1920, 2100, 2) %>% paste0("-01-01") %>% as.Date,
               labels = date_format("%Y")) +
  theme(legend.position = c(0.15, 0.2),
        legend.title = element_blank()) +
  scale_y_continuous(breaks = 0.01*seq(-90, 90, 2),
                     labels = percent_format(accuracy = 1)) +
  ylab("Output Gap (% of Potential Output)") + xlab("")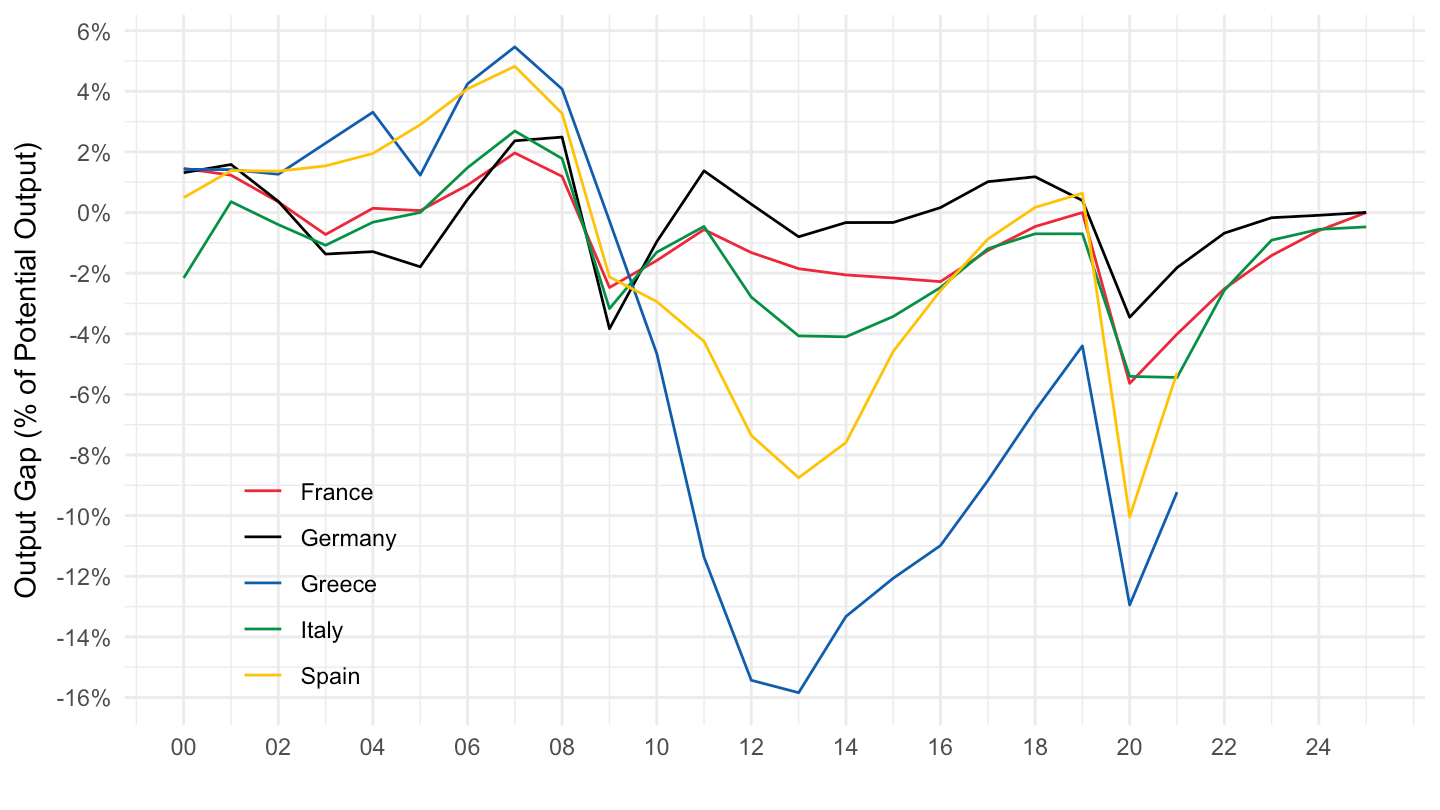
WEO_PUB_OCT2020 %>%
  time_to_date %>%
  left_join(REF_AREA, by = "REF_AREA") %>%
  filter(CONCEPT == "NGAP_NPGDP",
         Ref_area %in% c("Italy", "France", "Greece", "Spain", "Germany"),
         date >= as.Date("2000-01-01")) %>%
  ggplot() +
  geom_line(aes(x = date, y = OBS_VALUE/100, color = Ref_area)) +
  scale_color_manual(values = c("#ED2939", "#000000", "#0D5EAF", "#009246", "#FFC400")) +
  theme_minimal() +
  scale_x_date(breaks = seq(1920, 2100, 2) %>% paste0("-01-01") %>% as.Date,
               labels = date_format("%Y")) +
  geom_image(data = . %>%
               filter(date == as.Date("2014-01-01")) %>%
               mutate(image = paste0("../../icon/flag/", str_to_lower(gsub(" ", "-", Ref_area)), ".png")),
             aes(x = date, y = OBS_VALUE/100, image = image), asp = 1.5) +
  theme(legend.position = c(0.15, 0.2),
        legend.title = element_blank()) +
  scale_y_continuous(breaks = 0.01*seq(-90, 90, 2),
                     labels = percent_format(accuracy = 1)) +
  ylab("Output Gap (% of Potential Output)") + xlab("")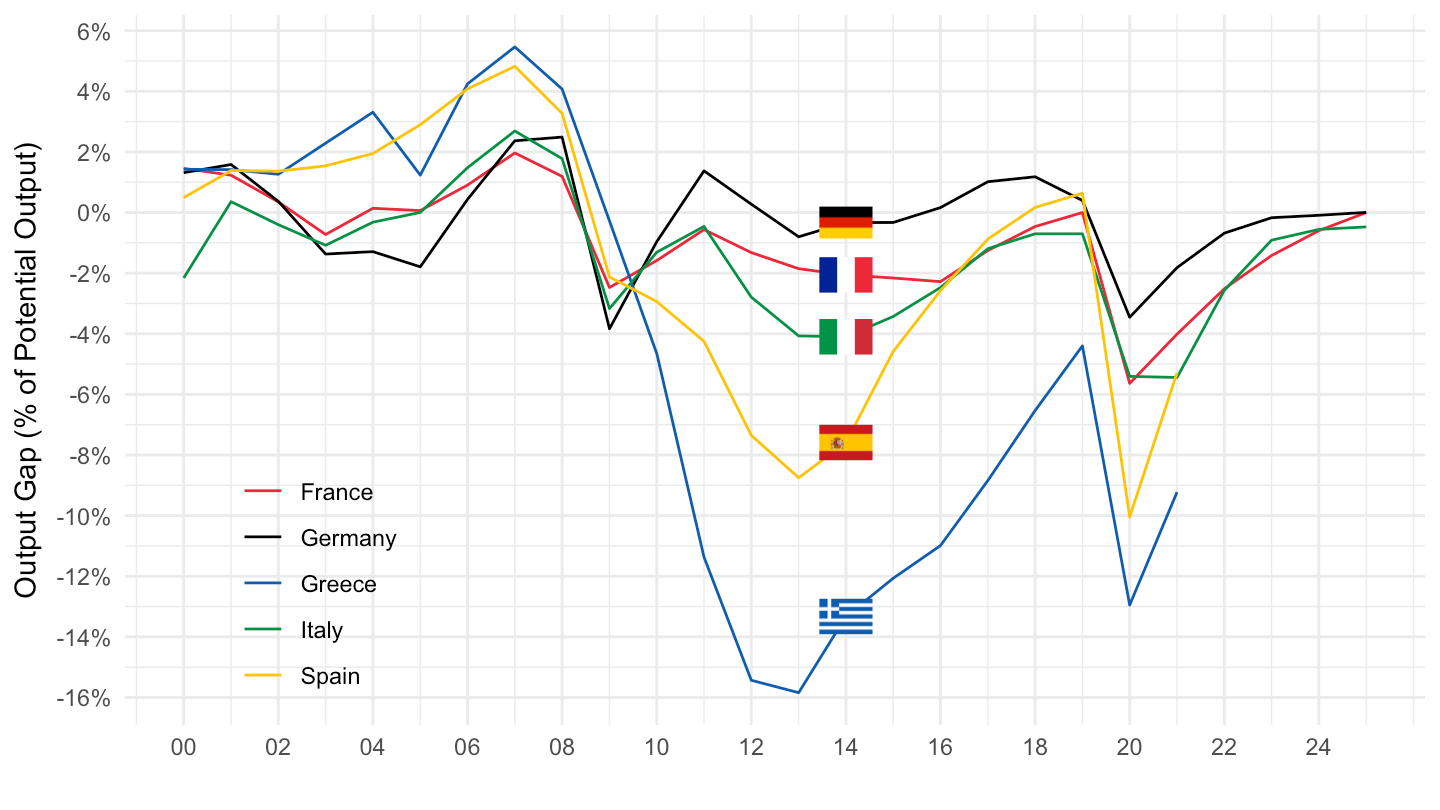
WEO_PUB_OCT2020 %>%
  time_to_date %>%
  left_join(REF_AREA, by = "REF_AREA") %>%
  filter(CONCEPT == "NGAP_NPGDP",
         Ref_area %in% c("Italy", "France", "Greece", "Spain", "Germany"),
         date >= as.Date("2000-01-01")) %>%
  ggplot() +
  geom_line(aes(x = date, y = OBS_VALUE/100, color = Ref_area)) +
  scale_color_manual(values = c("#ED2939", "#000000", "#0D5EAF", "#009246", "#FFC400")) +
  theme_minimal() +
  scale_x_date(breaks = seq(1920, 2100, 2) %>% paste0("-01-01") %>% as.Date,
               labels = date_format("%Y")) +
  geom_image(data = . %>%
               filter(date == as.Date("2014-01-01")) %>%
               mutate(image = paste0("../../icon/flag/", str_to_lower(gsub(" ", "-", Ref_area)), ".png")),
             aes(x = date, y = OBS_VALUE/100, image = image), asp = 1.5) +
  theme(legend.position = "none") +
  scale_y_continuous(breaks = 0.01*seq(-90, 90, 2),
                     labels = percent_format(accuracy = 1)) +
  ylab("Output Gap (% of Potential Output)") + xlab("")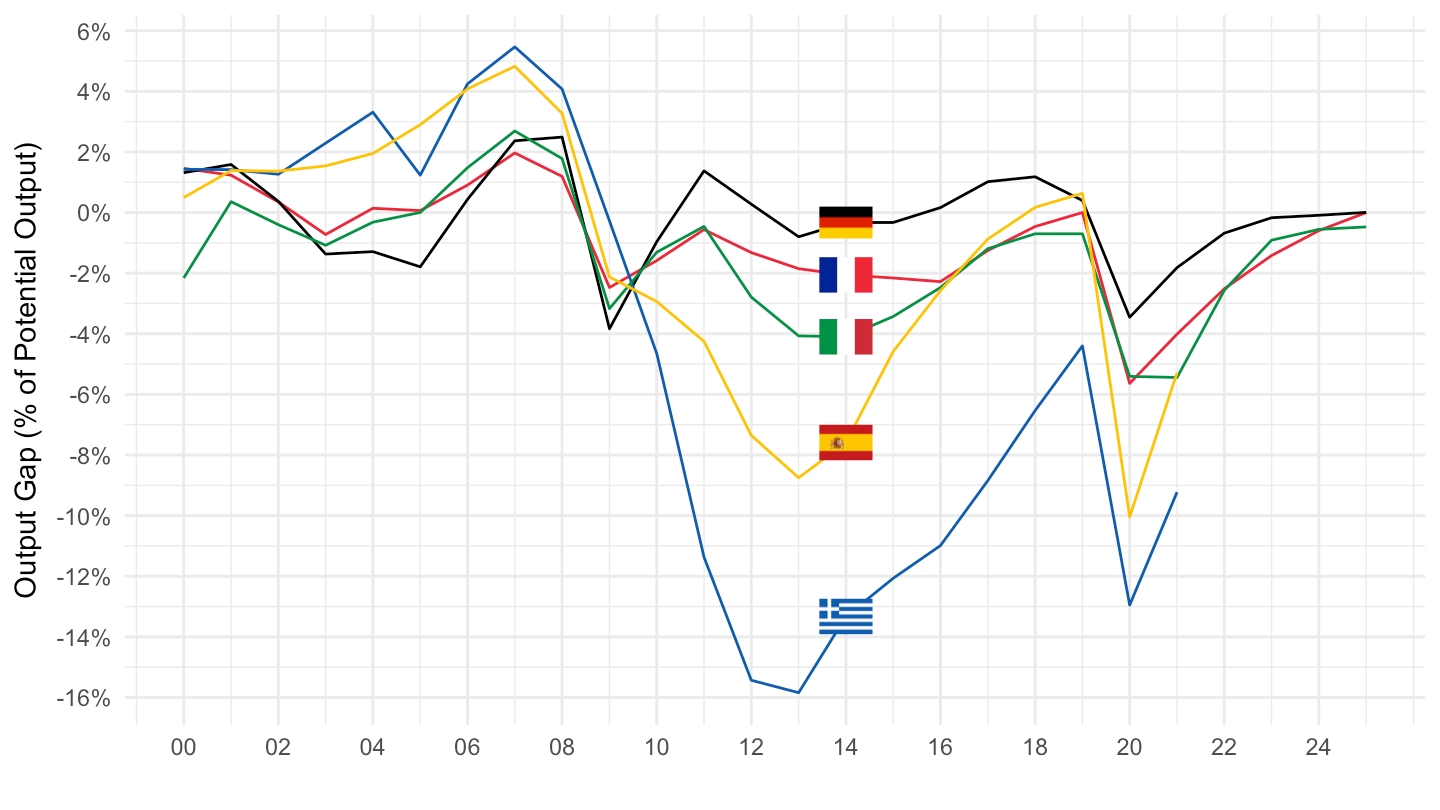
WEO_PUB_OCT2020 %>%
  time_to_date %>%
  left_join(REF_AREA, by = "REF_AREA") %>%
  filter(CONCEPT == "NGAP_NPGDP",
         Ref_area %in% c("Italy", "France", "Greece", "Spain", "Germany"),
         date >= as.Date("2000-01-01"),
         date <= as.Date("2019-01-01")) %>%
  ggplot() +
  geom_line(aes(x = date, y = OBS_VALUE/100, color = Ref_area)) +
  scale_color_manual(values = c("#ED2939", "#000000", "#0D5EAF", "#009246", "#FFC400")) +
  theme_minimal() +
  scale_x_date(breaks = seq(1920, 2100, 2) %>% paste0("-01-01") %>% as.Date,
               labels = date_format("%Y")) +
  geom_image(data = . %>%
               filter(date == as.Date("2014-01-01")) %>%
               mutate(image = paste0("../../icon/flag/", str_to_lower(gsub(" ", "-", Ref_area)), ".png")),
             aes(x = date, y = OBS_VALUE/100, image = image), asp = 1.5) +
  theme(legend.position = "none") +
  scale_y_continuous(breaks = 0.01*seq(-90, 90, 2),
                     labels = percent_format(accuracy = 1)) +
  ylab("Output Gap (% of Potential Output)") + xlab("")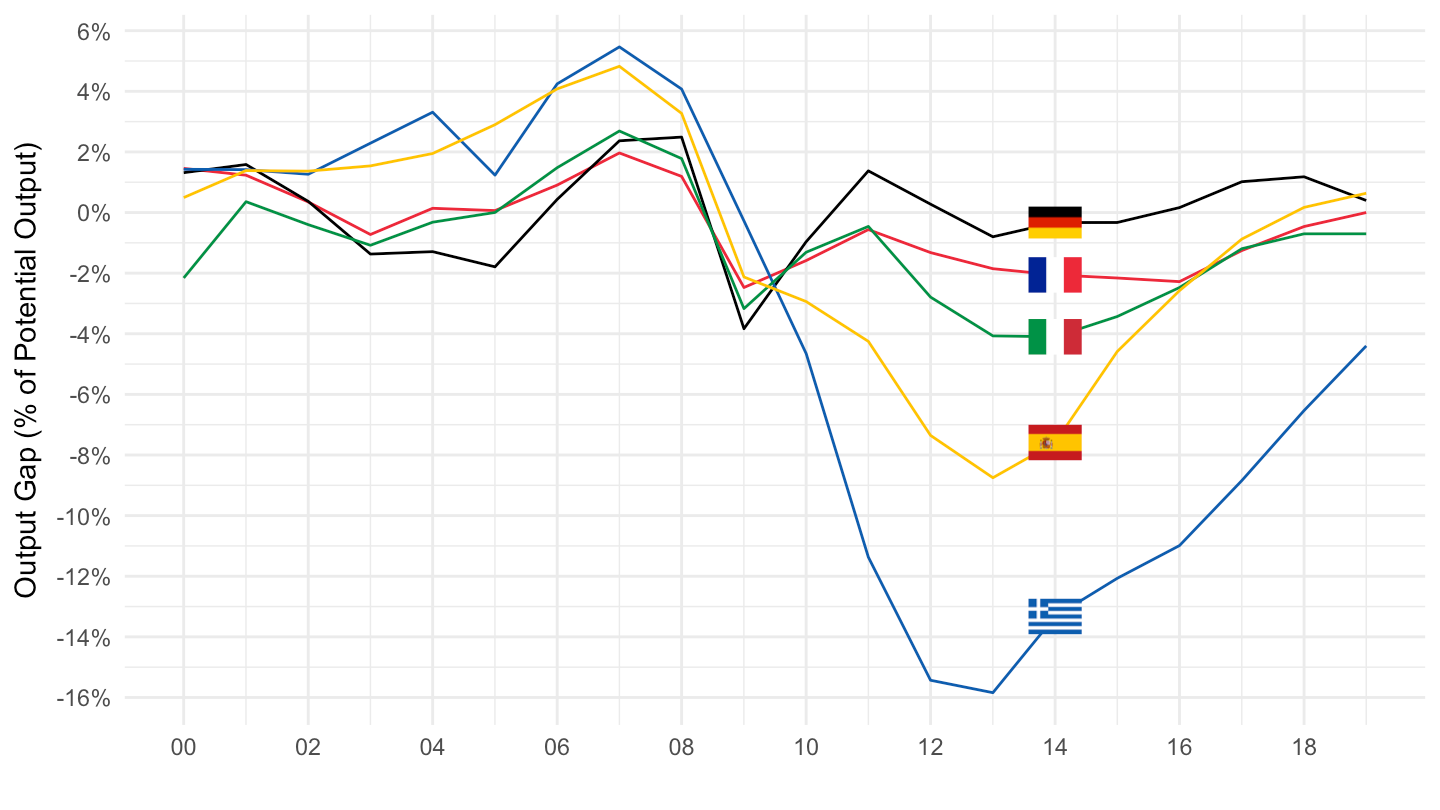
WEO_PUB_OCT2020 %>%
  time_to_date %>%
  left_join(REF_AREA, by = "REF_AREA") %>%
  filter(CONCEPT == "NGAP_NPGDP",
         Ref_area %in% c("Italy", "France", "Greece", "Spain", "Germany"),
         date >= as.Date("2000-01-01")) %>%
  ggplot() +
  geom_line(aes(x = date, y = OBS_VALUE/100, color = Ref_area)) +
  scale_color_manual(values = c("#ED2939", "#000000", "#0D5EAF", "#009246", "#FFC400")) +
  theme_minimal() +
  scale_x_date(breaks = seq(1920, 2100, 2) %>% paste0("-01-01") %>% as.Date,
               labels = date_format("%Y")) +
  geom_image(data = . %>%
               filter(date == as.Date("2014-01-01")) %>%
               mutate(image = paste0("../../icon/flag/", str_to_lower(gsub(" ", "-", Ref_area)), ".png")),
             aes(x = date, y = OBS_VALUE/100, image = image), asp = 1.5) +
  theme(legend.position = "none") +
  scale_y_continuous(breaks = 0.01*seq(-90, 90, 2),
                     labels = percent_format(accuracy = 1)) +
  ylab("Ecarts de Production (% de PIB Potentiel)") + xlab("")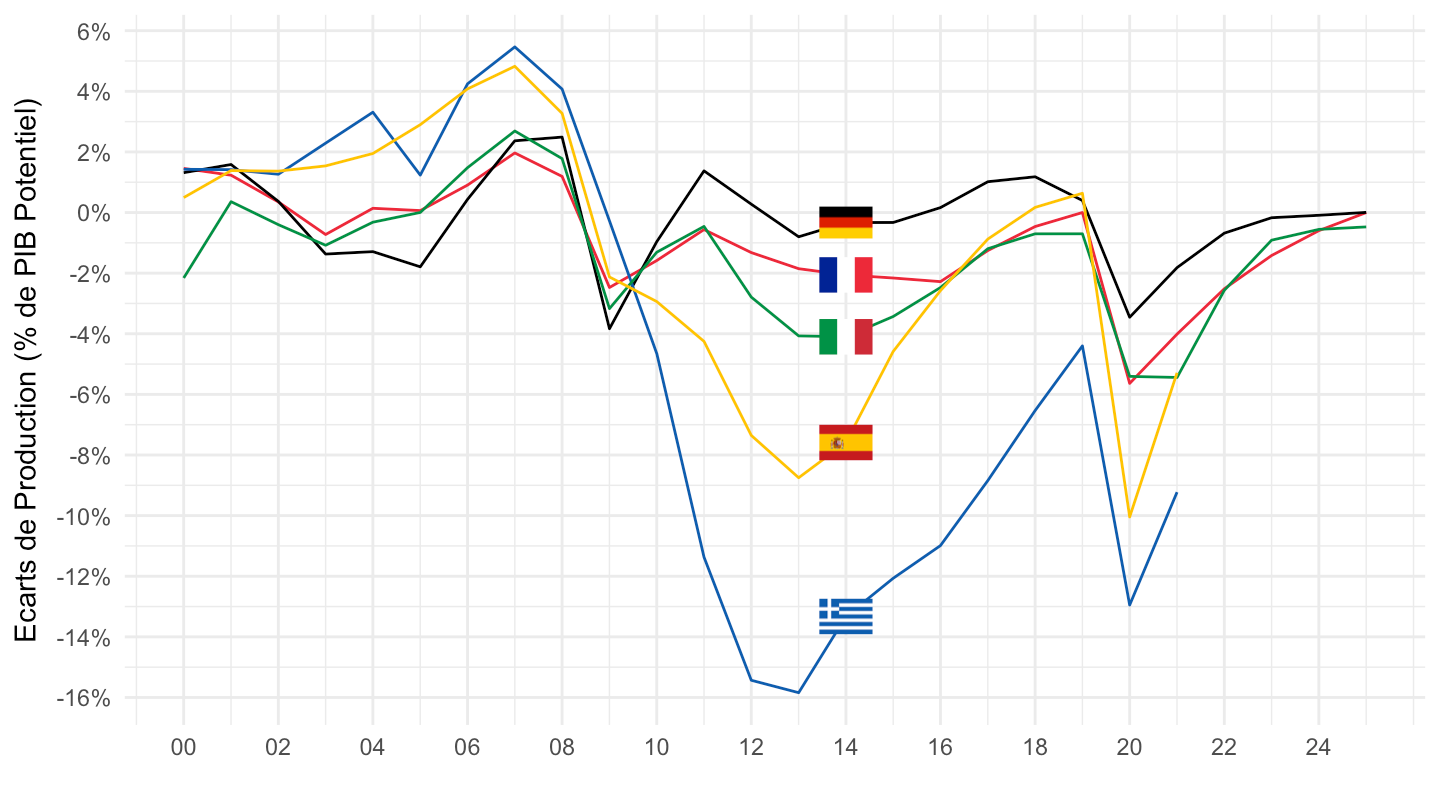
WEO %>%
  filter(date == "2018-01-01",
         iso3c %in% c("USA", "FRA", "DEU", "ITA")) %>%
  left_join(CL_SUBJECT_WEO, by = "SUBJECT") %>%
  select(SUBJECT, Subject, iso3c, value) %>%
  spread(iso3c, value) %>%
{if (is_html_output()) datatable(., filter = 'top', rownames = F) else .}WEO %>%
group_by(date) %>%
summarise(Nobs = n()) %>%
{if (is_html_output()) datatable(., filter = 'top', rownames = F) else .}WEO_PUB_OCT2020 %>%
group_by(TIME_PERIOD) %>%
summarise(Nobs = n()) %>%
arrange(-Nobs) %>%
{if (is_html_output()) datatable(., filter = 'top', rownames = F) else .}WEO %>%
left_join(CL_AREA_WEO, by = "iso2c") %>%
filter(SUBJECT == "NGDP_RPCH",
Iso2c %in% c("Italy", "France", "Greece", "Spain", "Germany"),
date >= as.Date("1990-01-01"),
date <= as.Date("2019-01-01")) %>%
ggplot() +
geom_line(aes(x = date, y = value/100, color = Iso2c)) +
theme_minimal() +
scale_x_date(breaks = seq(1920, 2100, 2) %>% paste0("-01-01") %>% as.Date,
labels = date_format("%Y")) +
theme(legend.position = c(0.15, 0.2),
legend.title = element_blank()) +
scale_y_continuous(breaks = 0.01*seq(-90, 90, 2),
labels = percent_format(accuracy = 1)) +
ylab("Real Growth Rate") + xlab("")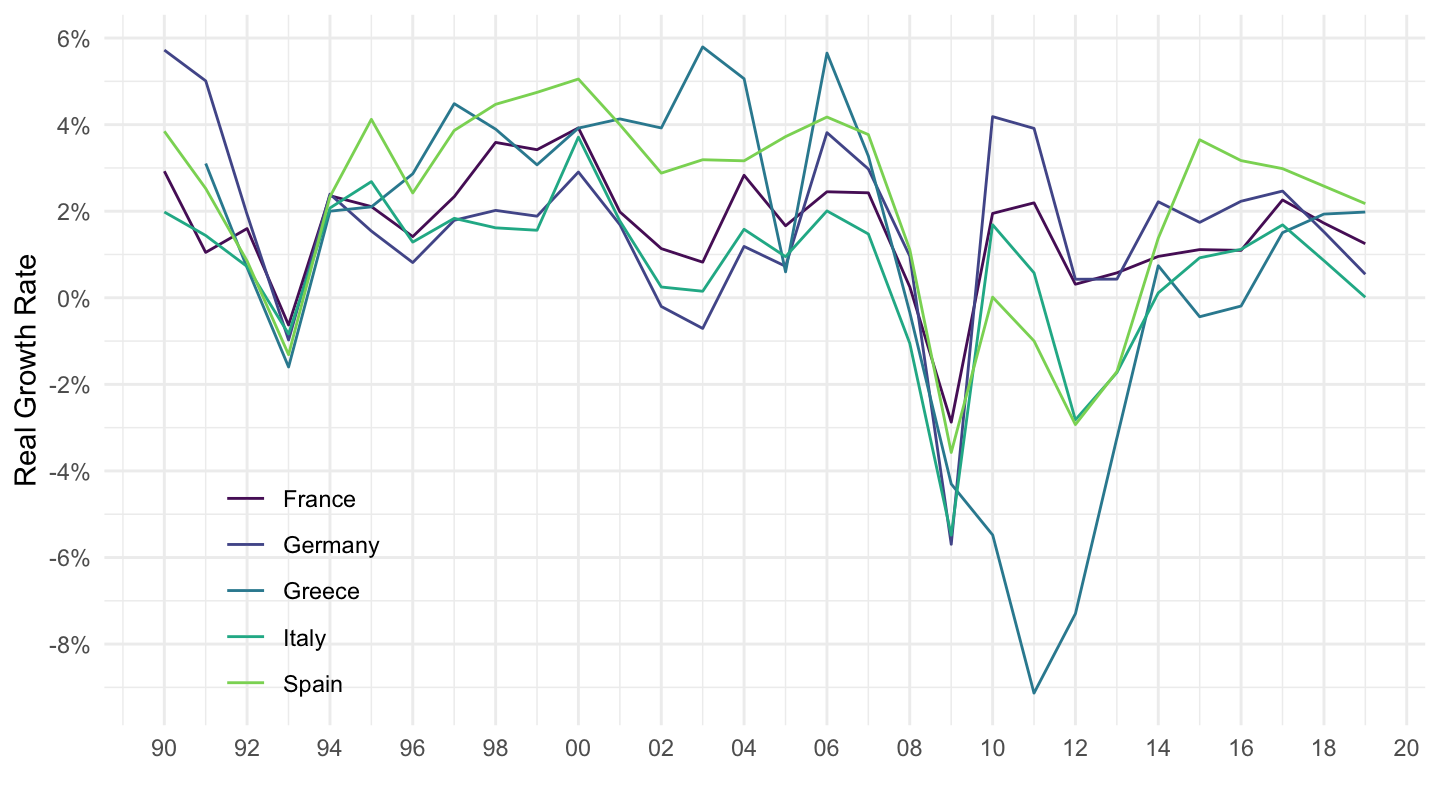
WEO_PUB_OCT2020 %>%
  left_join(REF_AREA, by = "REF_AREA") %>%
  time_to_date %>%
  filter(CONCEPT == "NGDP_RPCH",
         Ref_area %in% c("Italy", "France", "Greece", "Spain", "Germany"),
         date >= as.Date("1990-01-01")) %>%
  ggplot() +
  geom_line(aes(x = date, y = OBS_VALUE/100, color = Ref_area, linetype = Ref_area)) +

  theme_minimal() +
  scale_x_date(breaks = seq(1920, 2100, 2) %>% paste0("-01-01") %>% as.Date,
               labels = date_format("%Y")) +
  theme(legend.position = c(0.15, 0.2),
        legend.title = element_blank()) +
  scale_y_continuous(breaks = 0.01*seq(-90, 90, 2),
                     labels = percent_format(accuracy = 1)) +
  ylab("Real Growth Rate") + xlab("")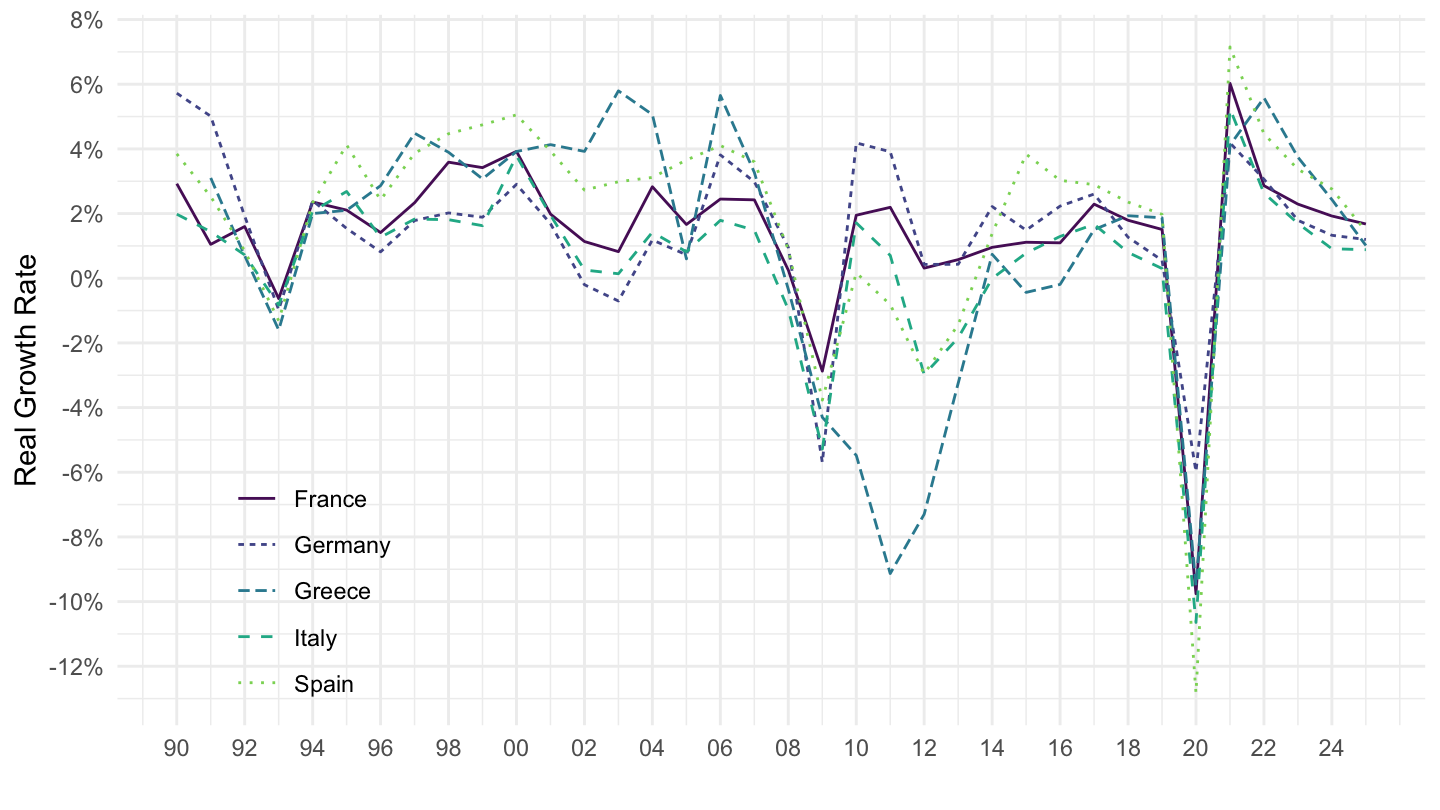
WEO %>%
  left_join(CL_AREA_WEO, by = "iso2c") %>%
  filter(SUBJECT == "NGDP_RPCH",
         Iso2c %in% c("Argentina", "Chile", "Brazil"),
         date >= as.Date("1990-01-01"),
         date <= as.Date("2019-01-01")) %>%
  ggplot() +
  geom_line(aes(x = date, y = value/100, color = Iso2c)) +
  scale_color_manual(values = viridis(4)[1:3]) +
  theme_minimal() +
  scale_x_date(breaks = seq(1920, 2100, 2) %>% paste0("-01-01") %>% as.Date,
               labels = date_format("%Y")) +
  theme(legend.position = c(0.15, 0.2),
        legend.title = element_blank()) +
  scale_y_continuous(breaks = 0.01*seq(-90, 90, 2),
                     labels = percent_format(accuracy = 1)) +
  ylab("Real Growth Rate (%)") + xlab("")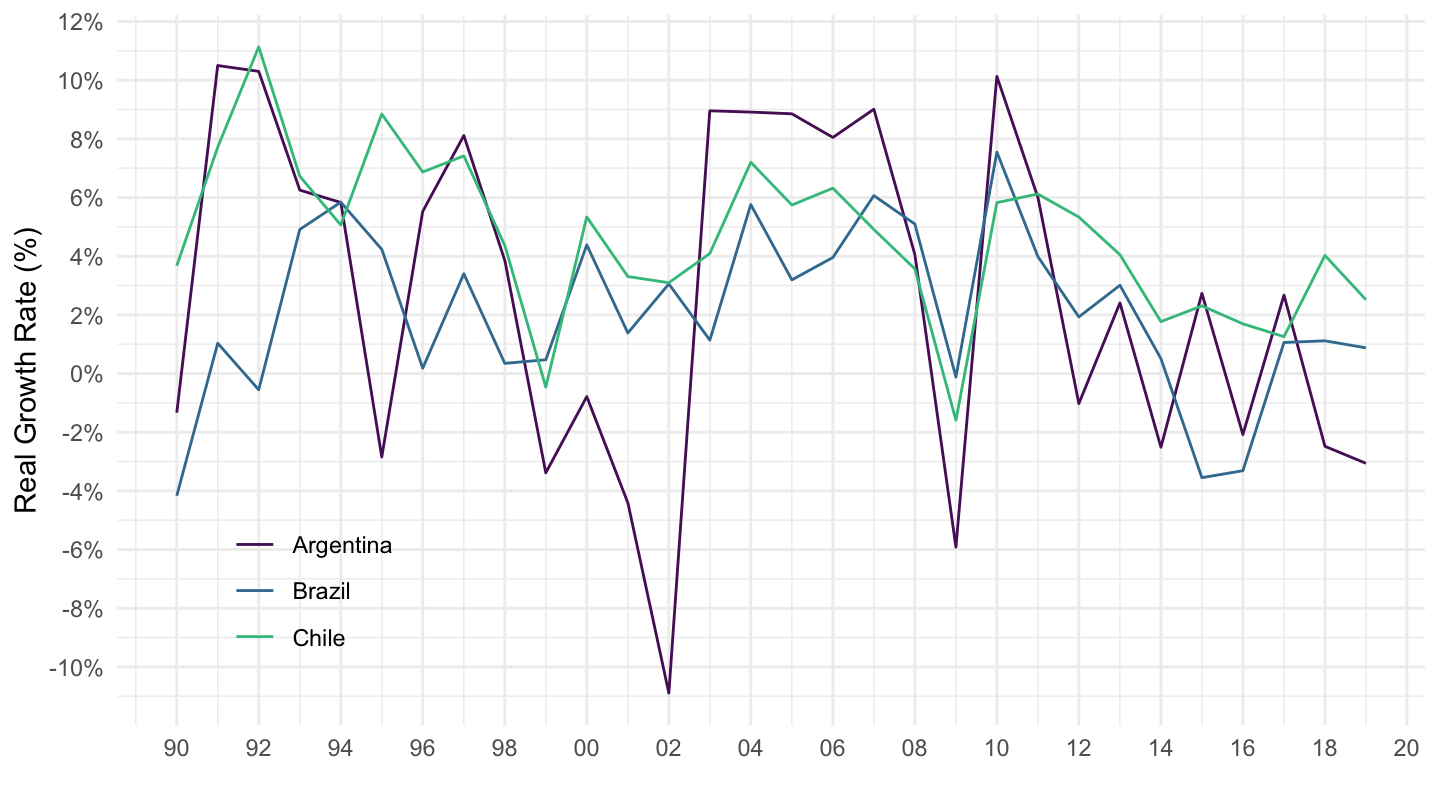
For Ex, inflation variable == "PCPIPCH" in Venezuela country == "VE" can be obtained using the following command:
WEO %>%
  filter(SUBJECT == "PCPIPCH",
         iso2c == "VE") %>%
  select(date, value) %>%
  filter(year(date) >= 1990) %>%
{if (is_html_output()) print_table(.) else .}| date | value |
|---|---|
| 1990-01-01 | 40.656 |
| 1991-01-01 | 34.205 |
| 1992-01-01 | 31.423 |
| 1993-01-01 | 38.122 |
| 1994-01-01 | 60.817 |
| 1995-01-01 | 59.923 |
| 1996-01-01 | 99.876 |
| 1997-01-01 | 50.040 |
| 1998-01-01 | 35.782 |
| 1999-01-01 | 23.570 |
| 2000-01-01 | 16.206 |
| 2001-01-01 | 12.531 |
| 2002-01-01 | 22.434 |
| 2003-01-01 | 31.091 |
| 2004-01-01 | 21.747 |
| 2005-01-01 | 15.955 |
| 2006-01-01 | 13.663 |
| 2007-01-01 | 18.699 |
| 2008-01-01 | 31.441 |
| 2009-01-01 | 26.041 |
| 2010-01-01 | 28.187 |
| 2011-01-01 | 26.090 |
| 2012-01-01 | 21.069 |
| 2013-01-01 | 40.639 |
| 2014-01-01 | 62.169 |
| 2015-01-01 | 121.738 |
| 2016-01-01 | 254.949 |
| 2017-01-01 | 438.117 |
| 2018-01-01 | 65374.082 |
| 2019-01-01 | 200000.000 |
| 2020-01-01 | 500000.000 |
| 2021-01-01 | 500000.000 |
WEO %>%
  filter(SUBJECT == "PCPIPCH",
         iso2c == "AR") %>%
  select(date, value) %>%
  filter(year(date) >= 1990) %>%
{if (is_html_output()) print_table(.) else .}| date | value |
|---|---|
| 1998-01-01 | 0.925 |
| 1999-01-01 | -1.167 |
| 2000-01-01 | -0.939 |
| 2001-01-01 | -1.065 |
| 2002-01-01 | 25.869 |
| 2003-01-01 | 13.443 |
| 2004-01-01 | 4.416 |
| 2005-01-01 | 9.642 |
| 2006-01-01 | 10.898 |
| 2007-01-01 | 8.830 |
| 2008-01-01 | 8.585 |
| 2009-01-01 | 6.270 |
| 2010-01-01 | 10.461 |
| 2011-01-01 | 9.775 |
| 2012-01-01 | 10.043 |
| 2013-01-01 | 10.619 |
| 2017-01-01 | 25.675 |
| 2018-01-01 | 34.277 |
| 2019-01-01 | 54.440 |
| 2020-01-01 | 50.997 |
| 2021-01-01 | 32.260 |
| 2022-01-01 | 26.869 |
| 2023-01-01 | 22.213 |
| 2024-01-01 | 16.977 |
WEO %>%
  left_join(CL_AREA_WEO, by = "iso2c") %>%
  filter(SUBJECT == "LUR",
         Iso2c %in% c("Argentina", "Chile", "Venezuela")) %>%
  ggplot() +
  geom_line(aes(x = date, y = value/100, color = Iso2c)) +
  scale_color_manual(values = viridis(4)[1:3]) +
  theme_minimal() +
  scale_x_date(breaks = seq(1920, 2100, 2) %>% paste0("-01-01") %>% as.Date,
               labels = date_format("%Y")) +
  theme(legend.position = c(0.15, 0.9),
        legend.title = element_blank()) +
  scale_y_continuous(breaks = 0.01*seq(-90, 90, 2),
                     labels = percent_format(accuracy = 1)) +
  ylab("Unemployment (%)") + xlab("")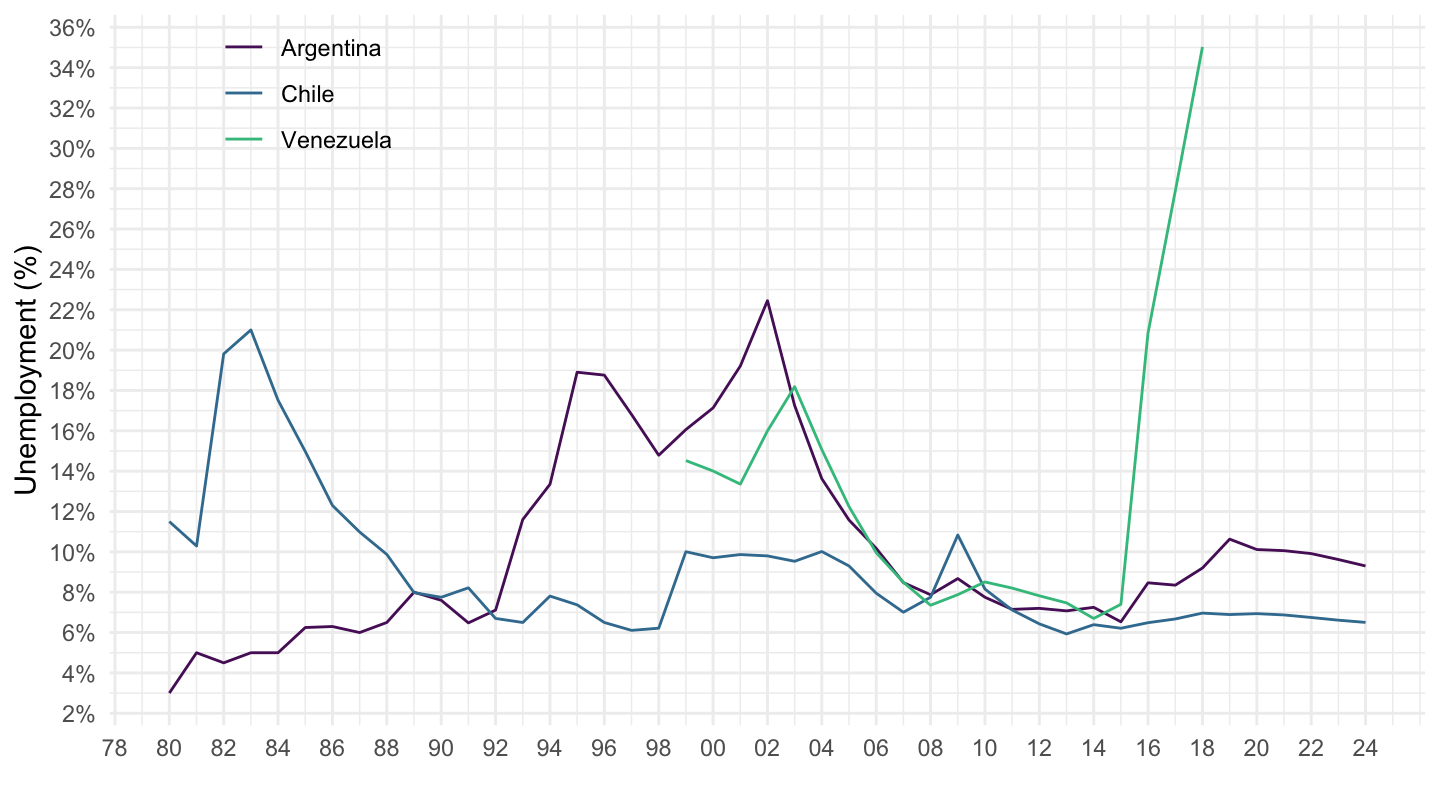
WEO %>%
  filter(SUBJECT == "BCA",
         date == as.Date("2018-01-01"),
         value > 0) %>%
  left_join(CL_AREA_WEO, by = "iso2c") %>%
  arrange(-value) %>%
  mutate(value = round(value)) %>%
  select(Iso2c, `Current Account Balance (Billions)` = value) %>%
  mutate(Flag = gsub(" ", "-", str_to_lower(gsub(" ", "-", Iso2c))),
         Flag = paste0('<img src="../../icon/flag/vsmall/', Flag, '.png" alt="Flag">')) %>%
  select(Flag, everything()) %>%
{if (is_html_output()) datatable(., filter = 'top', rownames = F, escape = F) else .}WEO %>%
filter(SUBJECT == "BCA_NGDPD",
date == as.Date("2018-01-01")) %>%
left_join(CL_AREA_WEO, by = "iso2c") %>%
right_join(eurozone_squeezed, by = "iso2c") %>%
ggplot(., aes(x = long, y = lat, group = group, fill = value/100)) +
geom_polygon() + coord_map() +
scale_fill_viridis_c(na.value = "white",
labels = scales::percent_format(accuracy = 1, suffix = "% of GDP"),
breaks = c(-0.06,-0.02, 0, 0.02, 0.04, 0.06, 0.08),
values = c(0, 0, 0.2, 0.4, 0.6, 0.8, 1)) +
theme_void() + theme(legend.position = c(0.25, 0.85)) +
labs(fill = "2018 Current Account")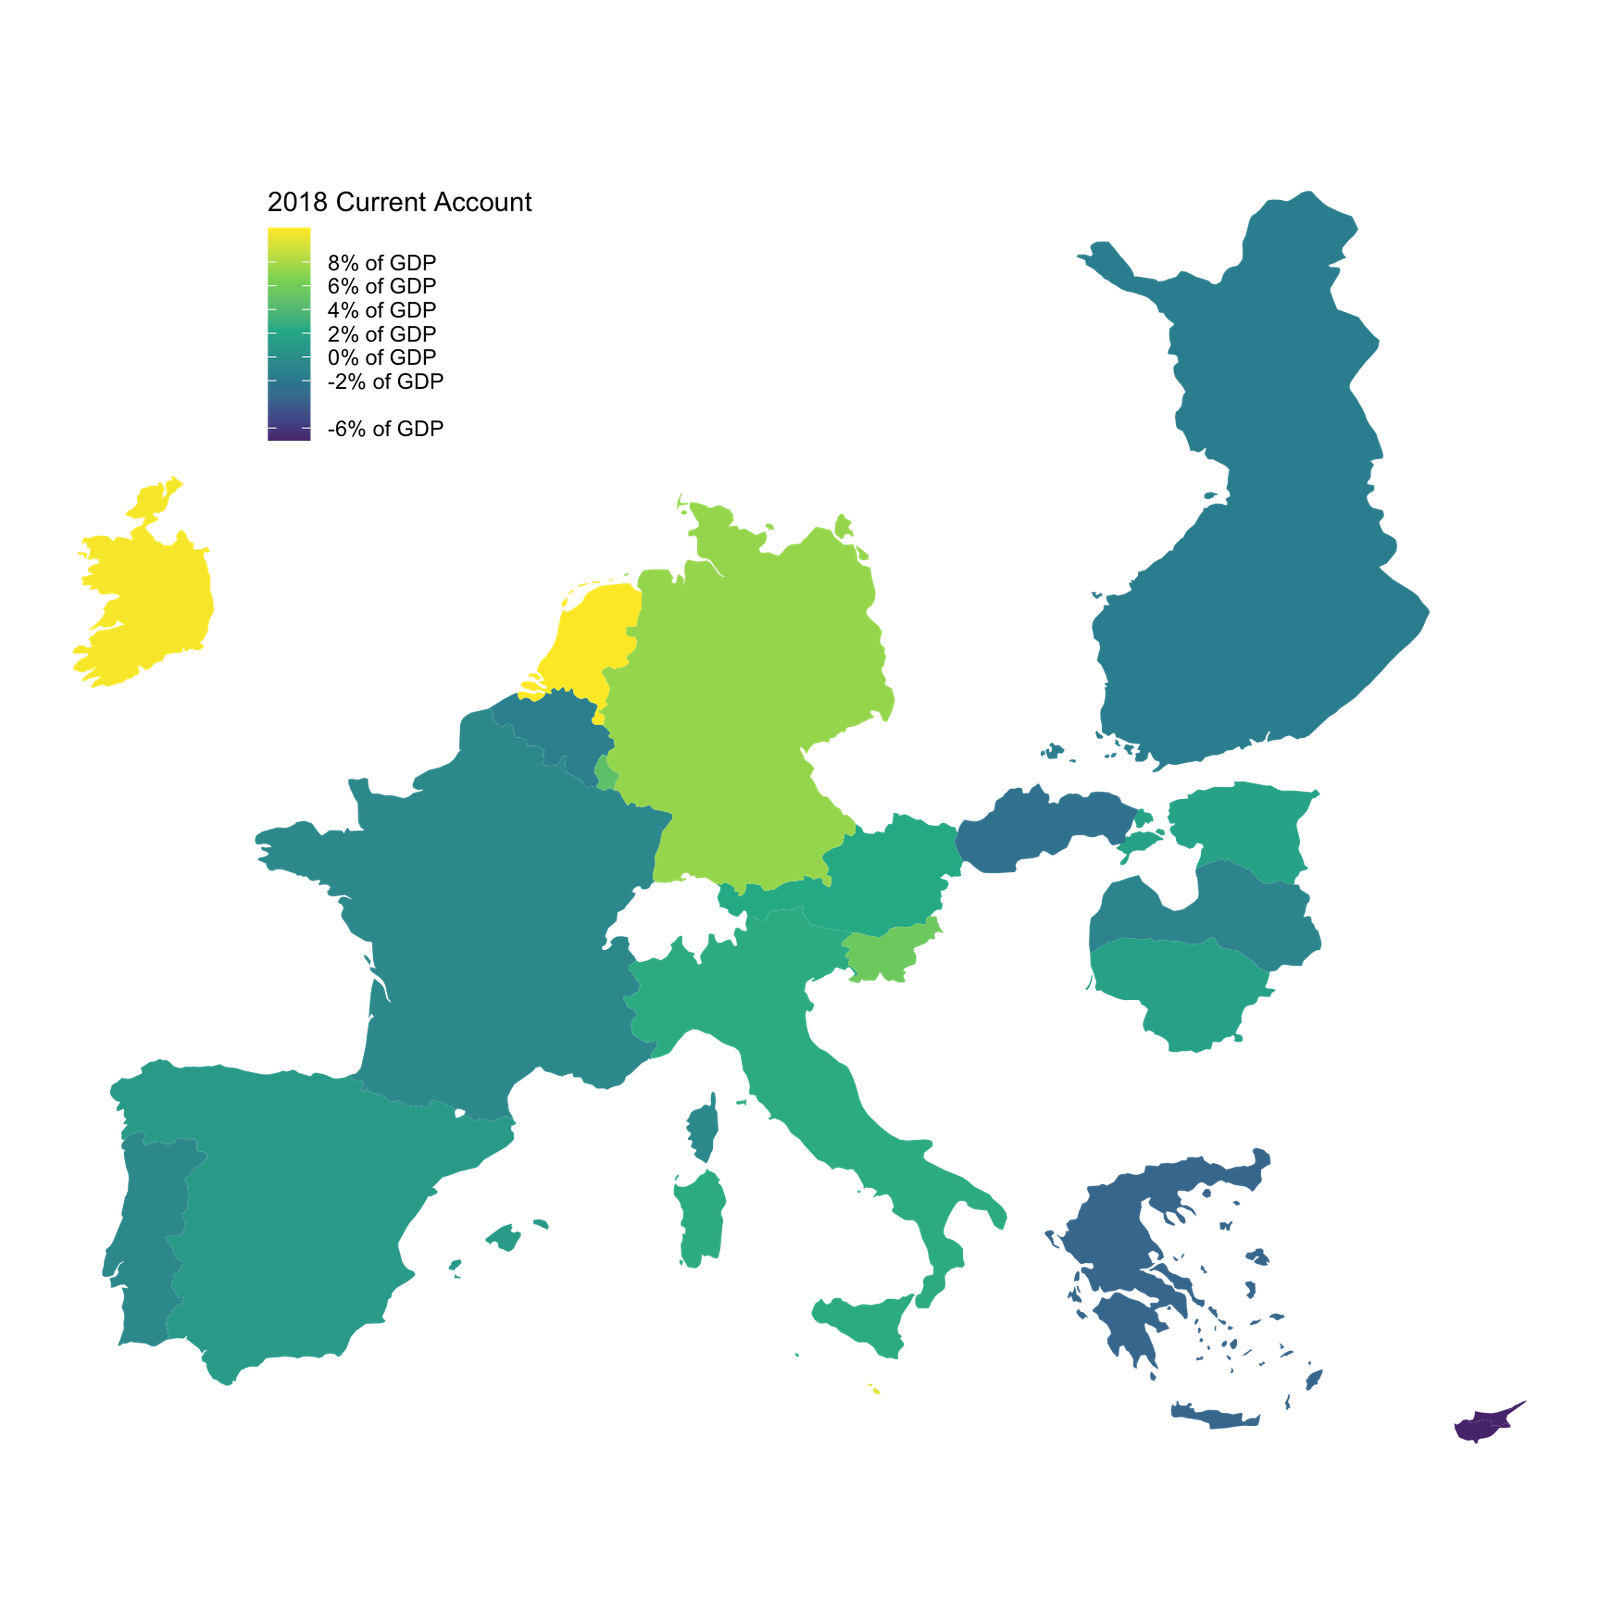
WEO %>%
  filter(SUBJECT == "BCA_NGDPD",
         date == as.Date("2018-01-01")) %>%
  right_join(world, by = "iso2c") %>%
  ggplot() + theme_void() +
  geom_polygon(aes(long, lat, group = group, fill = value/100),
               colour = alpha("black", 1/2), size = 0.1)  +
  scale_fill_viridis_c(name = "Current Account (%)",
                       labels = scales::percent_format(accuracy = 1),
                       breaks = c(-0.16,-0.12,-0.08,-0.04, 0, 0.04, 0.08, 0.12, 0.16),
                       values = c(0, 0.1, 0.2, 0.3, 0.4, 0.5, 0.6, 0.7, 0.8, 1)) +
  theme(legend.position = c(0.1, 0.4),
        legend.title = element_text(size = 10))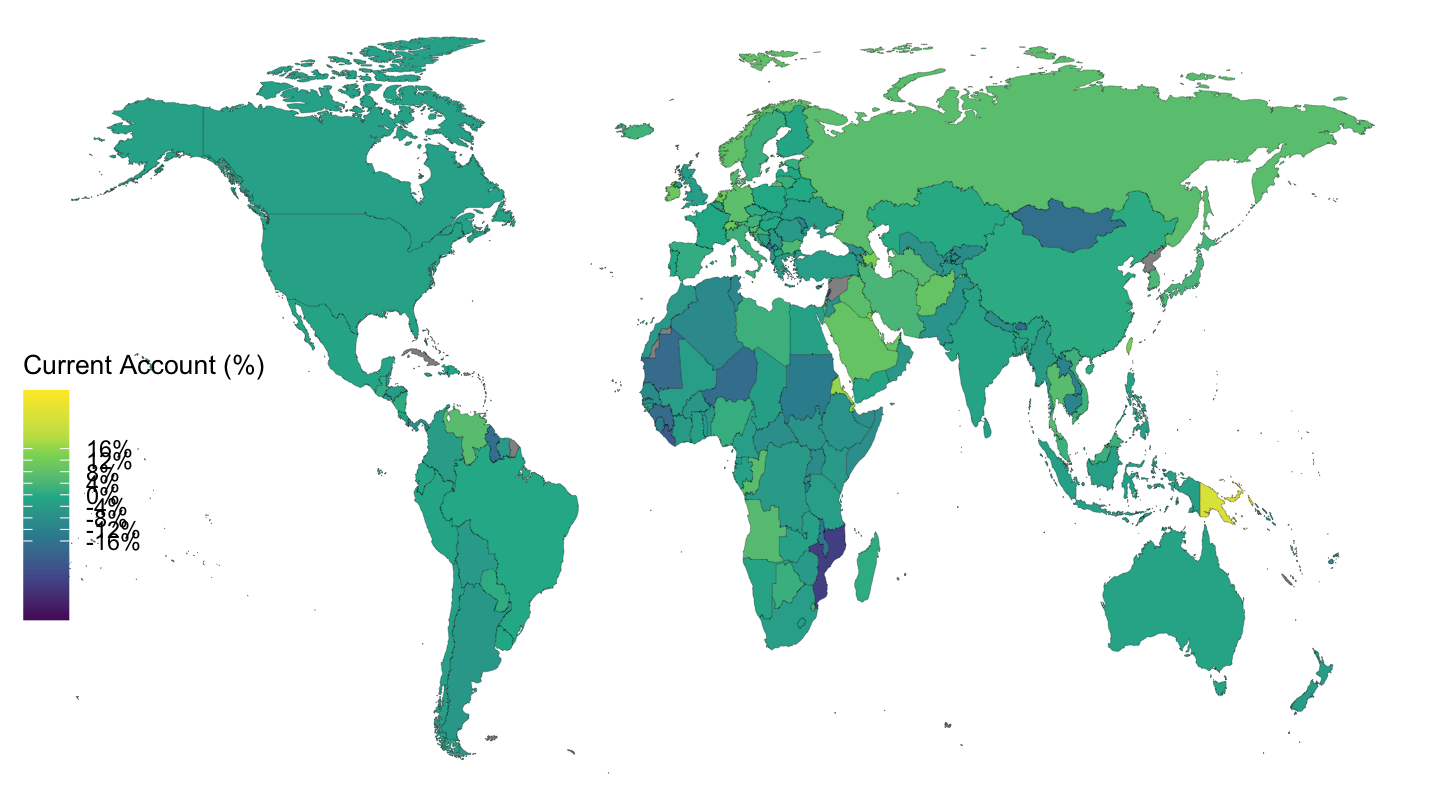
WEO %>%
  filter(SUBJECT == "BCA_NGDPD",
         date == as.Date("2008-01-01")) %>%
  right_join(eurozone_squeezed, by = "iso2c") %>%
  ggplot(., aes(x = long, y = lat, group = group, fill = value/100)) +
  geom_polygon() + coord_map() +
  scale_fill_viridis_c(na.value = "white",
                       labels = scales::percent_format(accuracy = 1, suffix = "% of GDP"),
                       breaks = c(-0.16,-0.12,-0.08,-0.04, 0, 0.04, 0.08, 0.12, 0.16),
                       values = c(0, 0.1, 0.2, 0.3, 0.4, 0.5, 0.6, 0.7, 0.8, 1)) +
  theme_void() + theme(legend.position = c(0.25, 0.85)) +
  labs(fill = "2008 Current Account")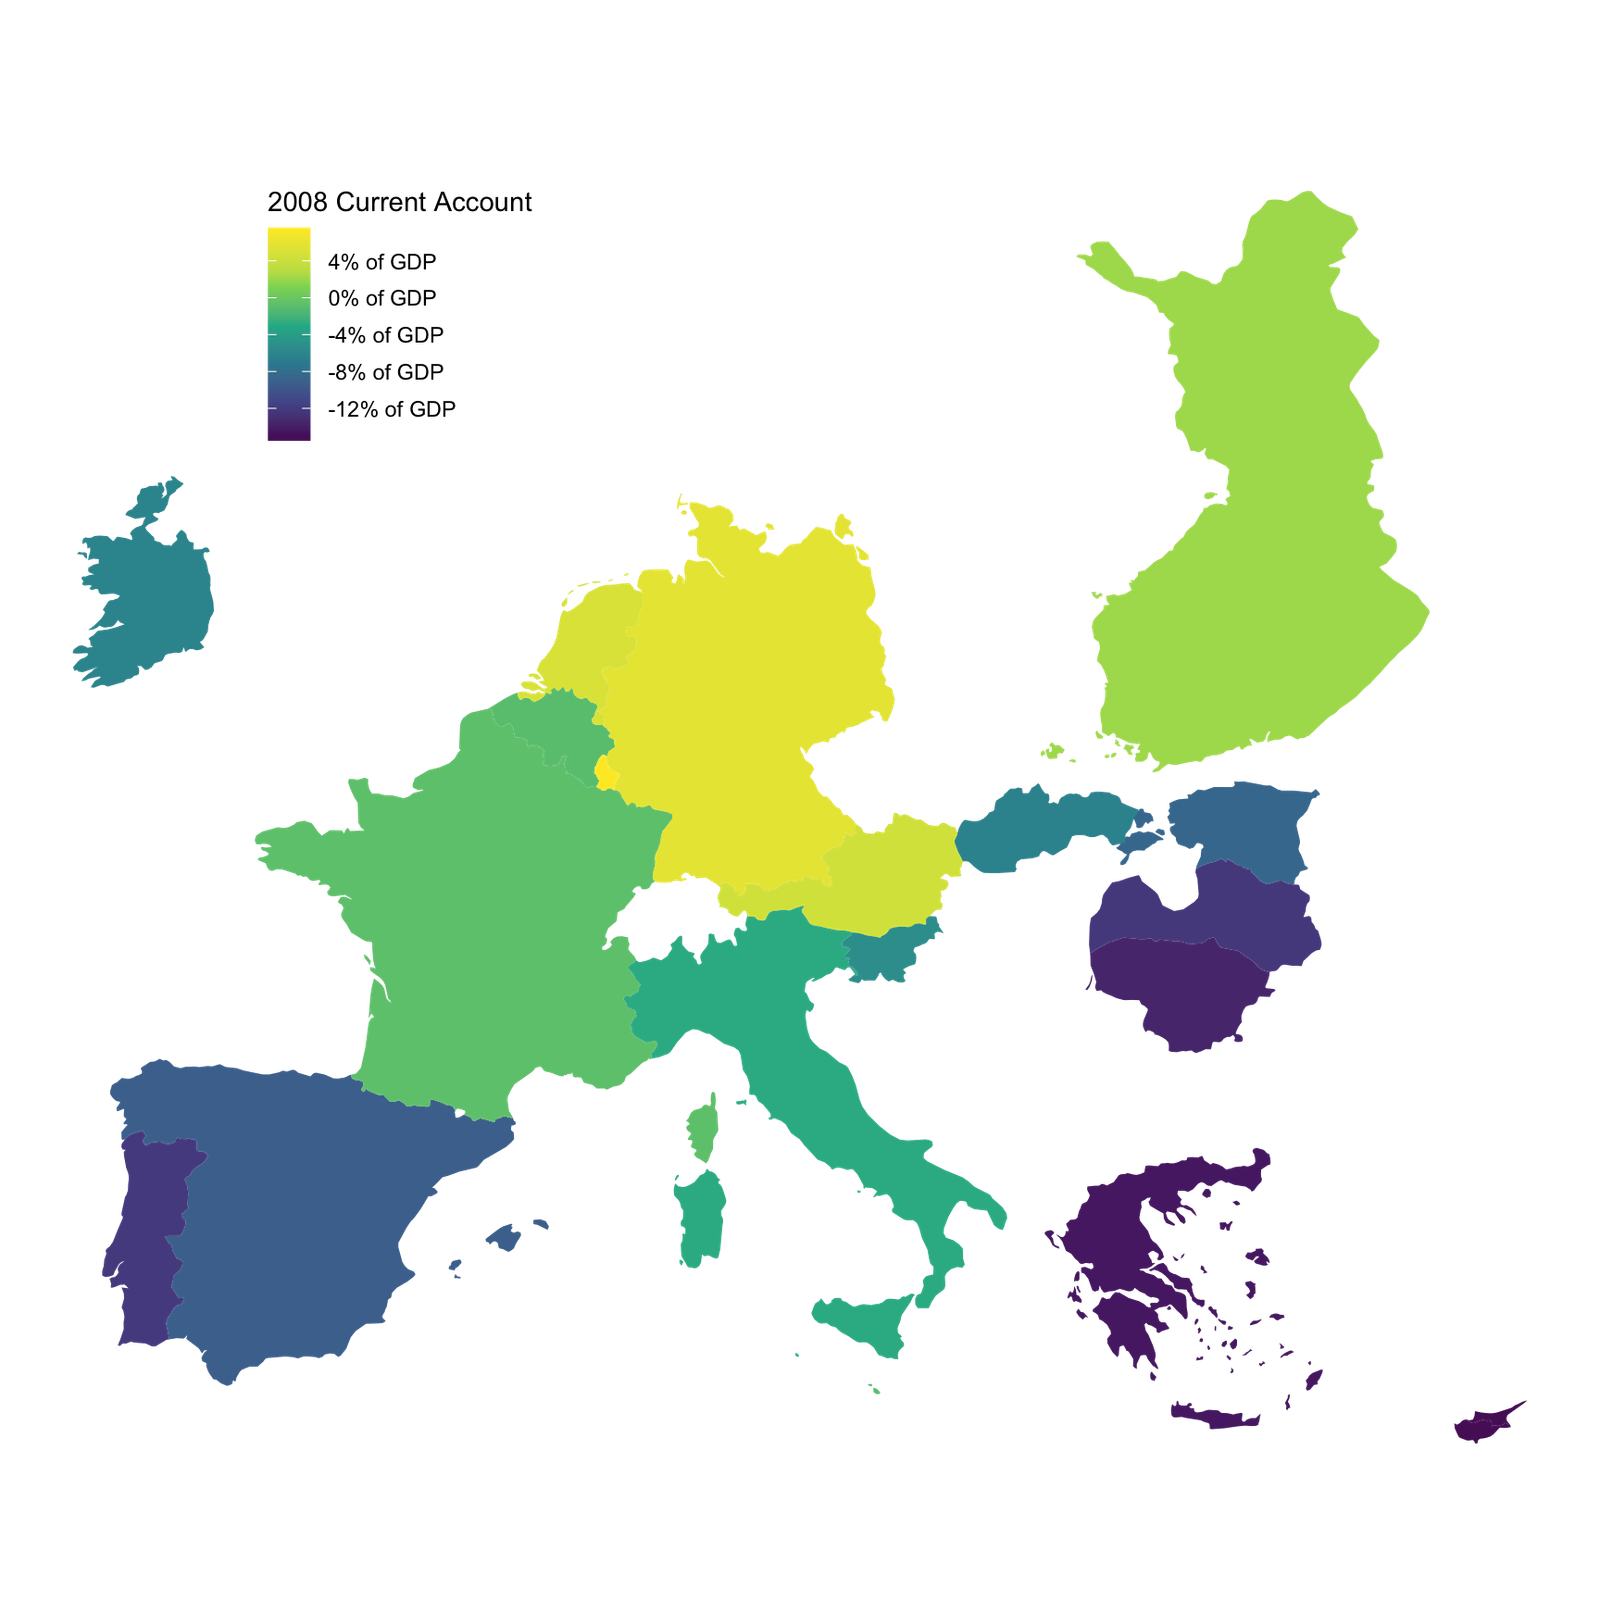
WEO %>%
  left_join(CL_AREA_WEO, by = "iso2c") %>%
  filter(SUBJECT == "BCA_NGDPD",
         Iso2c %in% c("Italy", "France", "Greece", "Spain", "Germany"),
         date >= as.Date("2000-01-01")) %>%
  ggplot() +
  geom_line(aes(x = date, y = value/100, color = Iso2c)) +

  theme_minimal() +
  scale_x_date(breaks = seq(1920, 2100, 2) %>% paste0("-01-01") %>% as.Date,
               labels = date_format("%Y")) +
  theme(legend.position = c(0.75, 0.2),
        legend.title = element_blank()) +
  scale_y_continuous(breaks = 0.01*seq(-90, 90, 2),
                     labels = percent_format(accuracy = 1)) +
  ylab("Current Account Balance (% of GDP)") + xlab("")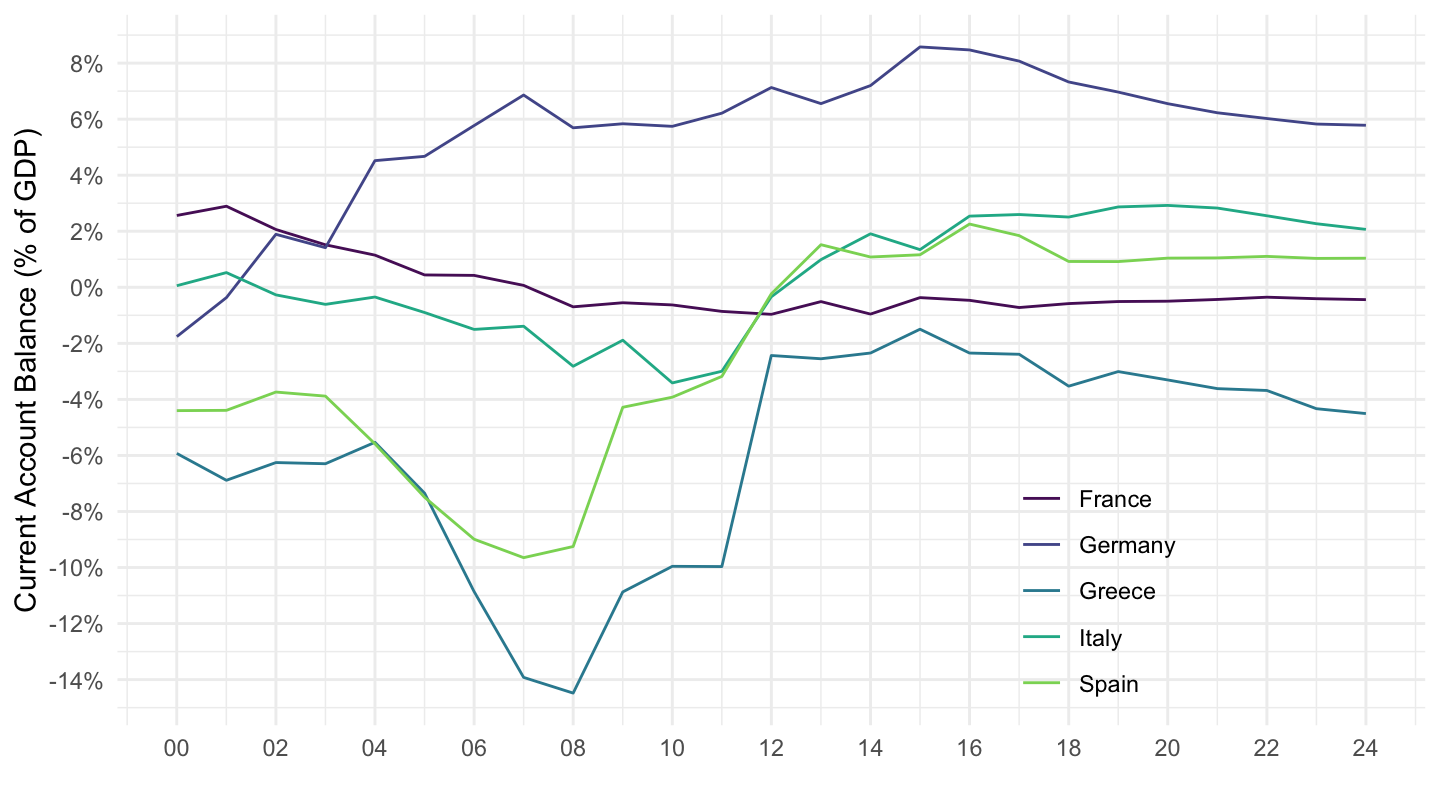
WEO %>%
  left_join(CL_AREA_WEO, by = "iso2c") %>%
  filter(SUBJECT == "BCA_NGDPD",
         Iso2c %in% c("Argentina", "Venezuela", "Chile")) %>%
  ggplot() +
  geom_line(aes(x = date, y = value/100, color = Iso2c)) +
  scale_color_manual(values = viridis(4)[1:3]) +
  theme_minimal() +
  scale_x_date(breaks = seq(1920, 2100, 2) %>% paste0("-01-01") %>% as.Date,
               labels = date_format("%Y")) +
  theme(legend.position = c(0.75, 0.2),
        legend.title = element_blank()) +
  scale_y_continuous(breaks = 0.01*seq(-90, 90, 2),
                     labels = percent_format(accuracy = 1)) +
  ylab("Current Account Balance (% of GDP)") + xlab("")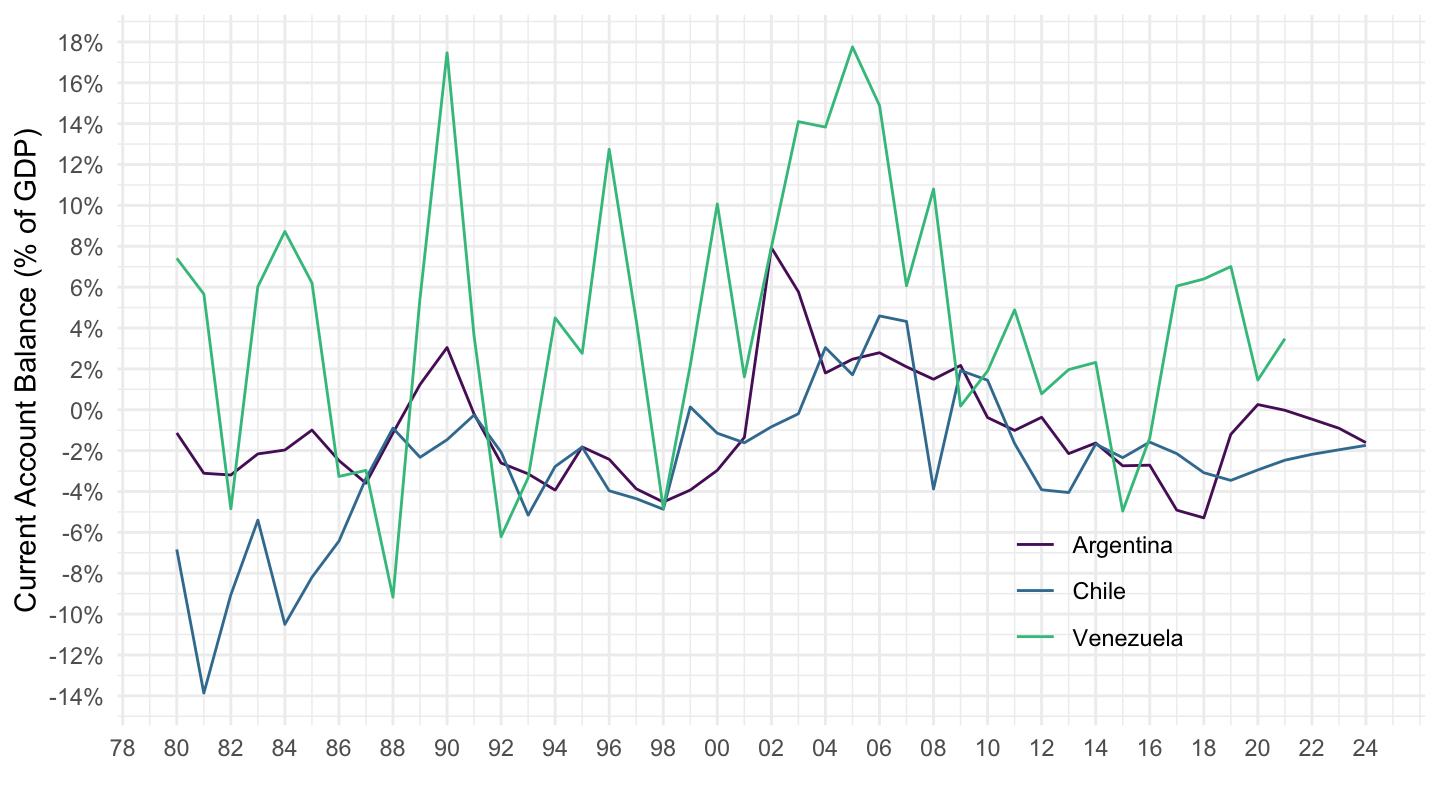
WEO %>%
  left_join(CL_AREA_WEO, by = "iso2c") %>%
  filter(SUBJECT == "BCA_NGDPD",
         Iso2c %in% c("Italy", "France", "Germany"),
         date >= as.Date("1985-01-01"),
         date <= as.Date("2019-01-01")) %>%
  ggplot() +
  geom_line(aes(x = date, y = value/100, color = Iso2c)) +
  scale_color_manual(values = c("#002395", "#000000", "#009246")) +
  theme_minimal() +
  scale_x_date(breaks = seq(1920, 2100, 2) %>% paste0("-01-01") %>% as.Date,
               labels = date_format("%Y")) +
  theme(legend.position = c(0.3, 0.9),
        legend.title = element_blank()) +
  scale_y_continuous(breaks = 0.01*seq(-90, 90, 2),
                     labels = percent_format(accuracy = 1)) +
  ylab("Current Account Balance (% of GDP)") + xlab("")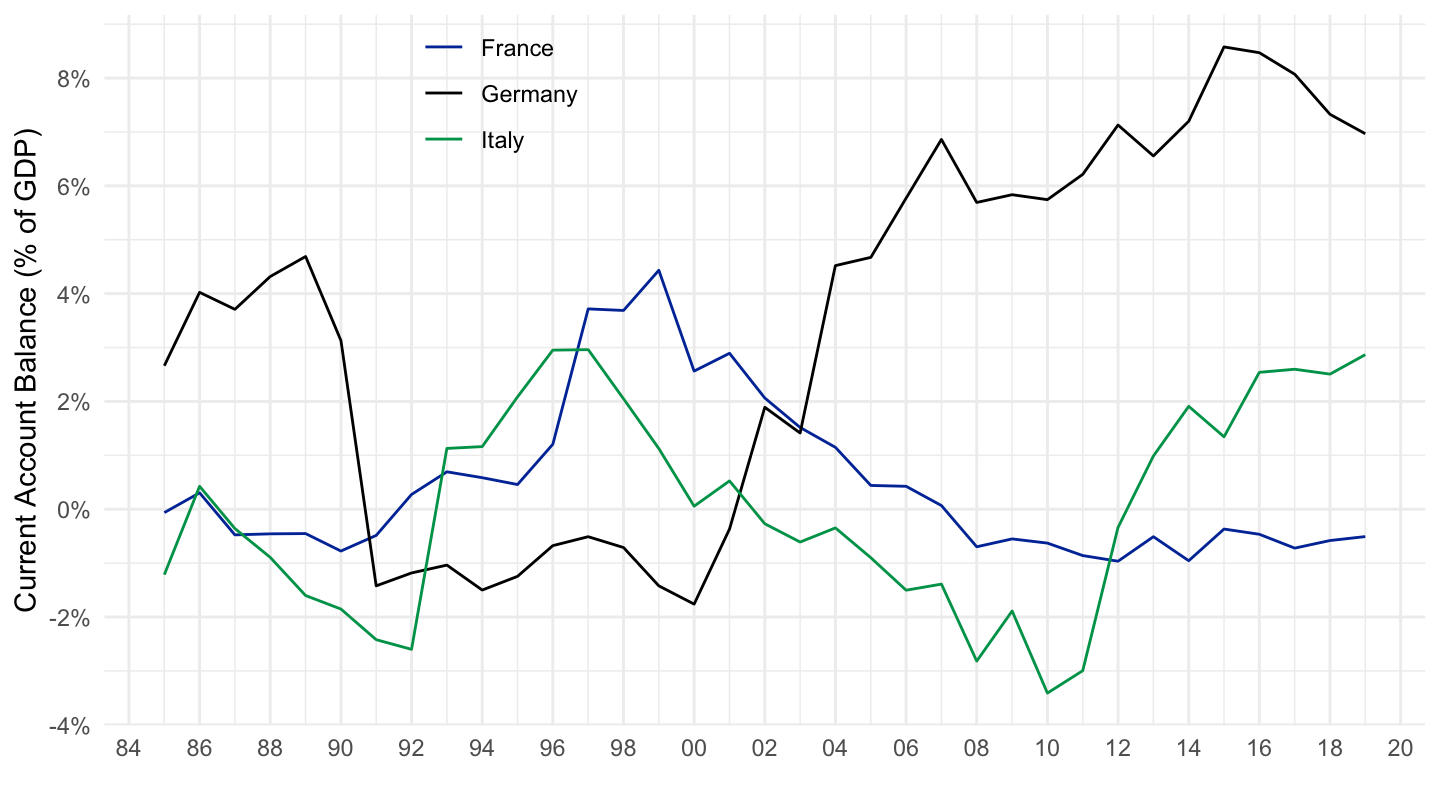
WEO %>%
  left_join(CL_AREA_WEO, by = "iso2c") %>%
  filter(SUBJECT == "BCA_NGDPD",
         Iso2c %in% c("France", "Germany", "Italy"),
         date <= as.Date("2019-01-01")) %>%
  ggplot() +
  geom_line(aes(x = date, y = value/100, color = Iso2c)) +
  scale_color_manual(values = c("#002395", "#000000", "#009246")) +
  theme_minimal() +
  scale_x_date(breaks = seq(1920, 2100, 2) %>% paste0("-01-01") %>% as.Date,
               labels = date_format("%Y")) +
  theme(legend.position = c(0.3, 0.9),
        legend.title = element_blank()) +
  scale_y_continuous(breaks = 0.01*seq(-90, 90, 2),
                     labels = percent_format(accuracy = 1)) +
  ylab("Current Account Balance (% of GDP)") + xlab("")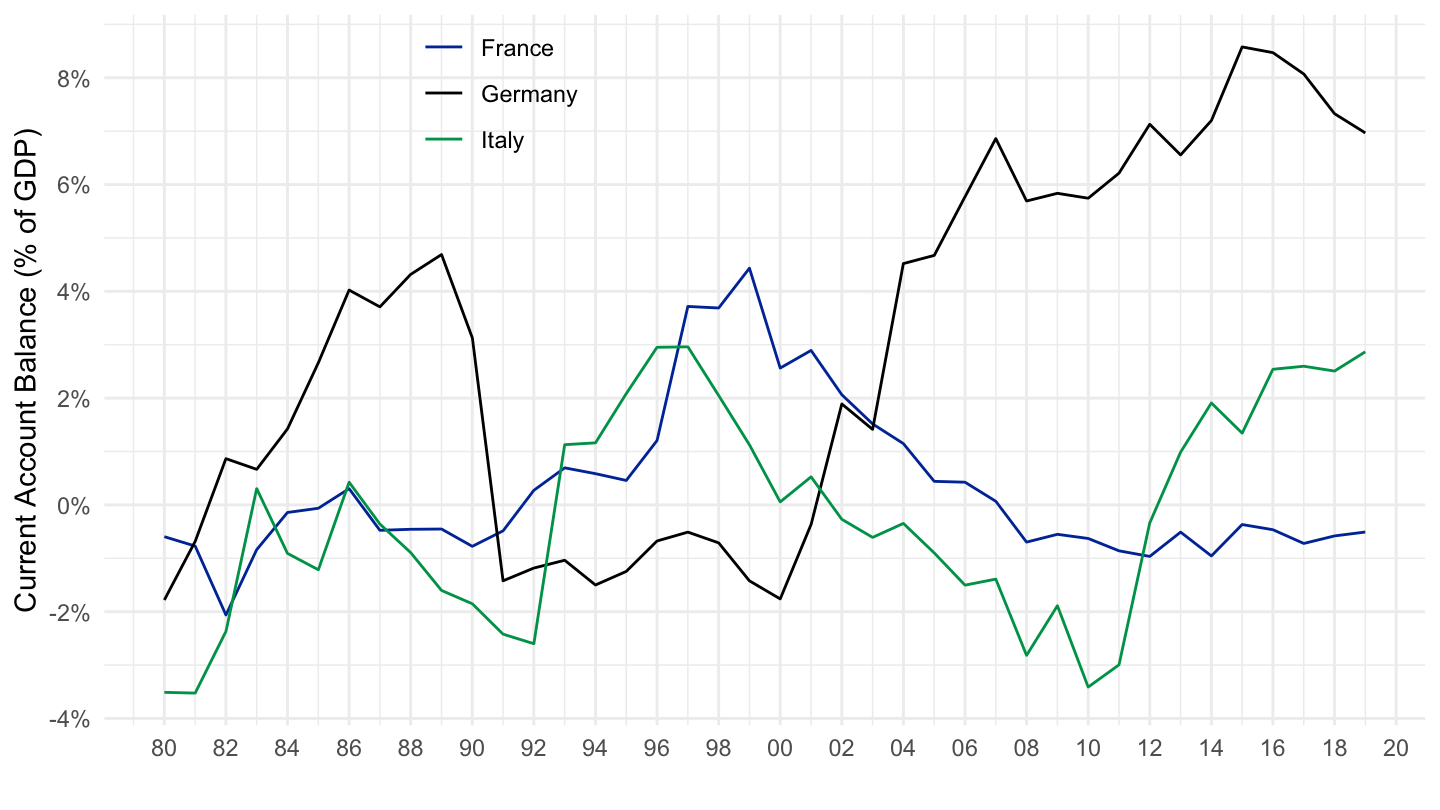
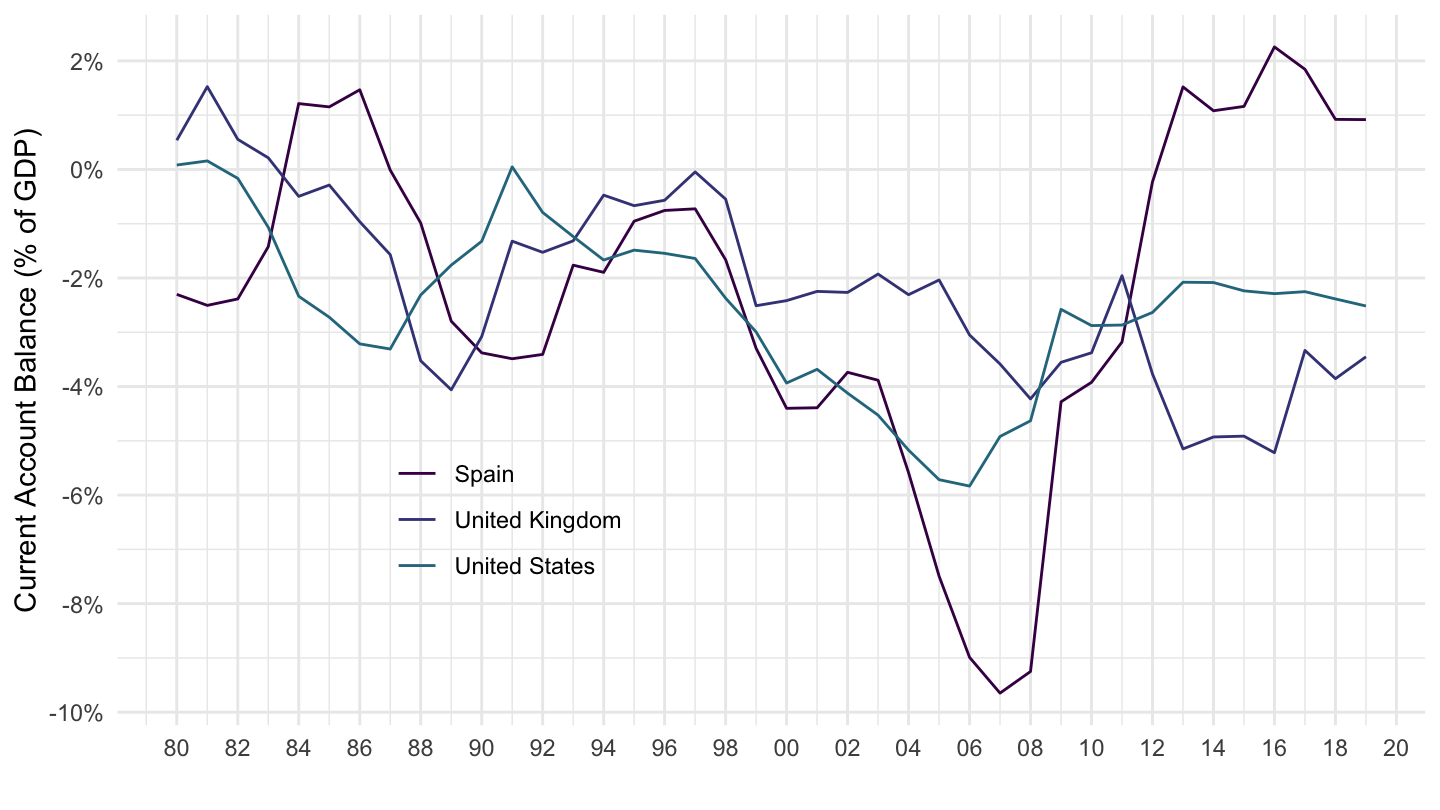
WEO %>%
  left_join(CL_AREA_WEO, by = "iso2c") %>%
  filter(SUBJECT == "BCA_NGDPD",
         Iso2c %in% c("United States", "United Kingdom", "Spain"),
         date <= as.Date("2019-01-01")) %>%
  ggplot() +
  geom_line(aes(x = date, y = value/100, color = Iso2c)) +

  theme_minimal() +
  scale_x_date(breaks = seq(1920, 2100, 2) %>% paste0("-01-01") %>% as.Date,
               labels = date_format("%Y")) +
  theme(legend.position = c(0.3, 0.3),
        legend.title = element_blank()) +
  scale_y_continuous(breaks = 0.01*seq(-90, 90, 2),
                     labels = percent_format(accuracy = 1)) +
  ylab("Current Account Balance (% of GDP)") + xlab("")