Code
IFS_M <- read_parquet("IFS_M.parquet")
CL_INDICATOR_IFS <- read_parquet("CL_INDICATOR_IFS.parquet")
CL_AREA_IFS <- read_parquet("CL_AREA_IFS.parquet")

iso2c <- CL_AREA_IFS |>
setNames(c("iso2c", "iso2c_desc"))IFS_M <- read_parquet("IFS_M.parquet")
CL_INDICATOR_IFS <- read_parquet("CL_INDICATOR_IFS.parquet")
CL_AREA_IFS <- read_parquet("CL_AREA_IFS.parquet")
iso2c <- CL_AREA_IFS |>
setNames(c("iso2c", "iso2c_desc"))IFS_M |>
left_join(CL_INDICATOR_IFS, by = "INDICATOR") |>
group_by(INDICATOR, INDICATOR_desc) |>
summarise(Nobs = n()) |>
arrange(-Nobs) %>%
{if (is_html_output()) datatable(., filter = 'top', rownames = F) else .}IFS_M |>
left_join(CL_AREA_IFS, by = c("iso2c" = "AREA")) |>
group_by(iso2c, AREA_desc) |>
summarise(Nobs = n()) |>
arrange(-Nobs) %>%
{if (is_html_output()) datatable(., filter = 'top', rownames = F) else .}IFS_M |>
filter(INDICATOR == "ENDE_XDC_USD_RATE",
iso2c %in% c("GB", "FR", "DE")) |>
left_join(iso2c, by = "iso2c") |>
add_flag_color("iso2c_desc") |>
ggplot() + scale_color_identity() + add_flags +
geom_line(aes(x = date, y = value, color = color)) +
theme_minimal() + xlab("") + ylab("Exchange Rate ($1 = ?National Currency)") +
scale_x_date(breaks = seq(1960, 2100, 5) |> paste0("-01-01") |> as.Date(),
labels = date_format("%Y")) +
scale_y_continuous(breaks = seq(0, 10, 1),
labels = dollar_format(accuracy = 0.1, prefix = "", suffix = "../$")) +
theme(legend.position = c(0.8, 0.80),
legend.title = element_blank())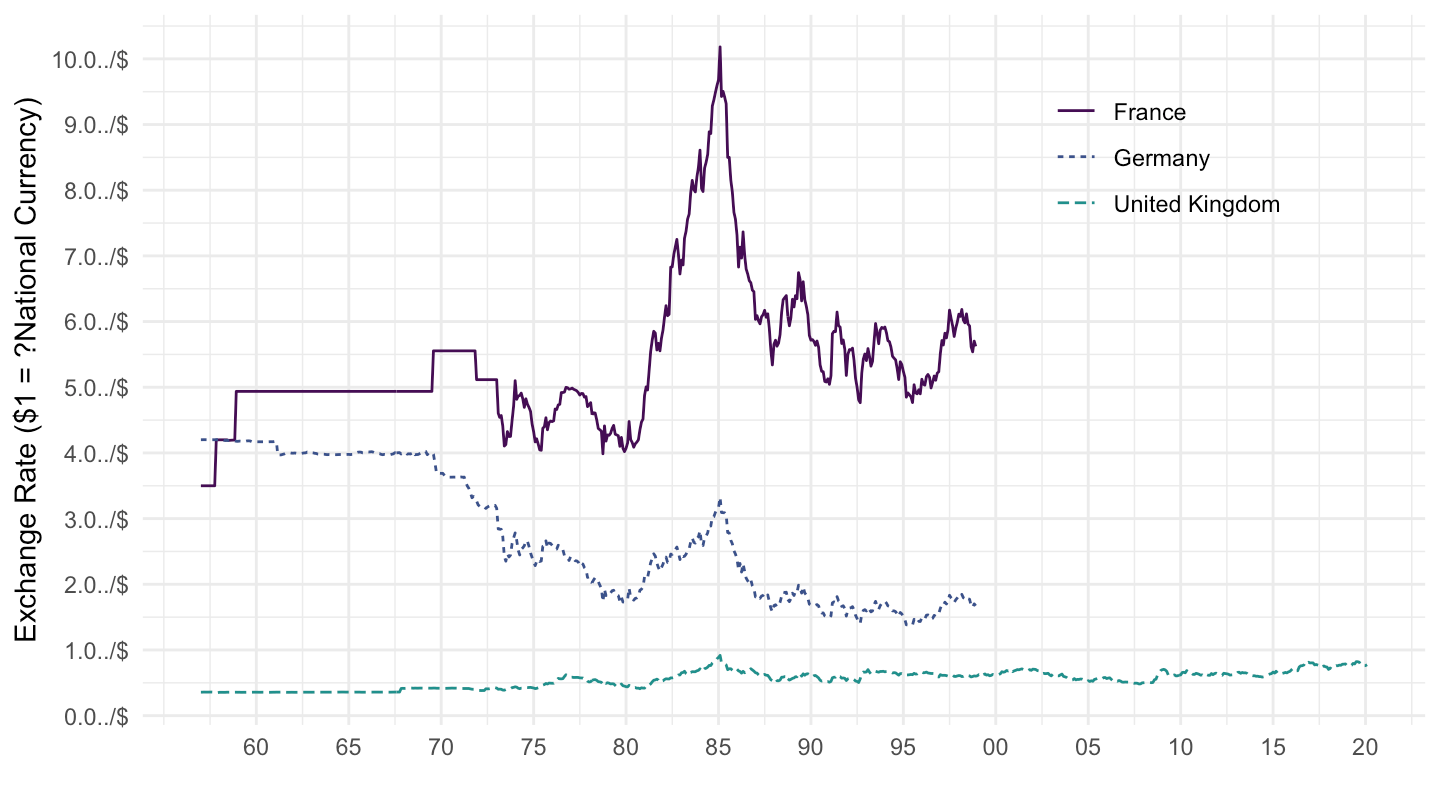
IFS_M |>
  filter(INDICATOR == "EREER_ULC_IX",
         iso2c %in% c("GB", "FR", "DE", "US")) |>
  left_join(iso2c, by = "iso2c") |>
    add_flag_color("iso2c_desc") |>
ggplot() + scale_color_identity() + add_flags +
  geom_line(aes(x = date, y = value, color = color)) +
  theme_minimal() + xlab("") + ylab("REER based on ULC") +
  scale_x_date(breaks = seq(1960, 2100, 5) |> paste0("-01-01") |> as.Date(),
               labels = date_format("%Y")) +
  scale_y_log10(breaks = seq(0, 200, 10),
                     labels = dollar_format(accuracy = 1, prefix = "")) +
  theme(legend.position = c(0.8, 0.2),
        legend.title = element_blank())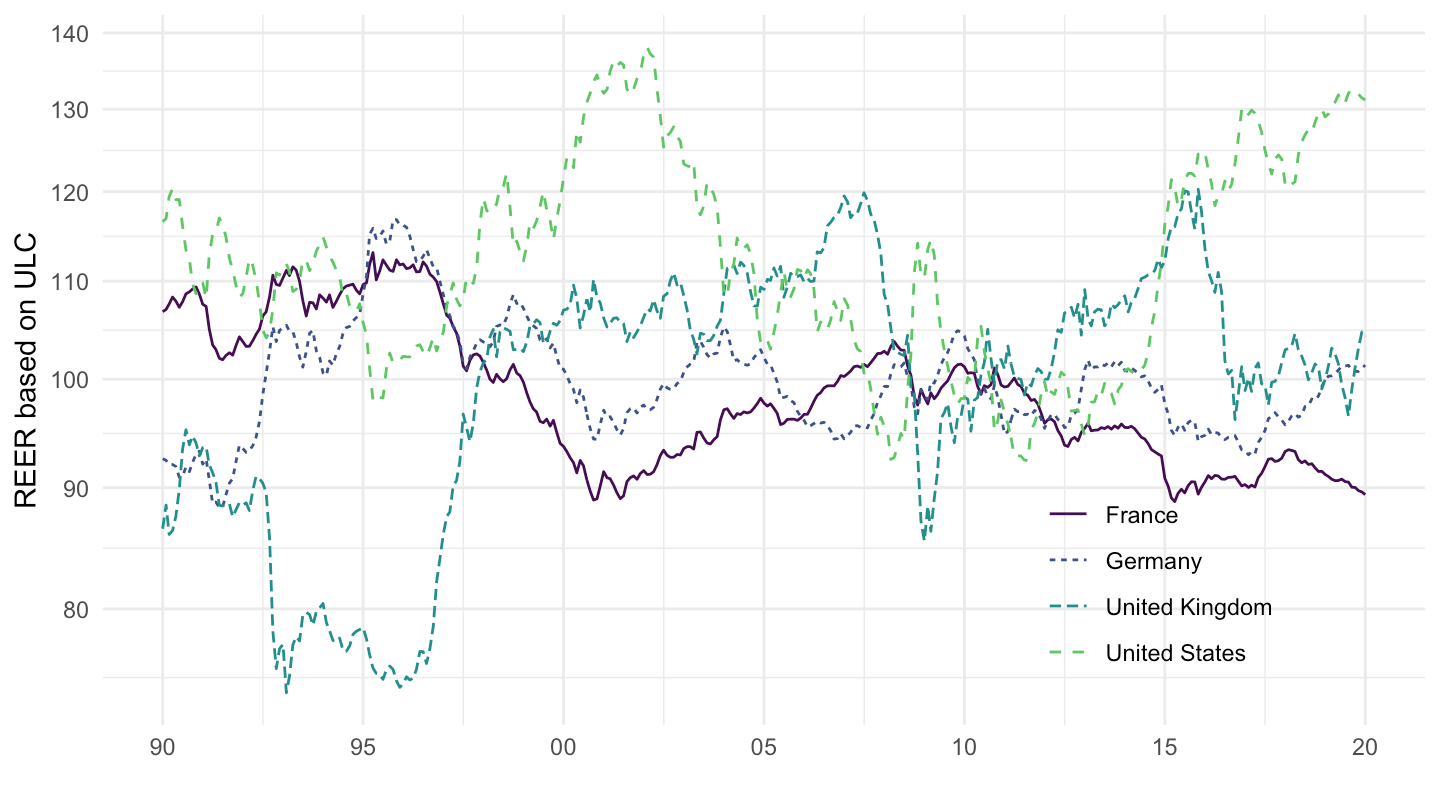
IFS_M |>
  filter(INDICATOR == "EREER_IX",
         iso2c %in% c("GB", "FR", "DE", "US")) |>
  left_join(iso2c, by = "iso2c") |>
    add_flag_color("iso2c_desc") |>
ggplot() + scale_color_identity() + add_flags +
  geom_line(aes(x = date, y = value, color = color)) +
  theme_minimal() + xlab("") + ylab("REER based on CPI") +
  scale_x_date(breaks = seq(1960, 2100, 5) |> paste0("-01-01") |> as.Date(),
               labels = date_format("%Y")) +
  scale_y_log10(breaks = seq(0, 200, 10),
                     labels = dollar_format(accuracy = 1, prefix = "")) +
  theme(legend.position = c(0.8, 0.80),
        legend.title = element_blank())
IFS_M |>
  filter(INDICATOR == "FPE_IX") |>
  left_join(iso2c, by = "iso2c") |>
  group_by(iso2c, iso2c_desc) |>
  summarise(start = first(date),
            end = last(date),
            Nobs = n()) |>
  arrange(-Nobs) %>%
{if (is_html_output()) datatable(., filter = 'top', rownames = F) else .}IFS_M |>
filter(INDICATOR == "FPE_IX",
iso2c %in% c("GB", "FR", "DE", "US")) |>
left_join(iso2c, by = "iso2c") |>
add_flag_color("iso2c_desc") |>
ggplot() + scale_color_identity() + add_flags +
geom_line(aes(x = date, y = value, color = color)) +
theme_minimal() + xlab("") + ylab("Market Values") +
scale_x_date(breaks = seq(1950, 2100, 5) |> paste0("-01-01") |> as.Date(),
labels = date_format("%Y")) +
scale_y_log10(breaks = c(seq(0, 5, 1), seq(0, 50, 10), seq(0, 200, 50)),
labels = dollar_format(accuracy = 1, prefix = "")) +
theme(legend.position = c(0.8, 0.20),
legend.title = element_blank())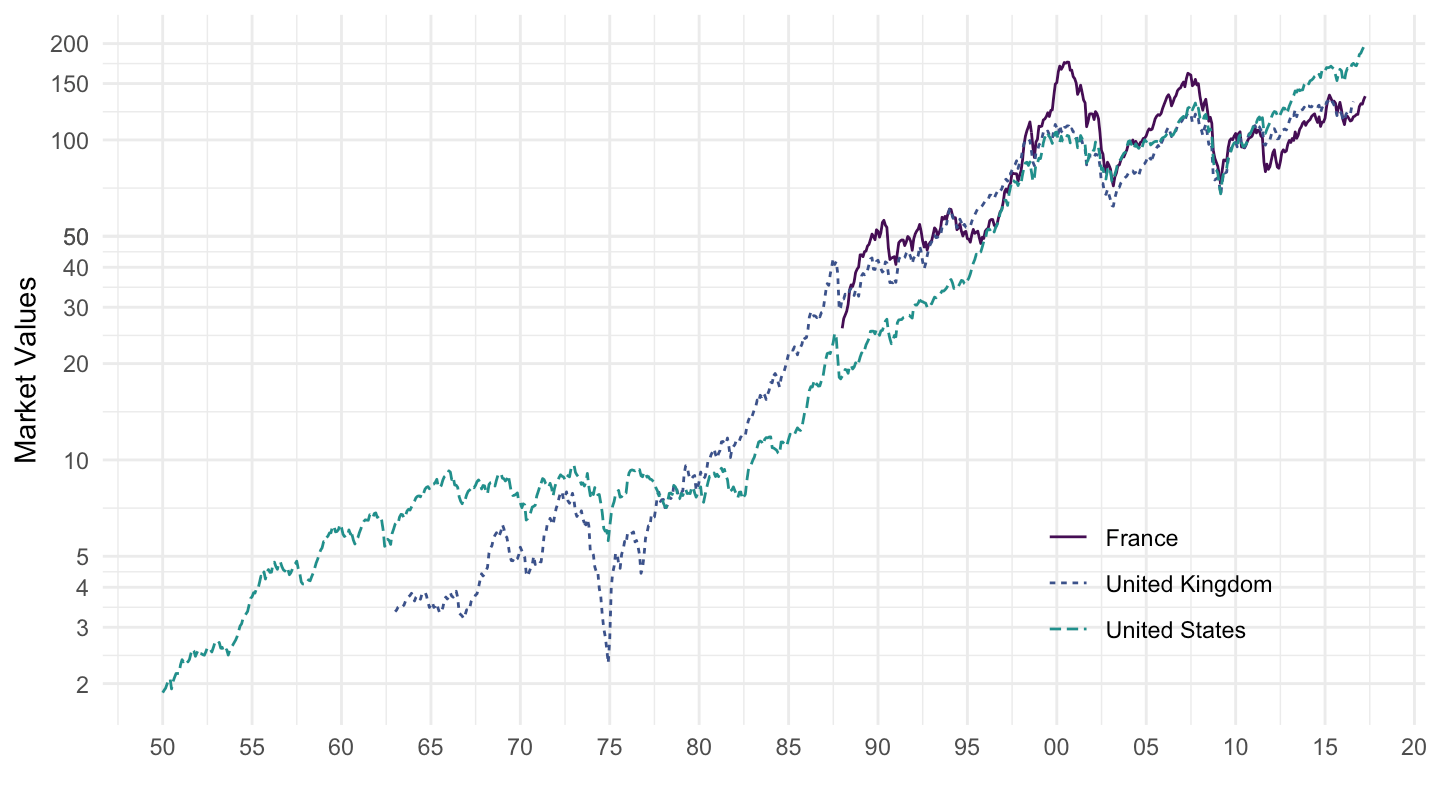
IFS_M |>
  filter(INDICATOR == "FPE_IX",
         iso2c %in% c("NL", "IT", "GR")) |>
  left_join(iso2c, by = "iso2c") |>
    add_flag_color("iso2c_desc") |>
ggplot() + scale_color_identity() + add_flags +
  geom_line(aes(x = date, y = value, color = color)) +
  theme_minimal() + xlab("") + ylab("Market Values") +
  scale_x_date(breaks = seq(1950, 2100, 5) |> paste0("-01-01") |> as.Date(),
               labels = date_format("%Y")) +
  scale_y_log10(breaks = c(seq(0, 5, 1), seq(0, 50, 10), seq(0, 200, 50)),
                     labels = dollar_format(accuracy = 1, prefix = "")) +
  theme(legend.position = c(0.8, 0.20),
        legend.title = element_blank())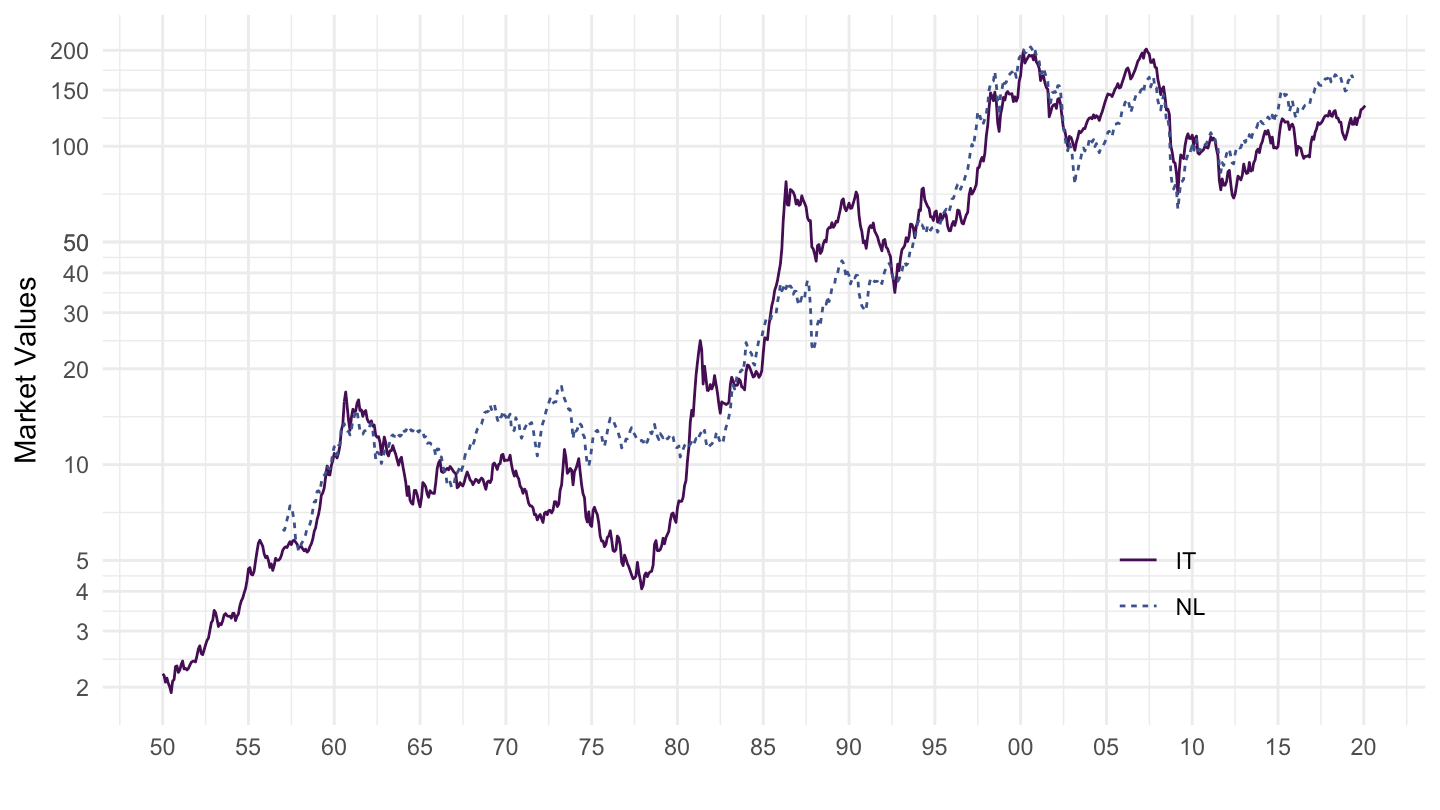
IFS_M |>
  filter(INDICATOR == "FPE_IX",
         iso2c %in% c("JP", "CN")) |>
  left_join(iso2c, by = "iso2c") |>
    add_flag_color("iso2c_desc") |>
ggplot() + scale_color_identity() + add_flags +
  geom_line(aes(x = date, y = value, color = color)) +
  theme_minimal() + xlab("") + ylab("Market Values") +
  scale_x_date(breaks = seq(1950, 2100, 5) |> paste0("-01-01") |> as.Date(),
               labels = date_format("%Y")) +
  scale_y_log10(breaks = c(seq(0, 5, 1), seq(0, 50, 10), seq(0, 400, 50)),
                     labels = dollar_format(accuracy = 1, prefix = "")) +
  theme(legend.position = c(0.8, 0.20),
        legend.title = element_blank())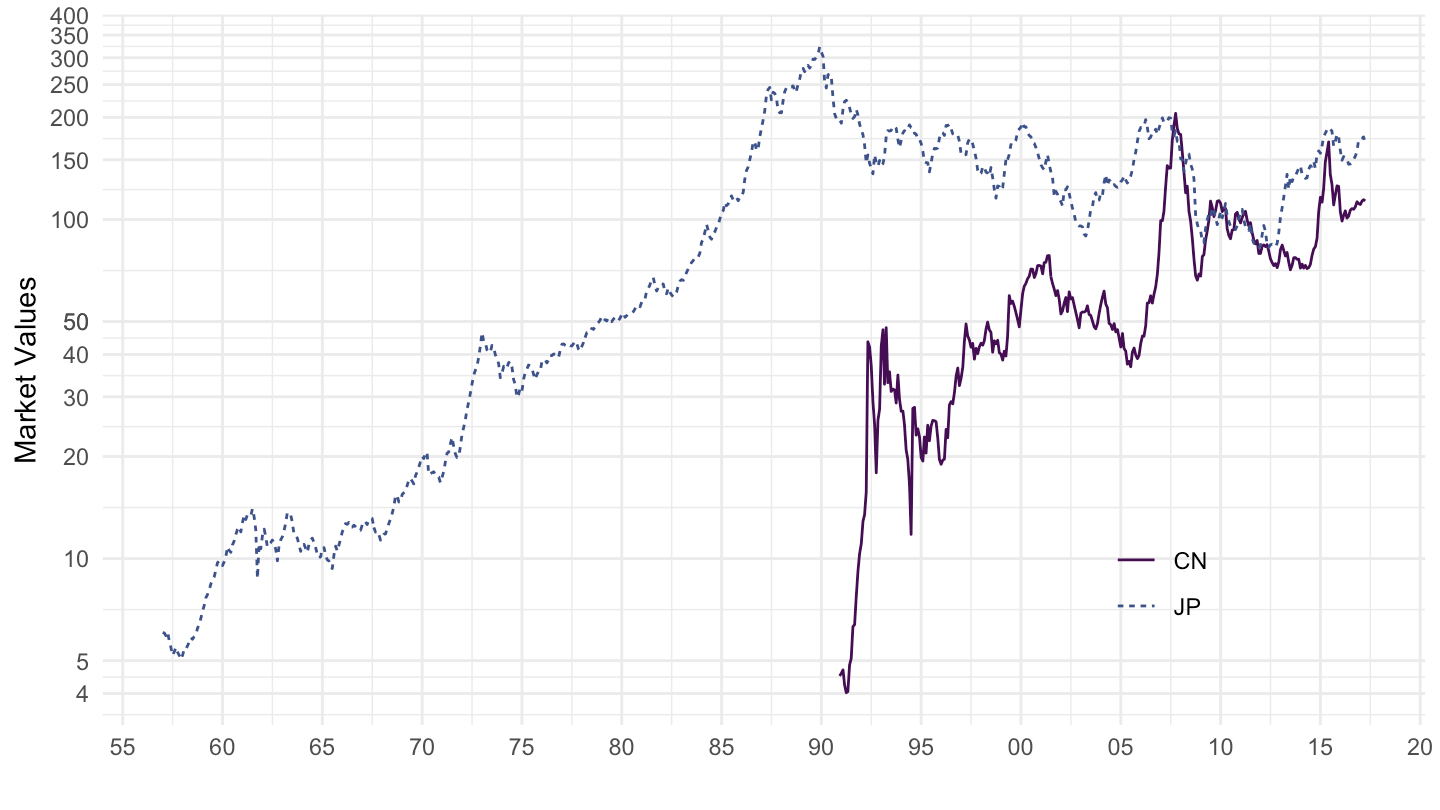
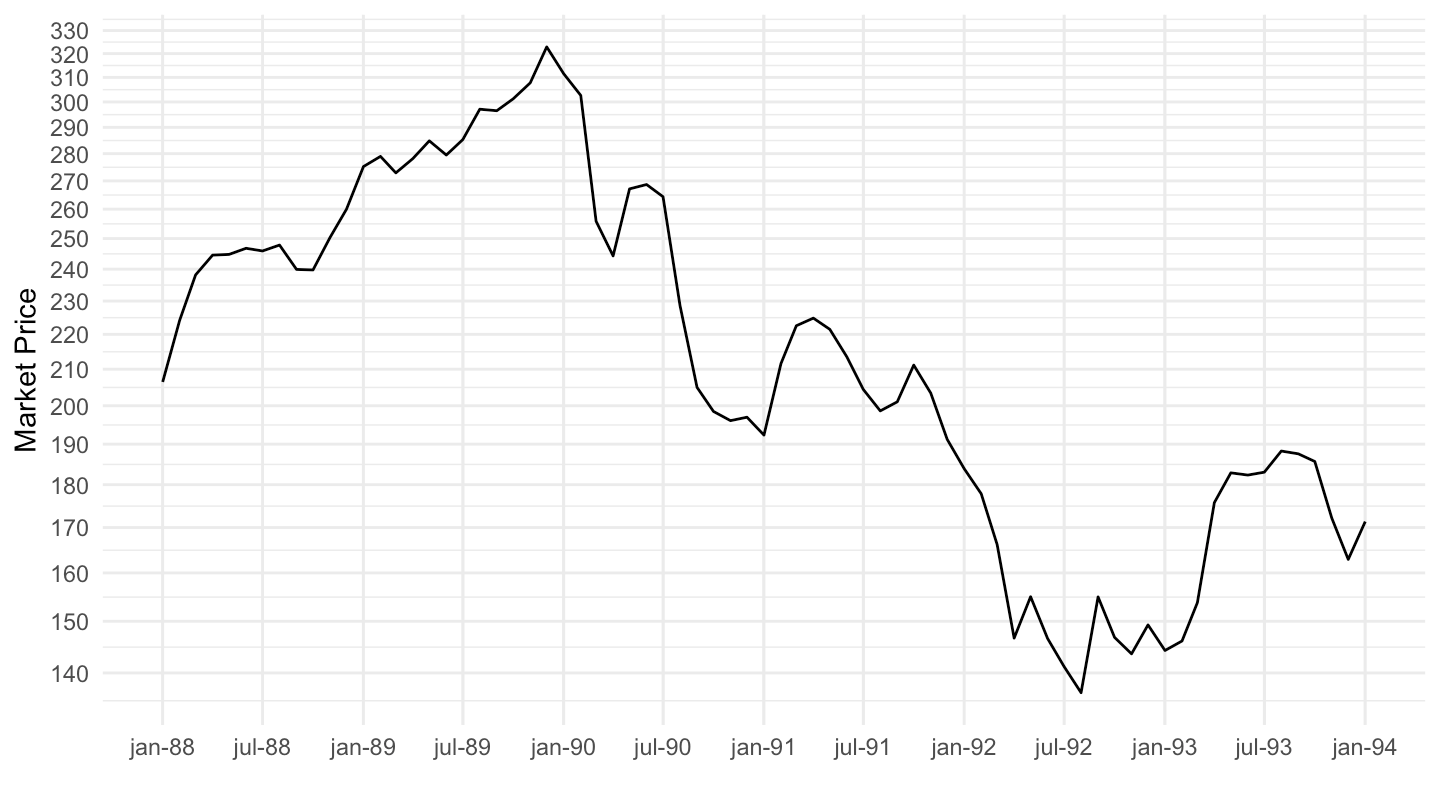
IFS_M |>
  filter(INDICATOR == "FPE_IX",
         iso2c %in% c("JP"),
         date >= as.Date("1988-01-01"),
         date <= as.Date("1994-01-01")) |>
  ggplot() + theme_minimal() + xlab("") + ylab("Market Price") +
  geom_line(aes(x = date, y = value)) +
  scale_x_date(breaks = c(paste0(seq(1950, 2020, 1), "-01-01"),
                          paste0(seq(1950, 2020, 1), "-07-01")) |> as.Date(),
               labels = date_format("%b-%Y")) +
  scale_y_log10(breaks = c(seq(0, 5, 1), seq(0, 50, 10), seq(0, 400, 10)),
                     labels = dollar_format(accuracy = 1, prefix = "")) +
  scale_color_manual(values = viridis(5)[1:4]) +
  theme(legend.position = c(0.8, 0.20),
        legend.title = element_blank())