Last observation: févr. 2020 (N = 1555) · 2020 (N = 210) · Q1 2020 (N = 2)
First observation: 1920 (N = 3) · Q1 1920 (N = 2) · janv. 1940 (N = 52)
Last data update: 01 août 2026, 21:42
Last compile: 24 oct. 2026, 01:27
IFS |>
  left_join(INDICATOR, by = "INDICATOR") |>
  group_by(INDICATOR, Indicator, FREQ) |>
  summarise(Nobs = n()) |>
  arrange(-Nobs) %>%
{if (is_html_output()) datatable(., filter = 'top', rownames = F) else .}IFS |>
left_join(CL_AREA_IFS, by = c("iso2c" = "AREA")) |>
group_by(iso2c, AREA_desc, FREQ) |>
summarise(Nobs = n()) |>
arrange(-Nobs) %>%
{if (is_html_output()) datatable(., filter = 'top', rownames = F) else .}IFS |>
filter(INDICATOR == "EDNA_USD_XDC_RATE") |>
left_join(CL_AREA_IFS, by = c("iso2c" = "AREA")) |>
group_by(iso2c, AREA_desc, FREQ) |>
summarise(Nobs = n(),
date1 = first(date),
date2 = last(date)) |>
arrange(-Nobs) %>%
{if (is_html_output()) datatable(., filter = 'top', rownames = F) else .}IFS |>
filter(iso2c == "FR",
INDICATOR %in% c("FIDR_PA", "FILR_PA", "FIMM_PA", "FIGB_PA")) |>
left_join(INDICATOR, by = "INDICATOR") |>
ggplot() + theme_minimal() +
geom_line(aes(x = date, y = value / 100, color = Indicator, linetype = Indicator)) +
scale_y_continuous(breaks = 0.01*seq(0, 300, 1),
labels = scales::percent_format(accuracy = 1)) +
scale_color_manual(values = viridis(5)[1:4]) +
theme(legend.position = c(0.45, 0.85),
legend.title = element_blank()) +
scale_x_date(breaks = as.Date(paste0(seq(1700, 2020, 5), "-01-01")),
labels = date_format("%Y")) +
xlab("") + ylab("Interest Rates")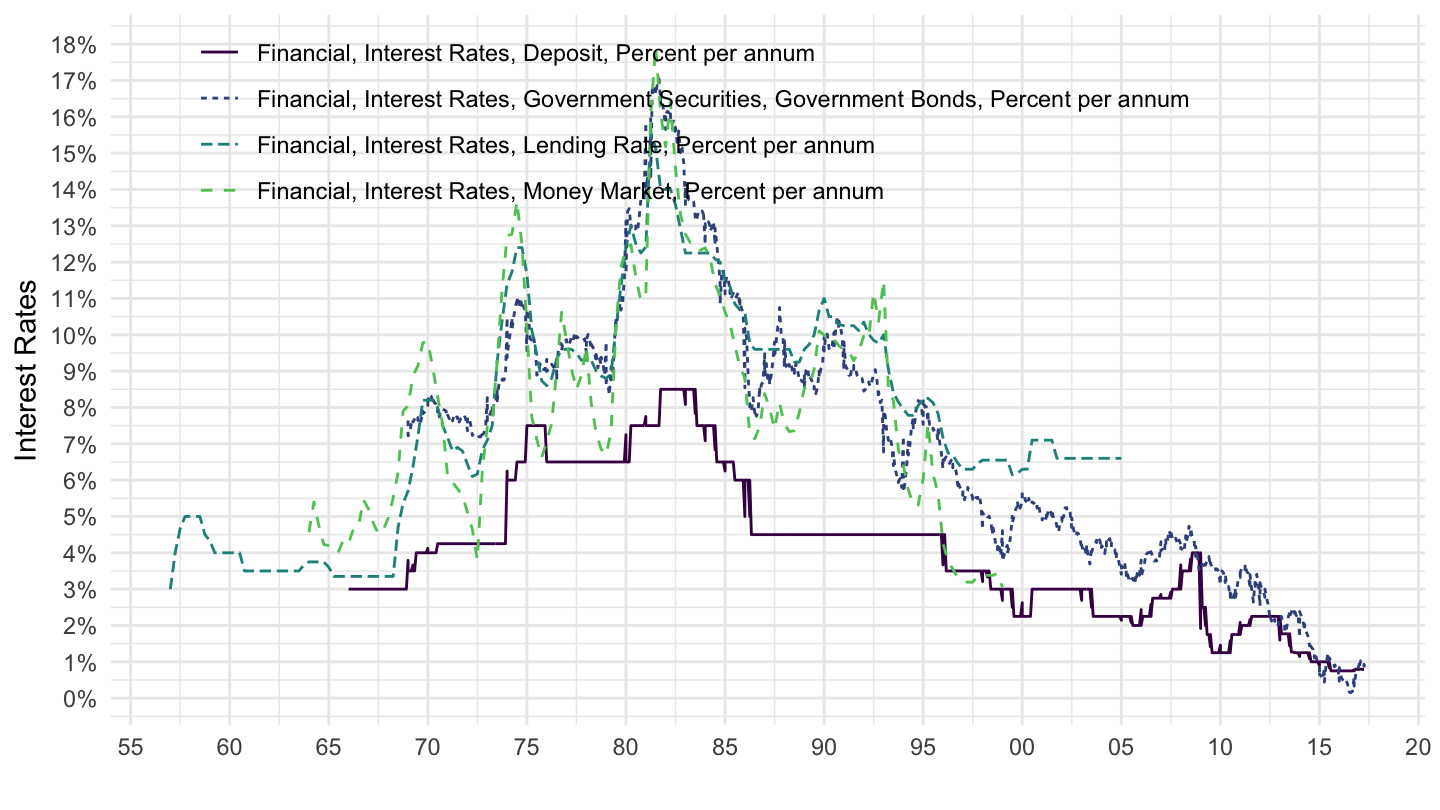
IFS |>
  filter(iso2c == "DE",
         INDICATOR %in% c("FIDR_PA", "FILR_PA", "FIMM_PA", "FIGB_PA")) |>
  left_join(INDICATOR, by = "INDICATOR") |>
  ggplot() + theme_minimal() +
  geom_line(aes(x = date, y = value / 100, color = Indicator, linetype = Indicator)) +
  scale_y_continuous(breaks = 0.01*seq(0, 300, 1),
                     labels = scales::percent_format(accuracy = 1)) +
  scale_color_manual(values = viridis(5)[1:4]) +
  theme(legend.position = c(0.45, 0.85),
        legend.title = element_blank()) +
  scale_x_date(breaks = as.Date(paste0(seq(1700, 2020, 5), "-01-01")),
               labels = date_format("%Y")) +
  xlab("") + ylab("Interest Rates")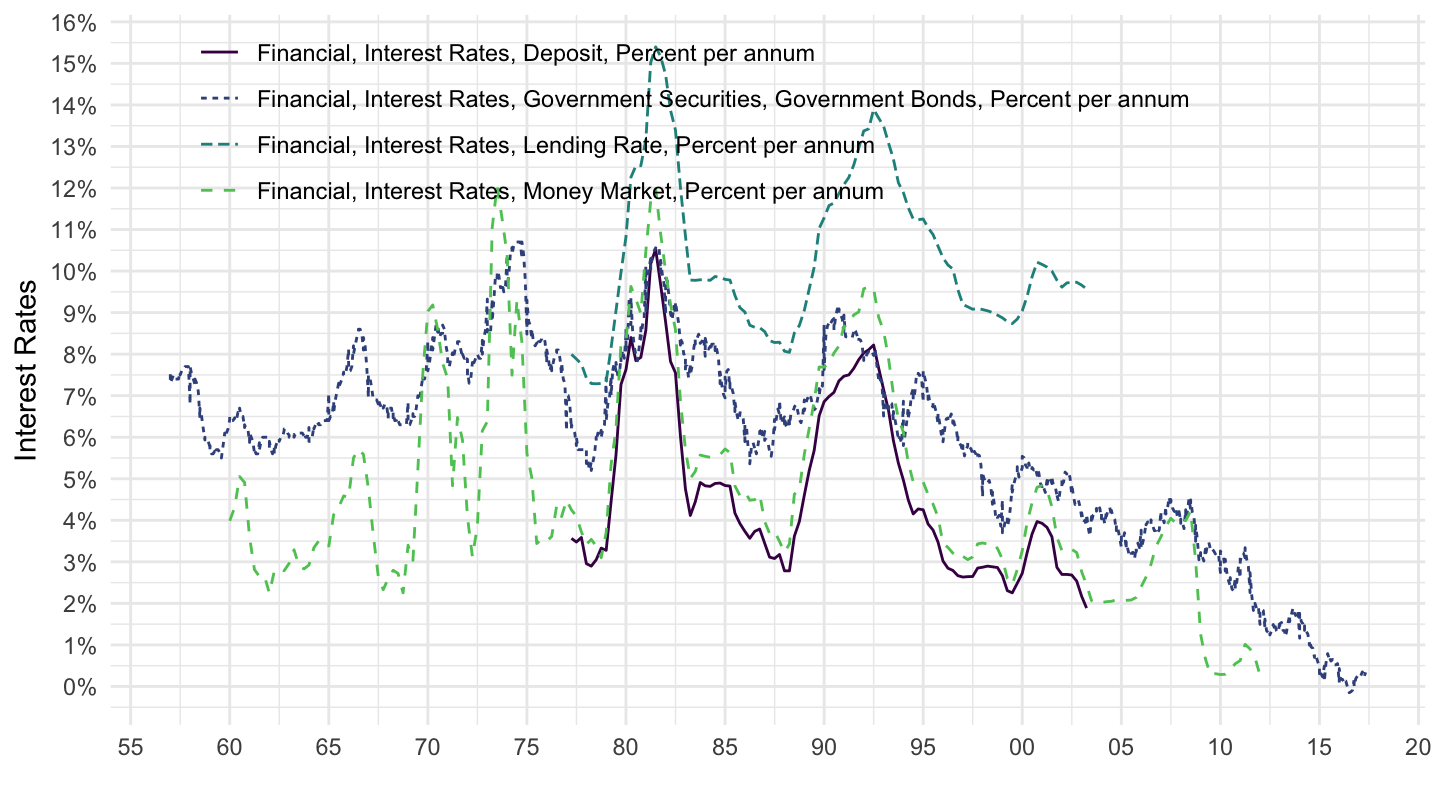
IFS |>
  filter(iso2c == "IT",
         INDICATOR %in% c("FIDR_PA", "FILR_PA", "FIMM_PA", "FIGB_PA")) |>
  left_join(INDICATOR, by = "INDICATOR") |>
  ggplot() + theme_minimal() +
  geom_line(aes(x = date, y = value / 100, color = Indicator, linetype = Indicator)) +
  scale_y_continuous(breaks = 0.01*seq(0, 300, 1),
                     labels = scales::percent_format(accuracy = 1)) +
  scale_color_manual(values = viridis(5)[1:4]) +
  theme(legend.position = c(0.45, 0.85),
        legend.title = element_blank()) +
  scale_x_date(breaks = as.Date(paste0(seq(1700, 2020, 5), "-01-01")),
               labels = date_format("%Y")) +
  xlab("") + ylab("Interest Rates")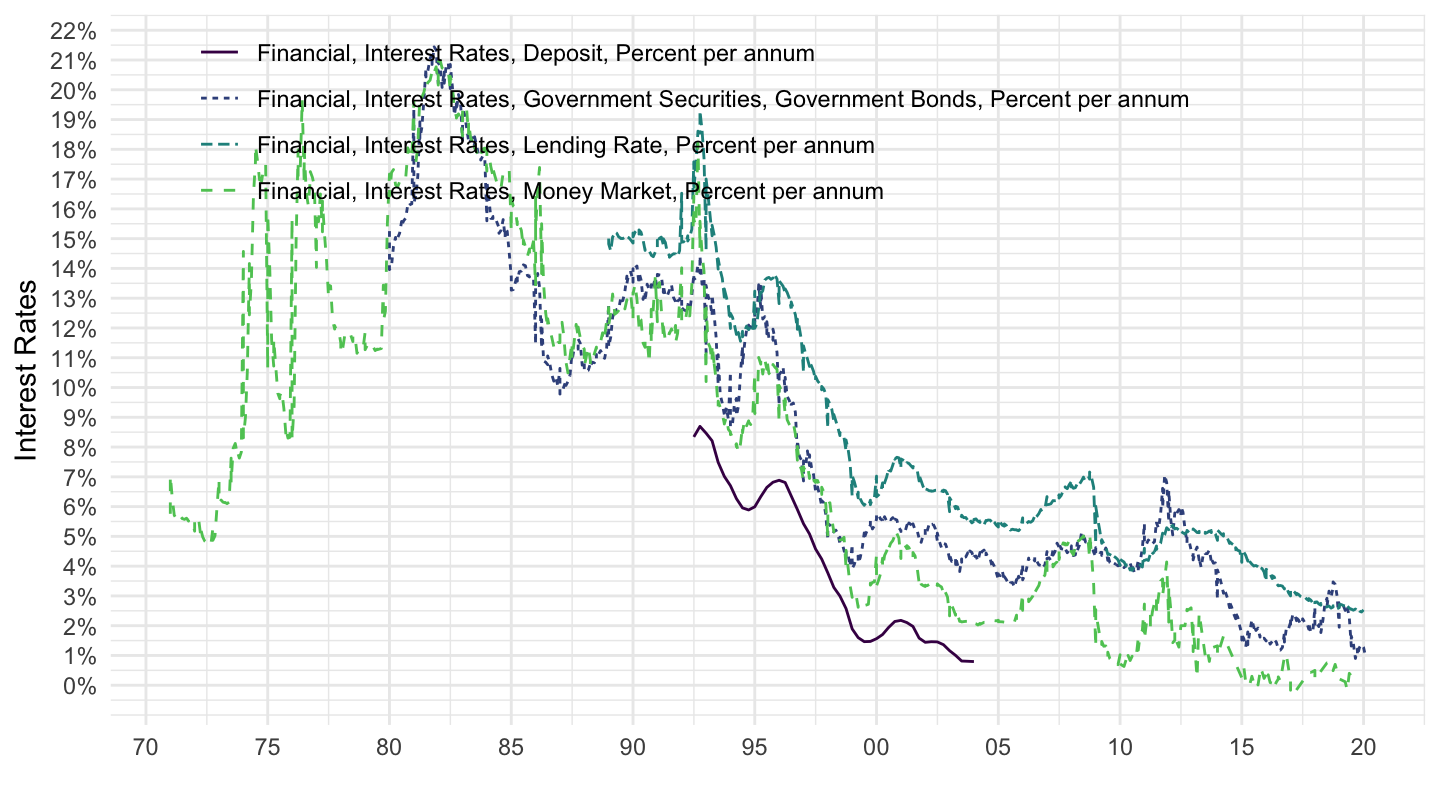
IFS |>
  filter(iso2c == "US",
         INDICATOR %in% c("FIDR_PA", "FILR_PA", "FIMM_PA", "FIGB_PA")) |>
  left_join(INDICATOR, by = "INDICATOR") |>
  ggplot() + theme_minimal() +
  geom_line(aes(x = date, y = value / 100, color = Indicator, linetype = Indicator)) +
  scale_y_continuous(breaks = 0.01*seq(0, 300, 1),
                     labels = scales::percent_format(accuracy = 1)) +
  scale_color_manual(values = viridis(5)[1:4]) +
  theme(legend.position = c(0.45, 0.85),
        legend.title = element_blank()) +
  scale_x_date(breaks = as.Date(paste0(seq(1700, 2020, 5), "-01-01")),
               labels = date_format("%Y")) +
  xlab("") + ylab("Interest Rates")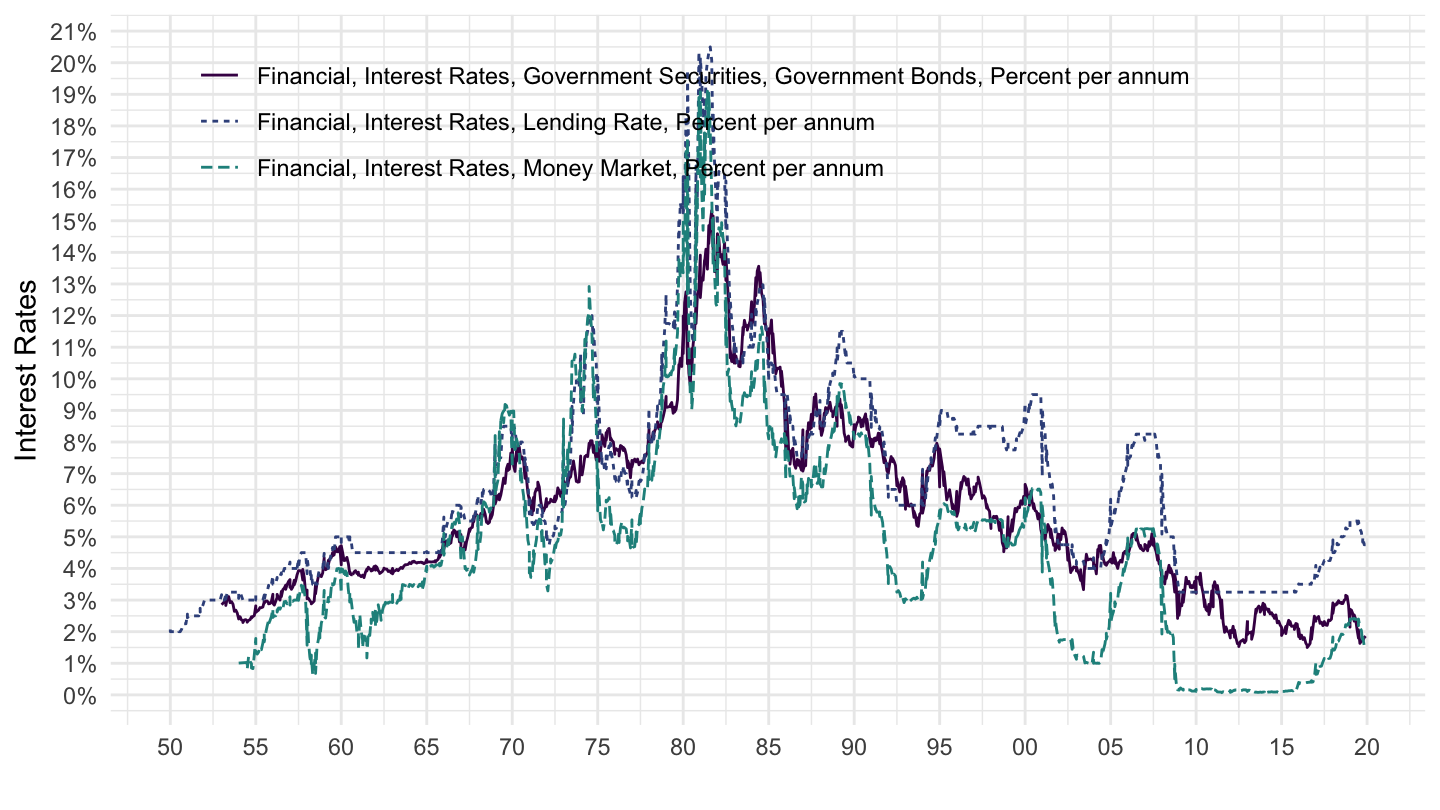
IFS |>
  filter(iso2c == "CL",
         INDICATOR %in% c("FIDR_PA", "FILR_PA", "FIMM_PA", "FIGB_PA")) |>
  left_join(INDICATOR, by = "INDICATOR") |>
  ggplot() + theme_minimal() +
  geom_line(aes(x = date, y = value / 100, color = Indicator, linetype = Indicator)) +
  scale_y_continuous(breaks = 0.01*seq(0, 300, 5),
                     labels = scales::percent_format(accuracy = 1)) +
  scale_color_manual(values = viridis(5)[1:4]) +
  theme(legend.position = c(0.45, 0.85),
        legend.title = element_blank()) +
  scale_x_date(breaks = as.Date(paste0(seq(1700, 2020, 5), "-01-01")),
               labels = date_format("%Y")) +
  xlab("") + ylab("Interest Rates")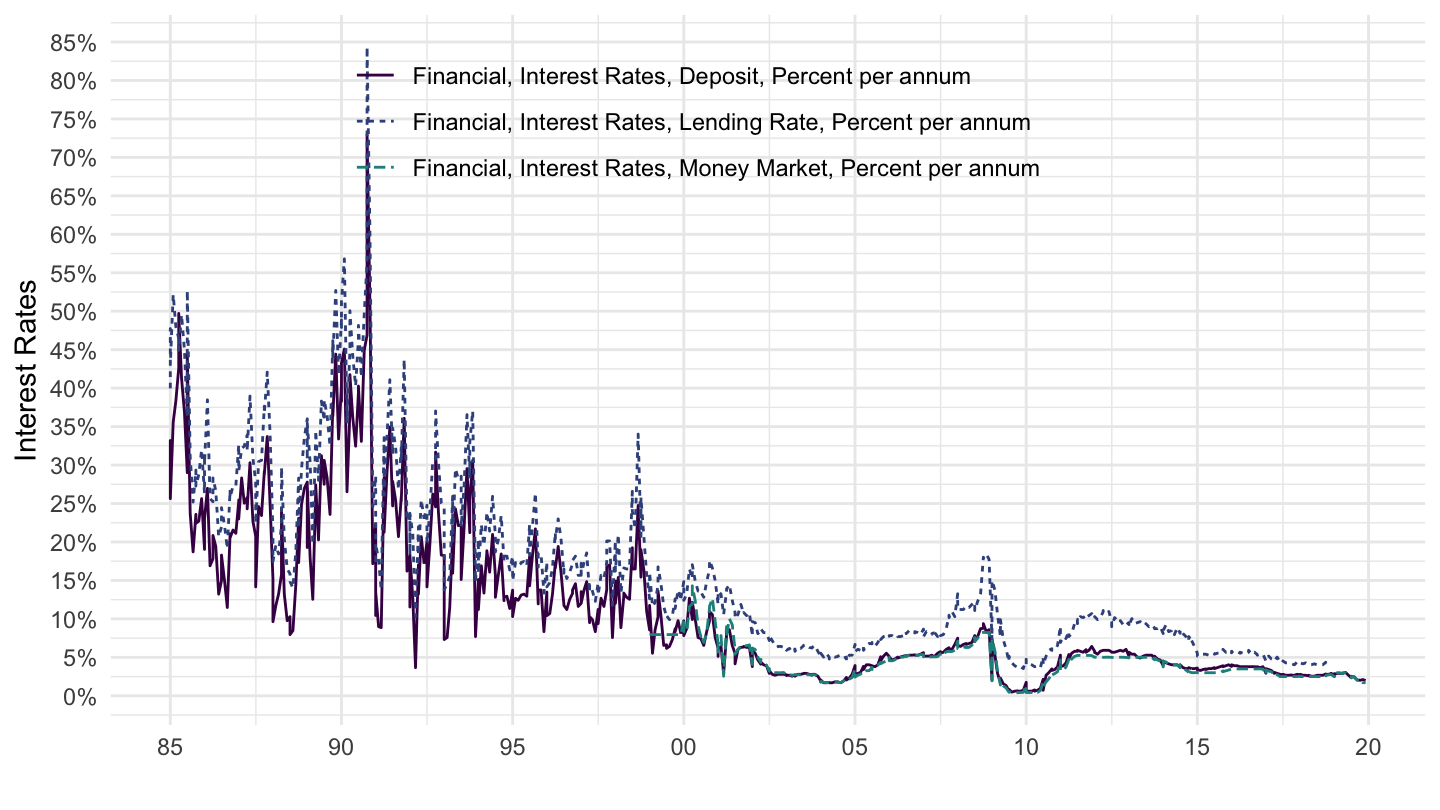
IFS |>
  filter(iso2c == "JP",
         INDICATOR %in% c("FIDR_PA", "FILR_PA", "FIMM_PA", "FIGB_PA")) |>
  left_join(INDICATOR, by = "INDICATOR") |>
  ggplot() + theme_minimal() +
  geom_line(aes(x = date, y = value / 100, color = Indicator, linetype = Indicator)) +
  scale_y_continuous(breaks = 0.01*seq(0, 300, 1),
                     labels = scales::percent_format(accuracy = 1)) +
  scale_color_manual(values = viridis(5)[1:4]) +
  theme(legend.position = c(0.45, 0.85),
        legend.title = element_blank()) +
  scale_x_date(breaks = as.Date(paste0(seq(1700, 2020, 5), "-01-01")),
               labels = date_format("%Y")) +
  xlab("") + ylab("Interest Rates")
IFS |>
  filter(iso2c == "VE",
         INDICATOR %in% c("FIDR_PA", "FILR_PA", "FIMM_PA", "FIGB_PA")) |>
  left_join(INDICATOR, by = "INDICATOR") |>
  ggplot() + theme_minimal() +
  geom_line(aes(x = date, y = value / 100, color = Indicator, linetype = Indicator)) +
  scale_y_continuous(breaks = 0.01*seq(0, 300, 5),
                     labels = scales::percent_format(accuracy = 1)) +
  scale_color_manual(values = viridis(5)[1:4]) +
  theme(legend.position = c(0.45, 0.85),
        legend.title = element_blank()) +
  scale_x_date(breaks = as.Date(paste0(seq(1700, 2020, 5), "-01-01")),
               labels = date_format("%Y")) +
  xlab("") + ylab("Interest Rates")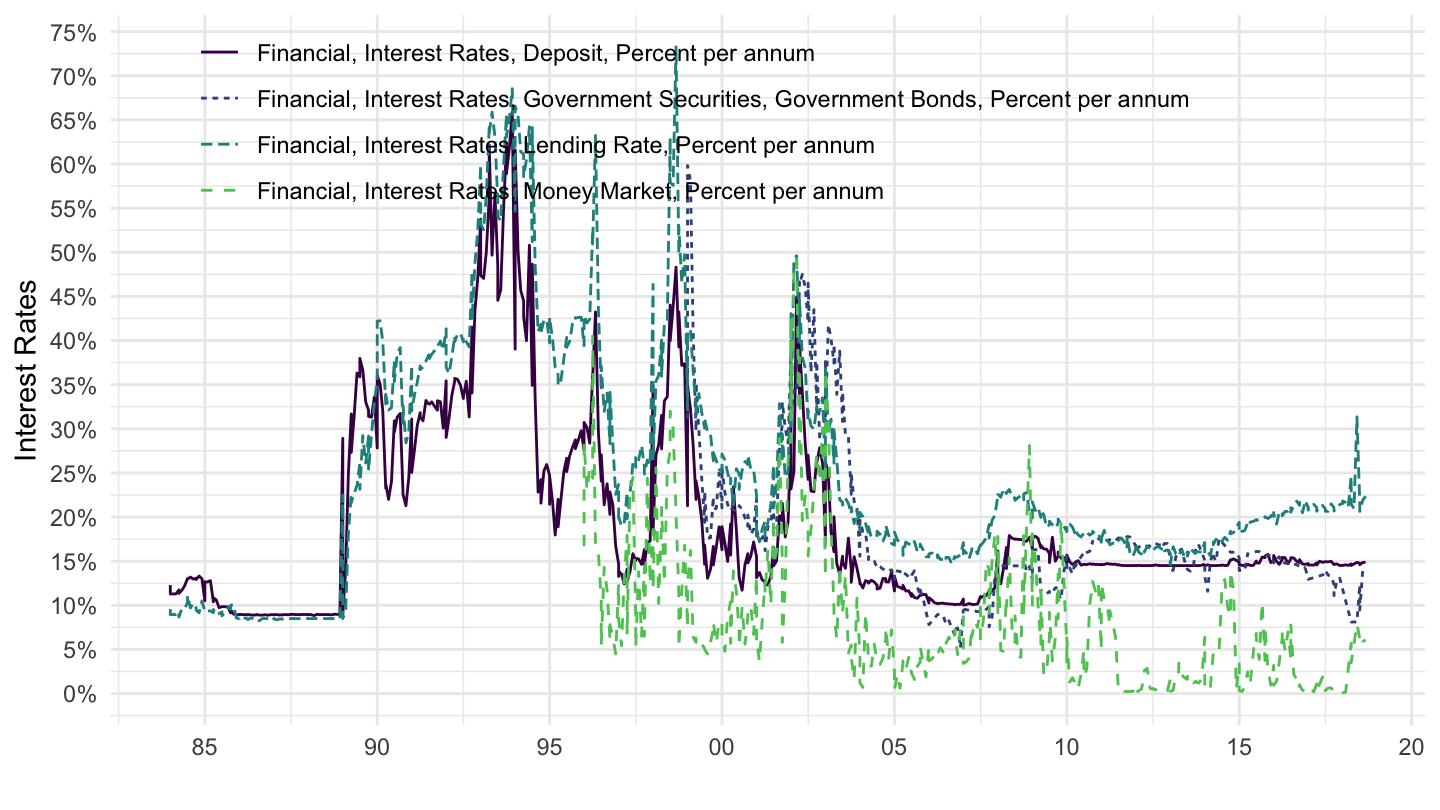
IFS |>
  filter(iso2c == "CA",
         INDICATOR %in% c("FIDR_PA", "FILR_PA", "FIMM_PA", "FIGB_PA")) |>
  left_join(INDICATOR, by = "INDICATOR") |>
  ggplot() + theme_minimal() +
  geom_line(aes(x = date, y = value / 100, color = Indicator, linetype = Indicator)) +
  scale_y_continuous(breaks = 0.01*seq(0, 300, 5),
                     labels = scales::percent_format(accuracy = 1)) +
  scale_color_manual(values = viridis(5)[1:4]) +
  theme(legend.position = c(0.45, 0.85),
        legend.title = element_blank()) +
  scale_x_date(breaks = as.Date(paste0(seq(1700, 2020, 5), "-01-01")),
               labels = date_format("%Y")) +
  xlab("") + ylab("Interest Rates")
IFS |>
  filter(iso2c == "NL",
         INDICATOR %in% c("FIDR_PA", "FILR_PA", "FIMM_PA", "FIGB_PA")) |>
  left_join(INDICATOR, by = "INDICATOR") |>
  ggplot() + theme_minimal() +
  geom_line(aes(x = date, y = value / 100, color = Indicator, linetype = Indicator)) +
  scale_y_continuous(breaks = 0.01*seq(0, 300, 1),
                     labels = scales::percent_format(accuracy = 1)) +
  scale_color_manual(values = viridis(5)[1:4]) +
  theme(legend.position = c(0.45, 0.85),
        legend.title = element_blank()) +
  scale_x_date(breaks = as.Date(paste0(seq(1700, 2020, 5), "-01-01")),
               labels = date_format("%Y")) +
  xlab("") + ylab("Interest Rates")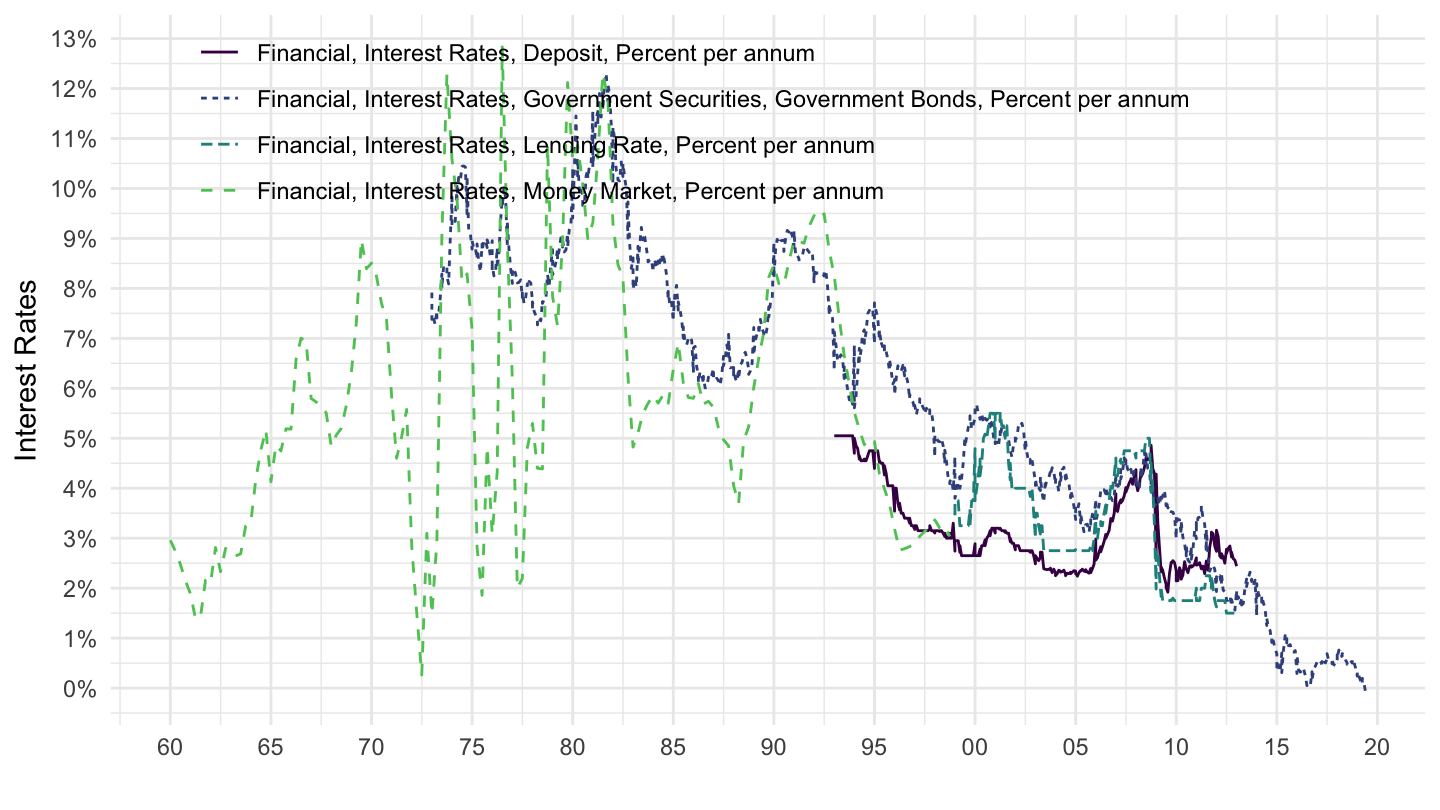
IFS |>
  filter(iso2c == "AU",
         INDICATOR %in% c("FIDR_PA", "FILR_PA", "FIMM_PA", "FIGB_PA")) |>
  left_join(INDICATOR, by = "INDICATOR") |>
  ggplot() + theme_minimal() +
  geom_line(aes(x = date, y = value / 100, color = Indicator, linetype = Indicator)) +
  scale_y_continuous(breaks = 0.01*seq(0, 300, 1),
                     labels = scales::percent_format(accuracy = 1)) +
  scale_color_manual(values = viridis(5)[1:4]) +
  theme(legend.position = c(0.45, 0.85),
        legend.title = element_blank()) +
  scale_x_date(breaks = as.Date(paste0(seq(1700, 2020, 5), "-01-01")),
               labels = date_format("%Y")) +
  xlab("") + ylab("Interest Rates")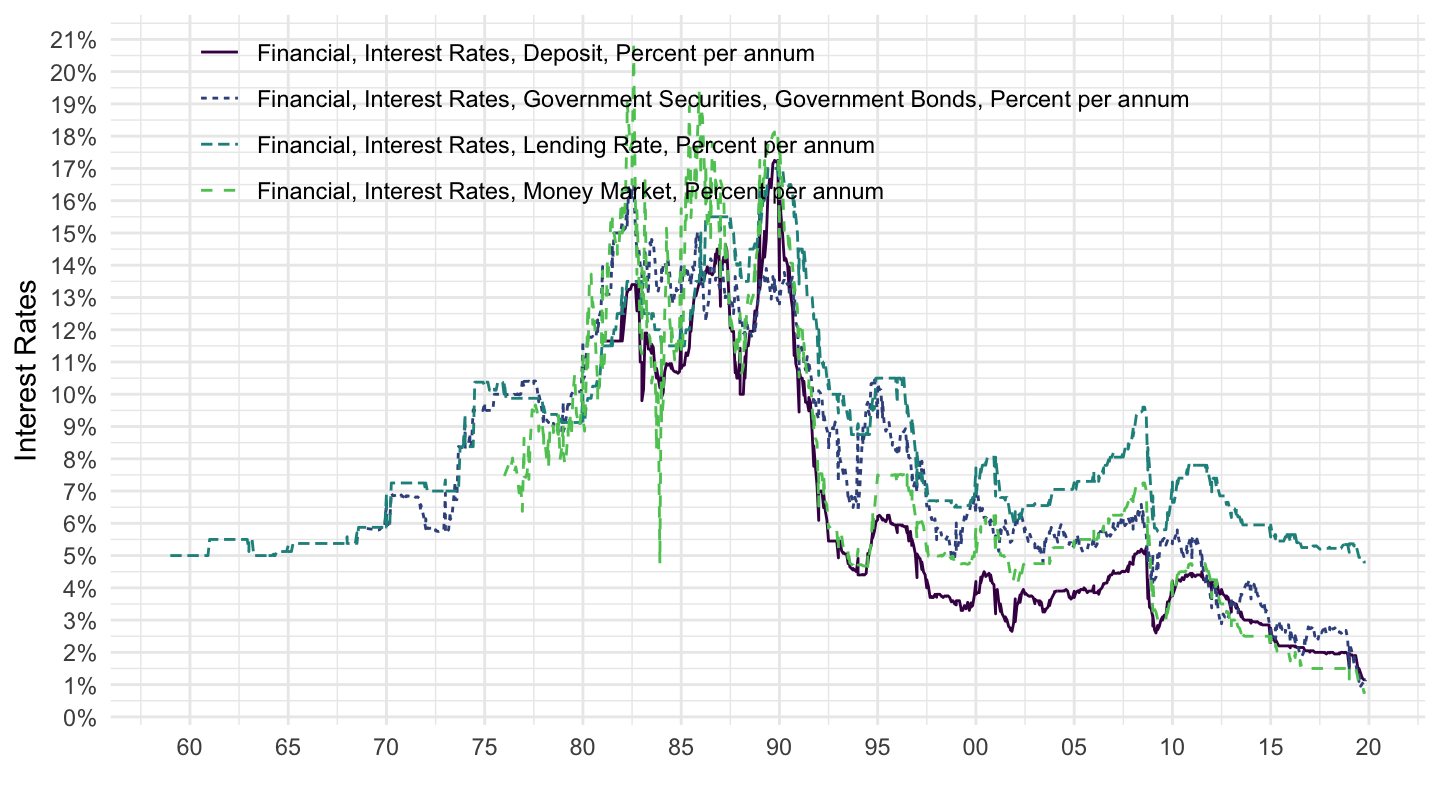
IFS |>
  filter(iso2c == "ES",
         INDICATOR %in% c("FIDR_PA", "FILR_PA", "FIMM_PA", "FIGB_PA")) |>
  left_join(INDICATOR, by = "INDICATOR") |>
  ggplot() + theme_minimal() +
  geom_line(aes(x = date, y = value / 100, color = Indicator, linetype = Indicator)) +
  scale_y_continuous(breaks = 0.01*seq(0, 300, 5),
                     labels = scales::percent_format(accuracy = 1)) +
  scale_color_manual(values = viridis(5)[1:4]) +
  theme(legend.position = c(0.45, 0.85),
        legend.title = element_blank()) +
  scale_x_date(breaks = as.Date(paste0(seq(1700, 2020, 5), "-01-01")),
               labels = date_format("%Y")) +
  xlab("") + ylab("Interest Rates")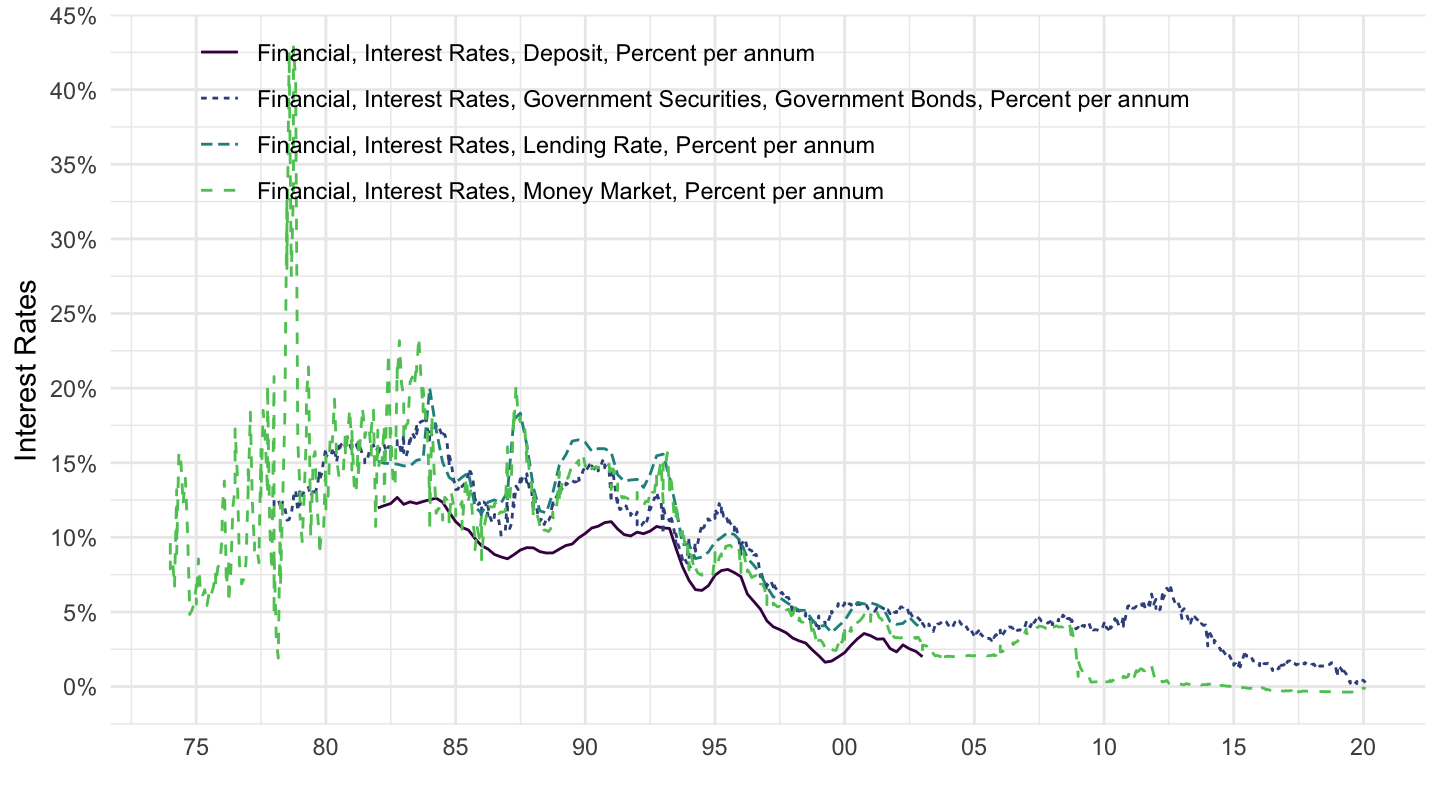
IFS |>
  filter(iso2c == "LB",
         INDICATOR %in% c("FIDR_PA", "FILR_PA", "FIMM_PA", "FIGB_PA")) |>
  left_join(INDICATOR, by = "INDICATOR") |>
  ggplot() + theme_minimal() +
  geom_line(aes(x = date, y = value / 100, color = Indicator, linetype = Indicator)) +
  scale_y_continuous(breaks = 0.01*seq(0, 300, 5),
                     labels = scales::percent_format(accuracy = 1)) +
  scale_color_manual(values = viridis(5)[1:4]) +
  theme(legend.position = c(0.45, 0.85),
        legend.title = element_blank()) +
  scale_x_date(breaks = as.Date(paste0(seq(1700, 2020, 5), "-01-01")),
               labels = date_format("%Y")) +
  xlab("") + ylab("Interest Rates")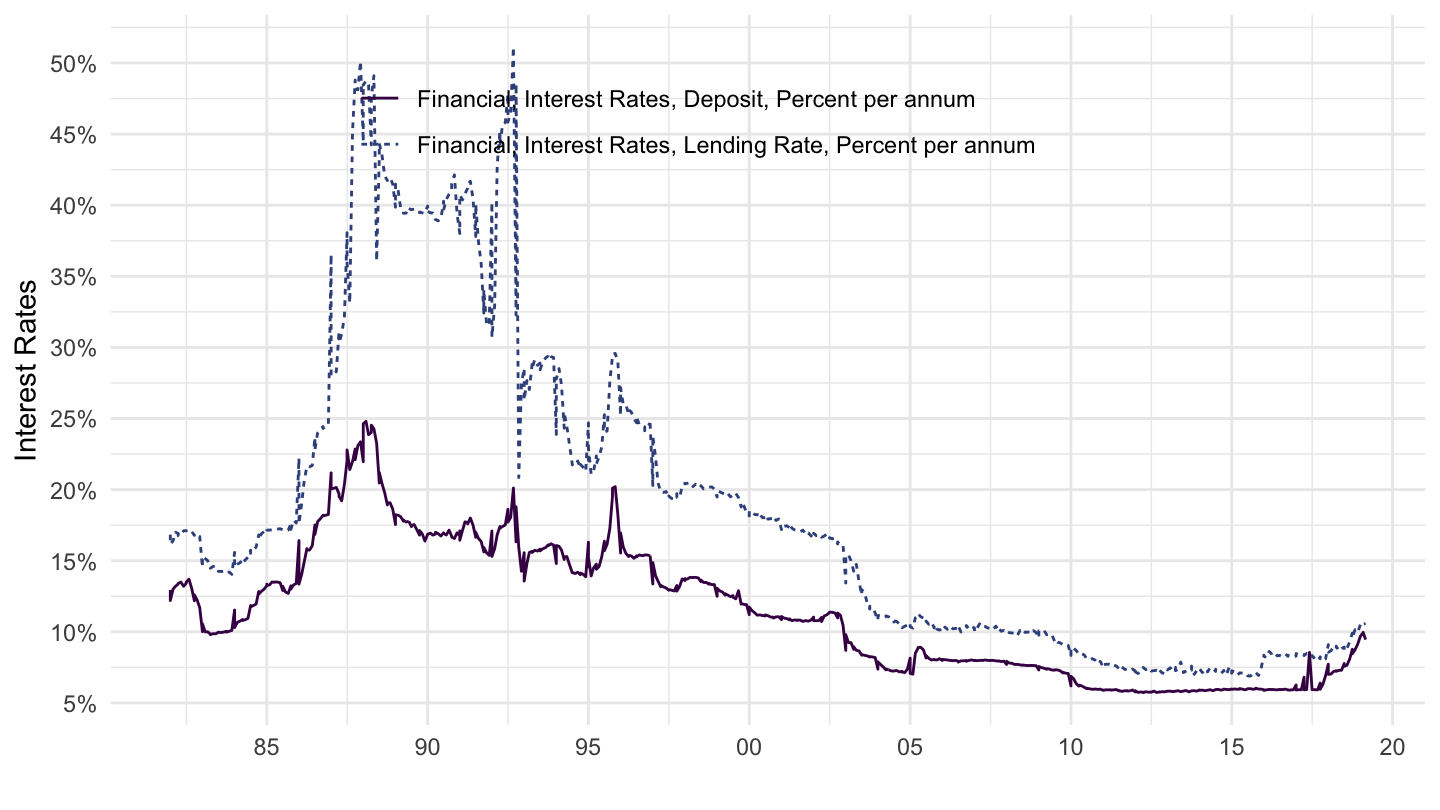
IFS |>
  filter(iso2c == "GR",
         INDICATOR %in% c("FIDR_PA", "FILR_PA", "FIMM_PA", "FIGB_PA")) |>
  left_join(INDICATOR, by = "INDICATOR") |>
  ggplot() + theme_minimal() +
  geom_line(aes(x = date, y = value / 100, color = Indicator, linetype = Indicator)) +
  scale_y_continuous(breaks = 0.01*seq(0, 300, 5),
                     labels = scales::percent_format(accuracy = 1)) +
  scale_color_manual(values = viridis(5)[1:4]) +
  theme(legend.position = c(0.45, 0.85),
        legend.title = element_blank()) +
  scale_x_date(breaks = as.Date(paste0(seq(1700, 2020, 5), "-01-01")),
               labels = date_format("%Y")) +
  xlab("") + ylab("Interest Rates")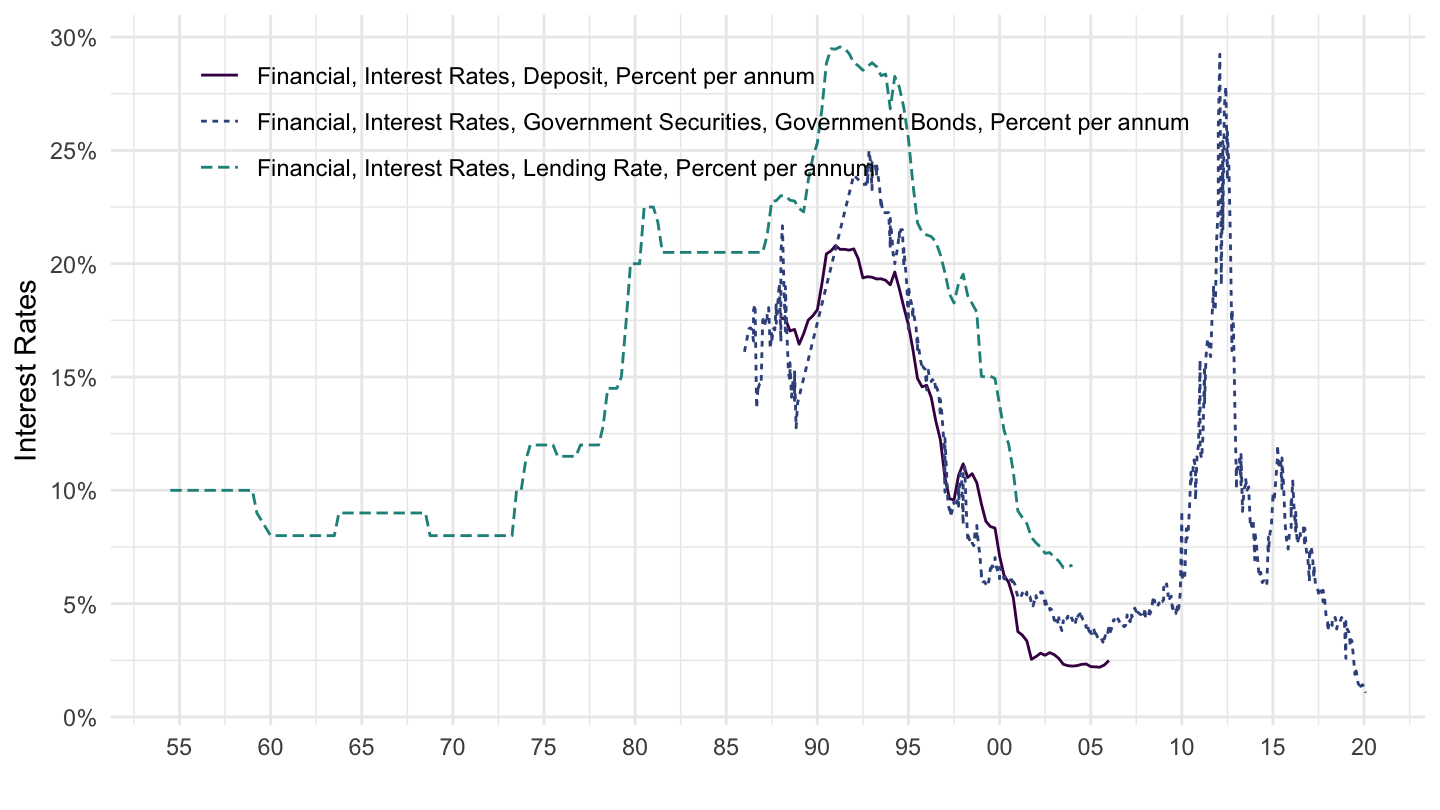
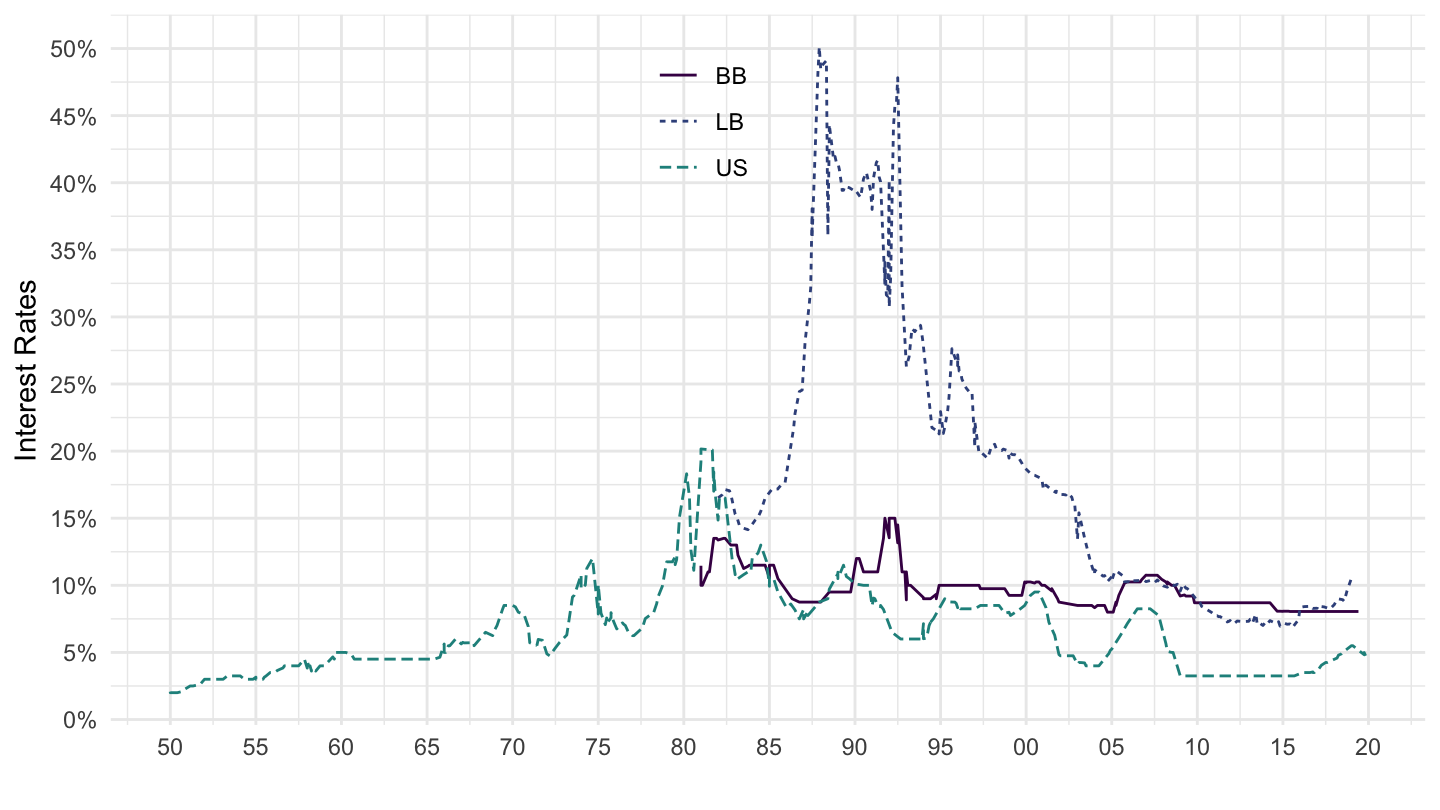
IFS |>
  filter(iso2c == c("LB", "US", "BB"),
         INDICATOR %in% c("FILR_PA")) |>
  mutate(value = value / 100) |>
  left_join(CL_AREA_IFS, by = c("iso2c" = "AREA")) |>
  add_flag_color("AREA_desc") |>
  ggplot() + theme_minimal() + scale_color_identity() + add_flags +
  geom_line(aes(x = date, y = value, color = color)) +
  scale_y_continuous(breaks = 0.01*seq(0, 300, 5),
                     labels = scales::percent_format(accuracy = 1)) +
  theme(legend.position = c(0.45, 0.85),
        legend.title = element_blank()) +
  scale_x_date(breaks = as.Date(paste0(seq(1700, 2020, 5), "-01-01")),
               labels = date_format("%Y")) +
  xlab("") + ylab("Interest Rates")