treasury %>%
left_join(treasury_info %>%
select(Ticker, Country), by = "Ticker") %>%
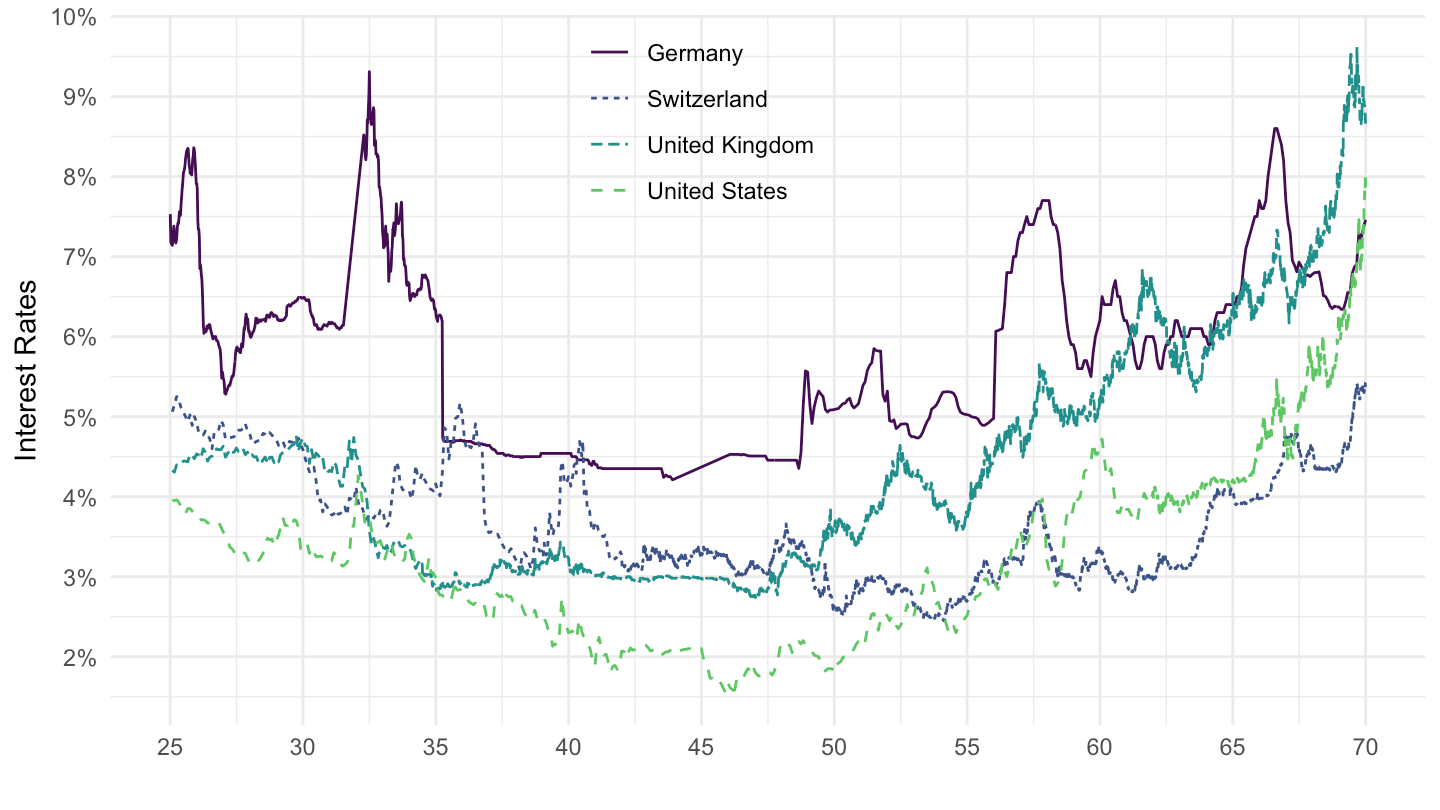
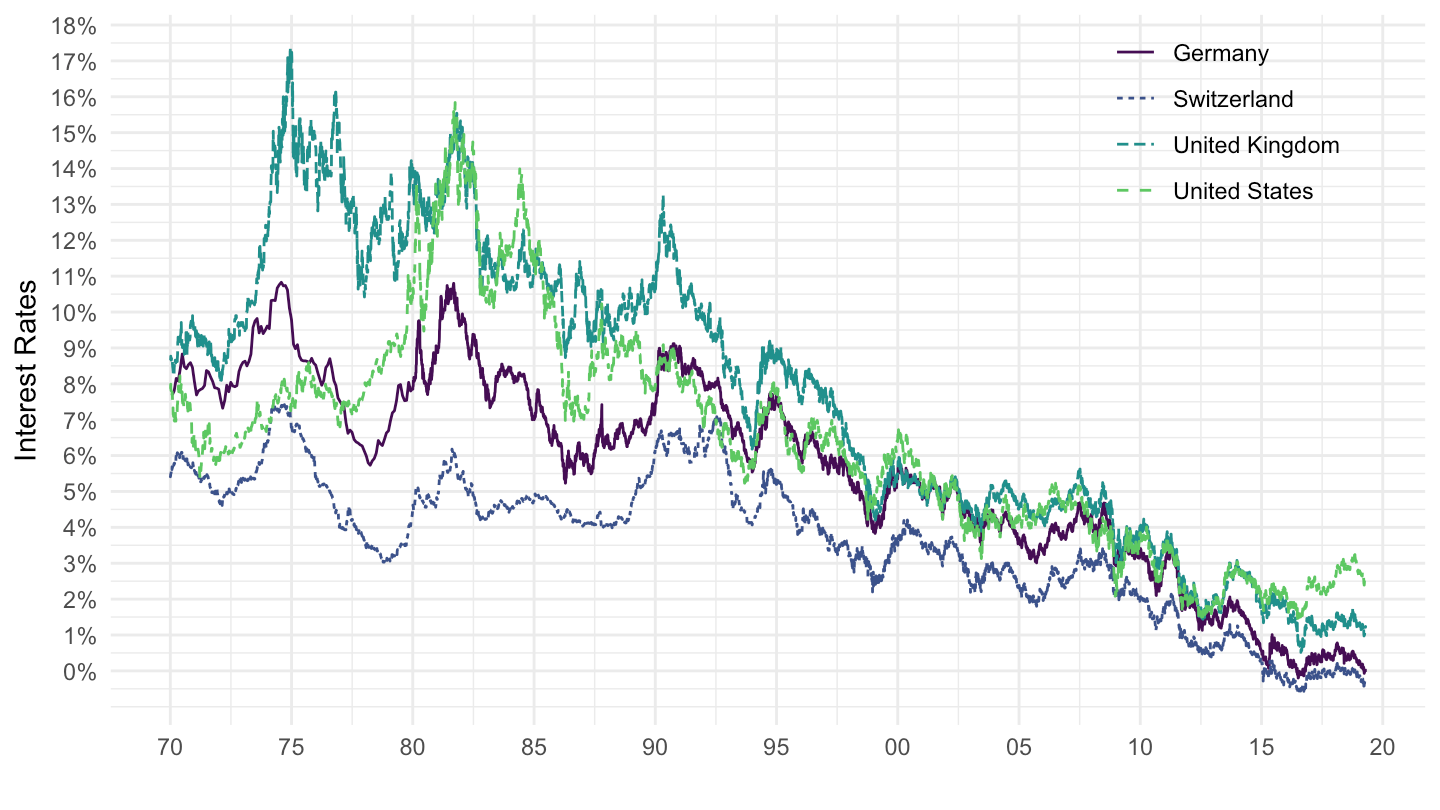
filter(Ticker %in% c("IGGBR10D", "IGUSA10D", "IGCHE10D", "IGDEU10D"),
date >= as.Date("1925-01-01"),
date <= as.Date("1970-01-01")) %>%
group_by(Ticker) %>%
ggplot(.) + theme_minimal() +
geom_line(aes(x = date, y = value / 100, color = Country, linetype = Country)) +
scale_y_continuous(breaks = 0.01*seq(0, 300, 1),
labels = scales::percent_format(accuracy = 1)) +
scale_color_manual(values = viridis(5)[1:4]) +
theme(legend.position = c(0.45, 0.85),
legend.title = element_blank()) +
scale_x_date(breaks = as.Date(paste0(seq(1700, 2020, 5), "-01-01")),
labels = date_format("%y")) +
xlab("") + ylab("Interest Rates")