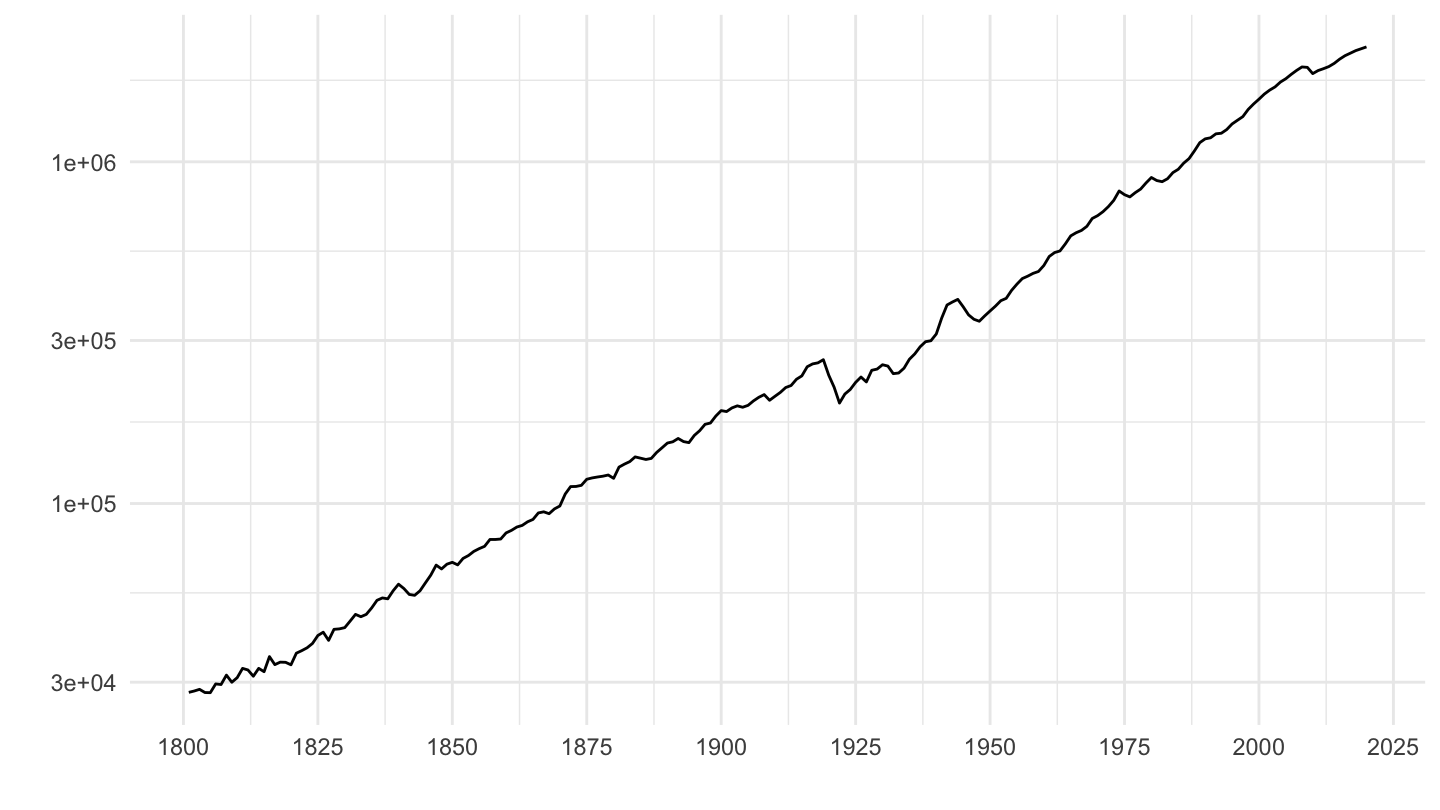
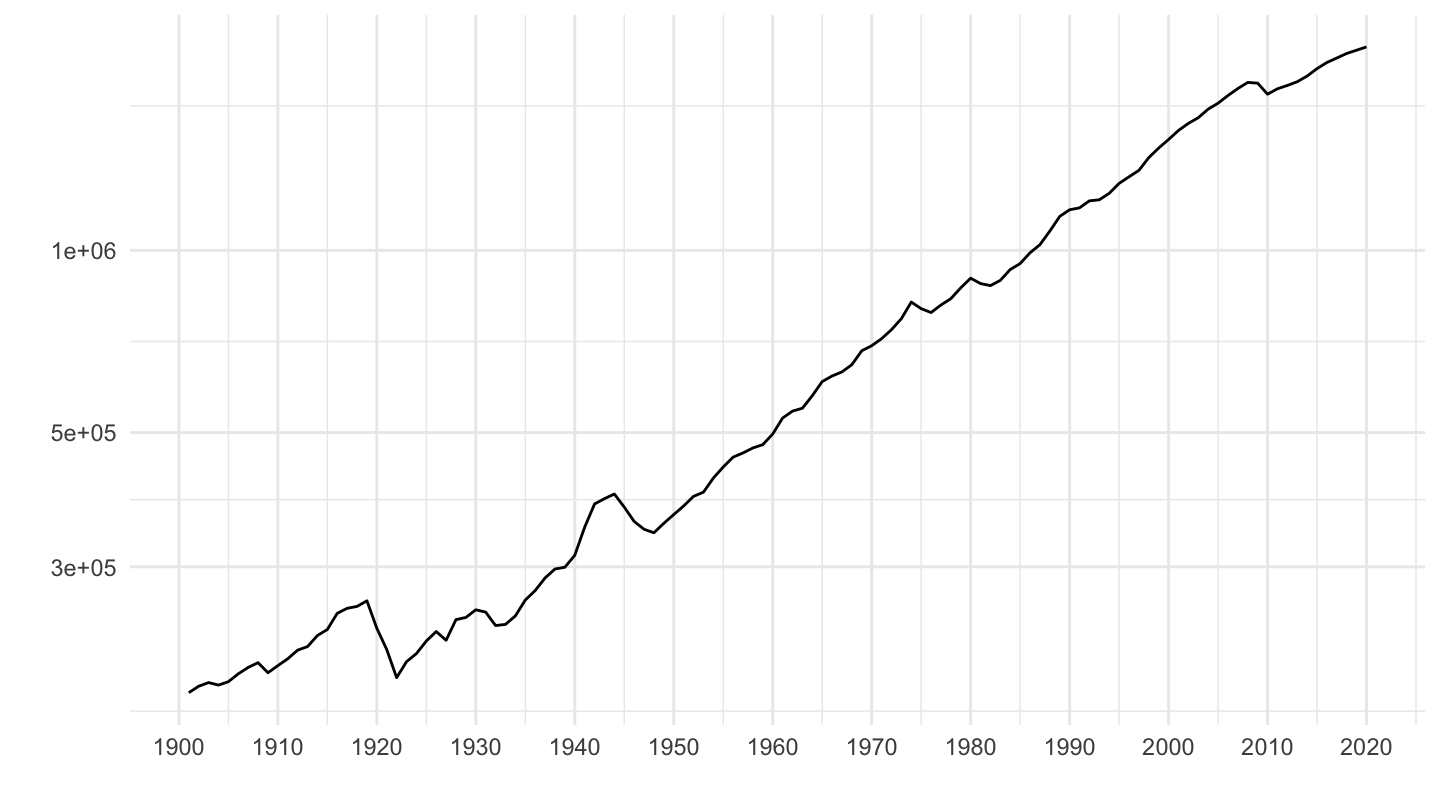
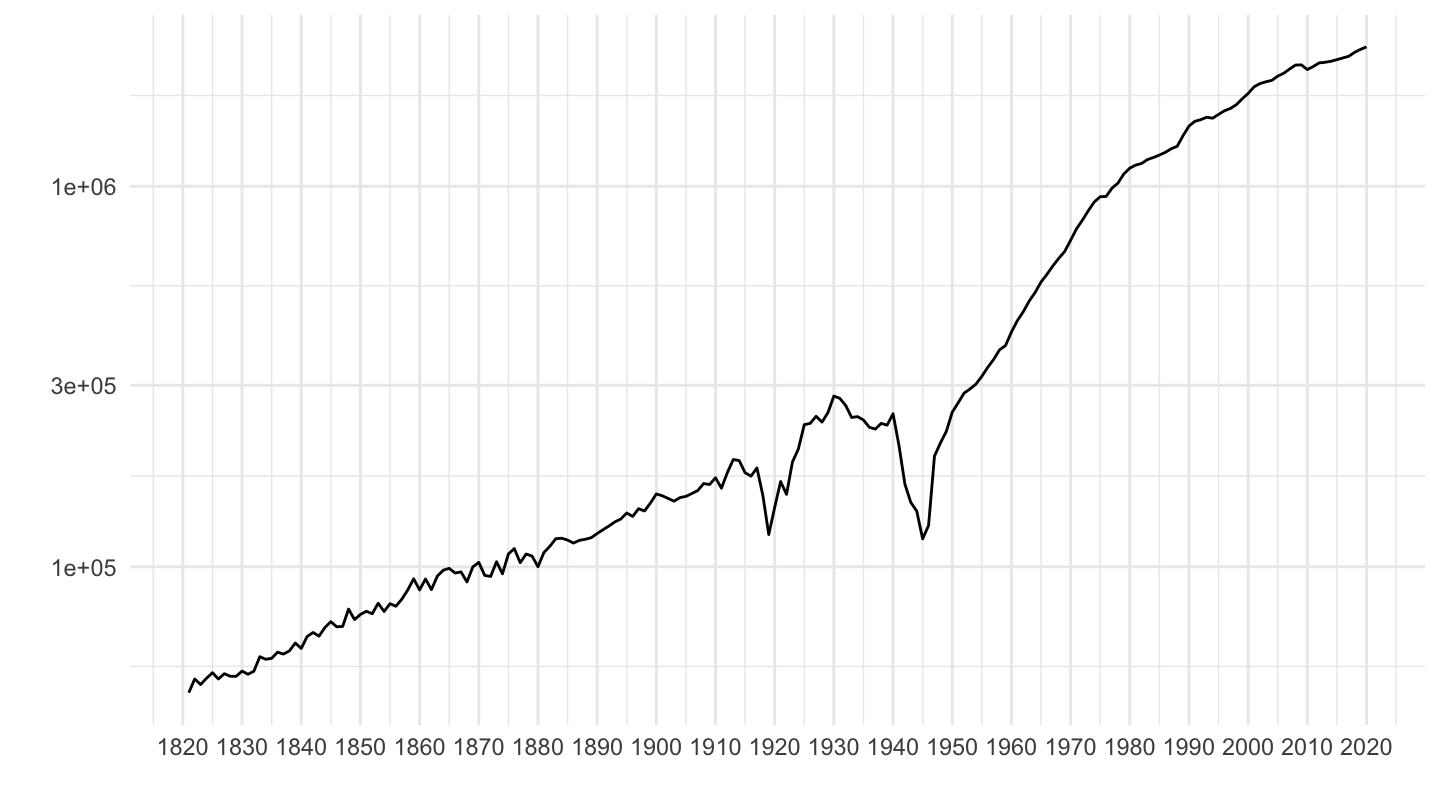
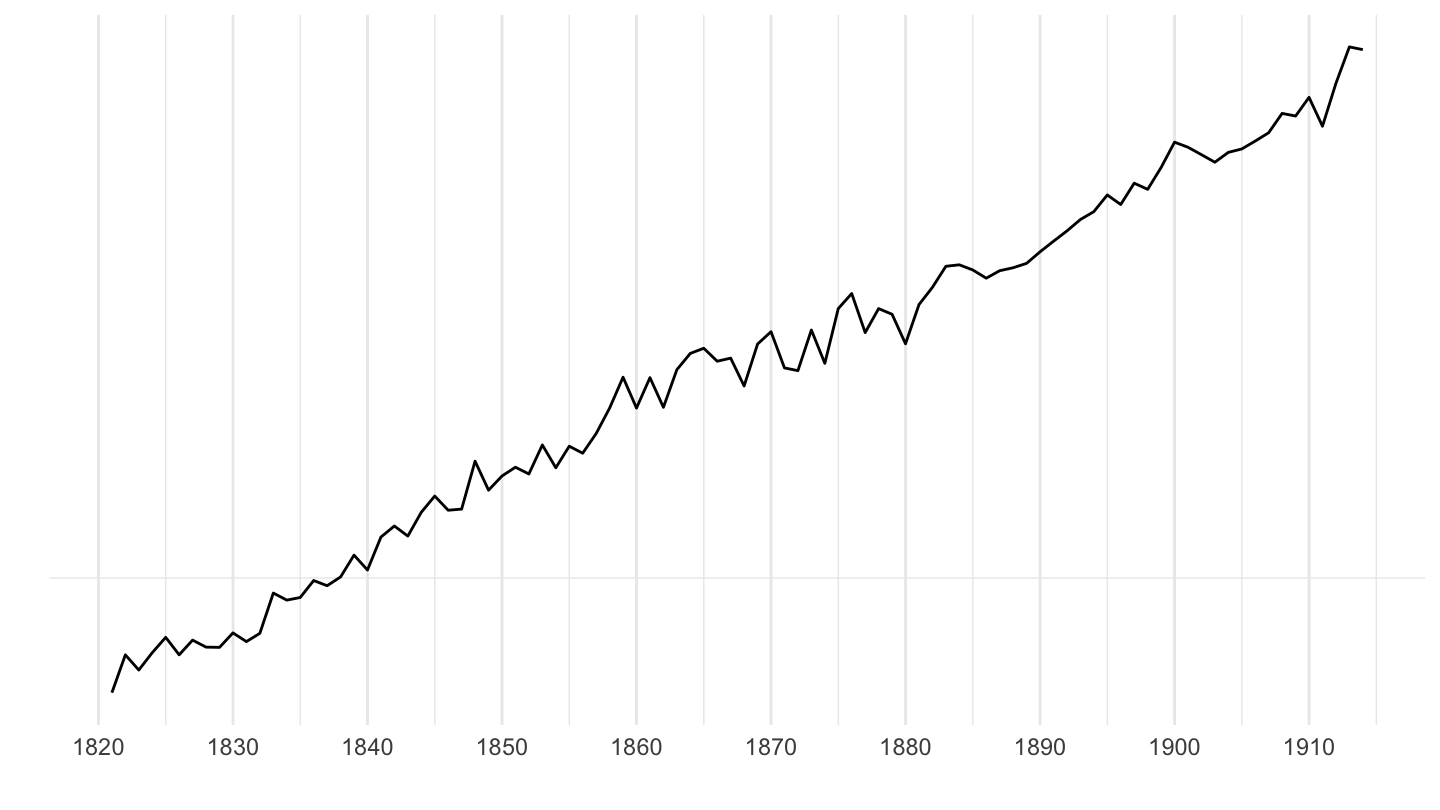
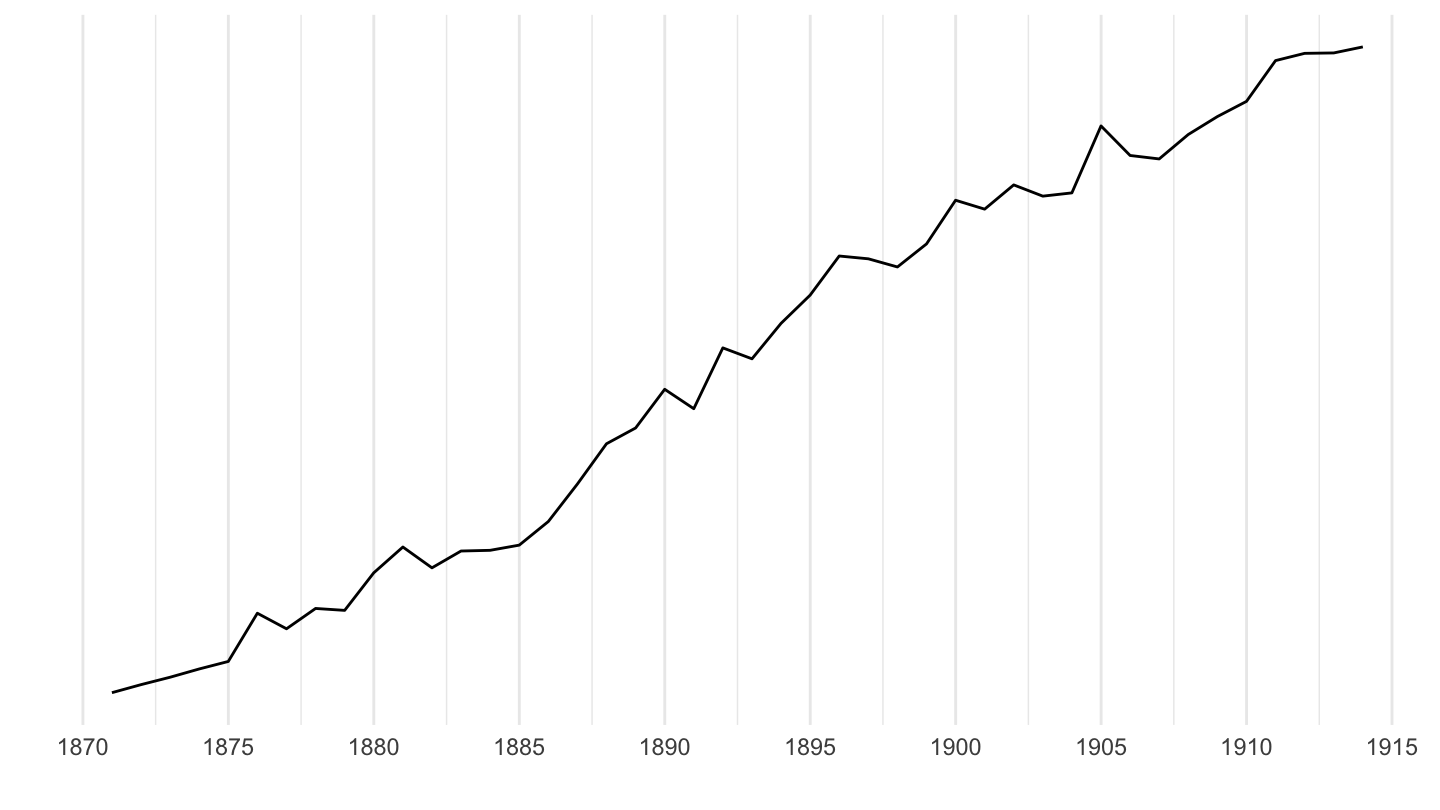
gdpc_info %>%
select(Ticker, Name, Country) %>%
right_join(gdpc %>%
group_by(Ticker) %>%
summarise(Nobs = n(),
start = first(year(date)),
end = last(year(date))), by = "Ticker") %>%
arrange(-Nobs) %>%
mutate(Flag = gsub(" ", "-", str_to_lower(Country)),
Flag = paste0('<img src="../../icon/flag/vsmall/', Flag, '.png" alt="Flag">')) %>%
select(Flag, everything()) %>%
{if (is_html_output()) datatable(., filter = 'top', rownames = F, escape = F) else .}
gdpc %>%
filter(iso3c %in% c("ARG"),
month(date) == 12,
variable == "GDPC",
date >= as.Date("1800-01-01"),
date <= as.Date("1960-01-01")) %>%
select(iso3c, variable, date, value) %>%
ggplot() + geom_line(aes(x = date, y = value)) +
scale_color_manual(values = viridis(4)[1:3]) +
theme_minimal() + xlab("") + ylab("") +
scale_x_date(breaks = seq(1800, 2025, 5) %>% paste0("-01-01") %>% as.Date,
labels = date_format("%Y")) +
theme(legend.position = c(0.25, 0.2),
legend.title = element_blank()) +
scale_y_log10()
gdpc %>%
filter(iso3c %in% c("ARG"),
month(date) == 12,
variable == "GDPC",
date >= as.Date("1800-01-01")) %>%
select(iso3c, variable, date, value) %>%
ggplot() + geom_line(aes(x = date, y = value)) +
scale_color_manual(values = viridis(4)[1:3]) +
theme_minimal() + xlab("") + ylab("") +
scale_x_date(breaks = seq(1800, 2025, 10) %>% paste0("-01-01") %>% as.Date,
labels = date_format("%y")) +
theme(legend.position = c(0.25, 0.2),
legend.title = element_blank()) +
scale_y_log10()
gdpc %>%
filter(iso3c %in% c("BRA"),
month(date) == 12,
variable == "GDPC",
date >= as.Date("1940-01-01"),
date <= as.Date("1980-01-01")) %>%
ggplot() + geom_line(aes(x = date, y = value)) +
theme_minimal() + xlab("") + ylab("") +
scale_x_date(breaks = seq(1800, 2025, 5) %>% paste0("-01-01") %>% as.Date,
labels = date_format("%Y")) +
scale_y_log10()
gdpc %>%
filter(iso3c %in% c("USA"),
month(date) == 12,
variable == "GDPC") %>%
select(iso3c, variable, date, value) %>%
ggplot() + geom_line(aes(x = date, y = value)) +
scale_color_manual(values = viridis(4)[1:3]) +
theme_minimal() + xlab("") + ylab("") +
scale_x_date(breaks = seq(1800, 2025, 20) %>% paste0("-01-01") %>% as.Date,
labels = date_format("%y")) +
theme(legend.position = c(0.25, 0.2),
legend.title = element_blank()) +
scale_y_log10()
gdpc %>%
filter(iso3c %in% c("USA"),
month(date) == 12,
variable == "GDPC",
date >= as.Date("1800-01-01"),
date <= as.Date("1914-01-01")) %>%
select(iso3c, variable, date, value) %>%
ggplot() + geom_line(aes(x = date, y = value)) +
scale_color_manual(values = viridis(4)[1:3]) +
theme_minimal() + xlab("") + ylab("") +
scale_x_date(breaks = seq(1800, 2025, 10) %>% paste0("-01-01") %>% as.Date,
labels = date_format("%Y")) +
theme(legend.position = c(0.25, 0.2),
legend.title = element_blank()) +
scale_y_log10()
gdpc %>%
filter(iso3c %in% c("USA"),
month(date) == 12,
variable == "GDPC",
date >= as.Date("1800-01-01")) %>%
select(iso3c, variable, date, value) %>%
ggplot() + geom_line(aes(x = date, y = value)) +
scale_color_manual(values = viridis(4)[1:3]) +
theme_minimal() + xlab("") + ylab("") +
scale_x_date(breaks = seq(1800, 2025, 10) %>% paste0("-01-01") %>% as.Date,
labels = date_format("%y")) +
theme(legend.position = c(0.25, 0.2),
legend.title = element_blank()) +
scale_y_log10()
gdpc %>%
filter(iso3c %in% c("GBR"),
month(date) == 12,
variable == "GDPC") %>%
select(iso3c, variable, date, value) %>%
ggplot() + geom_line(aes(x = date, y = value)) +
scale_color_manual(values = viridis(4)[1:3]) +
theme_minimal() + xlab("") + ylab("") +
scale_x_date(breaks = seq(1800, 2025, 10) %>% paste0("-01-01") %>% as.Date,
labels = date_format("%Y")) +
theme(legend.position = c(0.25, 0.2),
legend.title = element_blank()) +
scale_y_log10()
gdpc %>%
filter(iso3c %in% c("GBR"),
month(date) == 12,
variable == "GDPC",
date >= as.Date("1800-01-01"),
date <= as.Date("2020-01-01")) %>%
select(iso3c, variable, date, value) %>%
ggplot() + geom_line(aes(x = date, y = value)) +
scale_color_manual(values = viridis(4)[1:3]) +
theme_minimal() + xlab("") + ylab("") +
scale_x_date(breaks = seq(1800, 2025, 25) %>% paste0("-01-01") %>% as.Date,
labels = date_format("%Y")) +
theme(legend.position = c(0.25, 0.2),
legend.title = element_blank()) +
scale_y_log10()
gdpc %>%
filter(iso3c %in% c("GBR"),
month(date) == 12,
variable == "GDPC",
date >= as.Date("1900-01-01"),
date <= as.Date("2020-01-01")) %>%
select(iso3c, variable, date, value) %>%
ggplot() + geom_line(aes(x = date, y = value)) +
scale_color_manual(values = viridis(4)[1:3]) +
theme_minimal() + xlab("") + ylab("") +
scale_x_date(breaks = seq(1800, 2025, 10) %>% paste0("-01-01") %>% as.Date,
labels = date_format("%Y")) +
theme(legend.position = c(0.25, 0.2),
legend.title = element_blank()) +
scale_y_log10()
gdpc %>%
filter(iso3c %in% c("FRA"),
month(date) == 12,
variable == "GDPC") %>%
select(iso3c, variable, date, value) %>%
ggplot() + geom_line(aes(x = date, y = value)) +
scale_color_manual(values = viridis(4)[1:3]) +
theme_minimal() + xlab("") + ylab("") +
scale_x_date(breaks = seq(1800, 2025, 10) %>% paste0("-01-01") %>% as.Date,
labels = date_format("%Y")) +
theme(legend.position = c(0.25, 0.2),
legend.title = element_blank()) +
scale_y_log10()
gdpc %>%
filter(iso3c %in% c("FRA"),
month(date) == 12,
variable == "GDPC",
date >= as.Date("1800-01-01"),
date <= as.Date("1914-01-01")) %>%
select(iso3c, variable, date, value) %>%
ggplot() + geom_line(aes(x = date, y = value)) +
scale_color_manual(values = viridis(4)[1:3]) +
theme_minimal() + xlab("") + ylab("") +
scale_x_date(breaks = seq(1800, 2025, 10) %>% paste0("-01-01") %>% as.Date,
labels = date_format("%Y")) +
theme(legend.position = c(0.25, 0.2),
legend.title = element_blank()) +
scale_y_log10(breaks = 1000*c(1, 2, 3, 5, 8, 10, 20, 30),
labels = dollar_format(suffix = " Bn", p = "", ac = 1))
gdpc %>%
filter(iso3c %in% c("JPN"),
month(date) == 12,
variable == "GDPC",
date >= as.Date("1800-01-01"),
date <= as.Date("1914-01-01")) %>%
select(iso3c, variable, date, value) %>%
ggplot() + geom_line(aes(x = date, y = value)) +
scale_color_manual(values = viridis(4)[1:3]) +
theme_minimal() + xlab("") + ylab("") +
scale_x_date(breaks = seq(1800, 2025, 5) %>% paste0("-01-01") %>% as.Date,
labels = date_format("%Y")) +
theme(legend.position = c(0.25, 0.2),
legend.title = element_blank()) +
scale_y_log10(breaks = 100*c(1, 2, 3, 5, 8, 10, 20, 30, 40, 50),
labels = dollar_format(suffix = " Bn", p = "", ac = 1))