Code
load_data("gfd/cpi_us.RData")
load_data("us/nber_recessions.RData")Data - GFD
load_data("gfd/cpi_us.RData")
load_data("us/nber_recessions.RData")(ref:us-cpi-1920-1980) U.S. Price Level 1920-1980.
cpi_us %>%
  ggplot(.) +
  geom_line(aes(x = date, y = value)) +
  ylab("Price Level (CPI)") + xlab("") +
  geom_rect(data = nber_recessions,
            aes(xmin = Peak, xmax = Trough, ymin = -Inf, ymax = +Inf),
            fill = 'grey', alpha = 0.5) +
  scale_y_continuous(breaks = seq(0, 75, 10),
                     limits = c(0, 75)) +
  scale_x_date(breaks = as.Date(nber_recessions$Peak),
               labels = date_format("%y"),
               limits = c(as.Date("1920-01-01"), as.Date("1980-01-01"))) +
  theme_minimal() +
  geom_vline(xintercept = as.Date("1971-08-15"), linetype = "dashed", color = viridis(3)[2])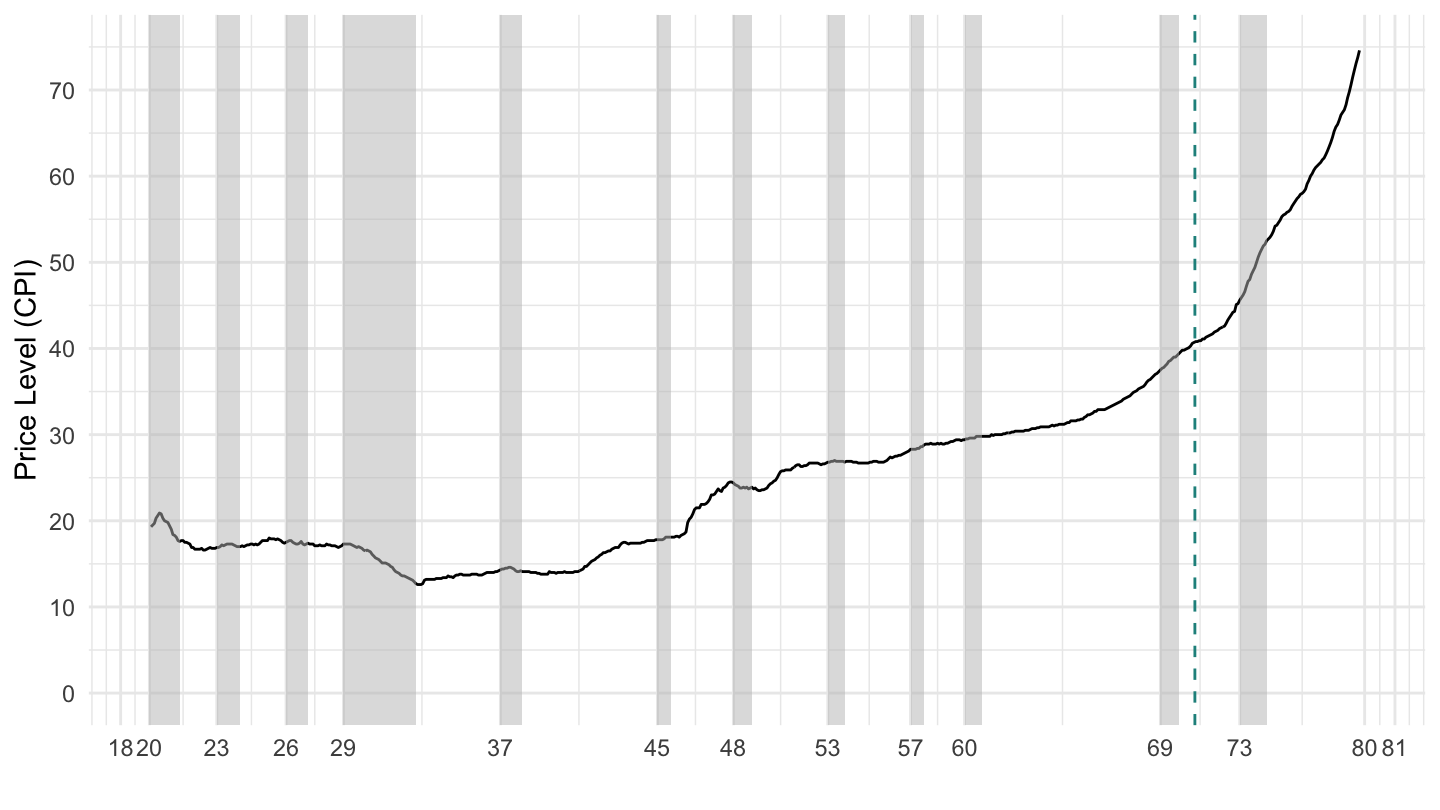
(ref:us-cpi-1920-2019) U.S. Price Level 1920-2019.
cpi_us %>%
  ggplot(.) +
  geom_line(aes(x = date, y = value)) +
  ylab("Price Level") + xlab("") +
  geom_rect(data = nber_recessions,
            aes(xmin = Peak, xmax = Trough, ymin = -Inf, ymax = +Inf),
            fill = 'grey', alpha = 0.5) +
  scale_y_continuous(breaks = seq(0, 250, 25),
                     limits = c(0, 250)) +
  scale_x_date(breaks = as.Date(nber_recessions$Peak),
               labels = date_format("%y"),
               limits = c(as.Date("1920-01-01"), as.Date("2019-01-01"))) +
  theme_minimal() +
  geom_vline(xintercept = as.Date("1971-08-15"), linetype = "dashed", color = viridis(3)[2])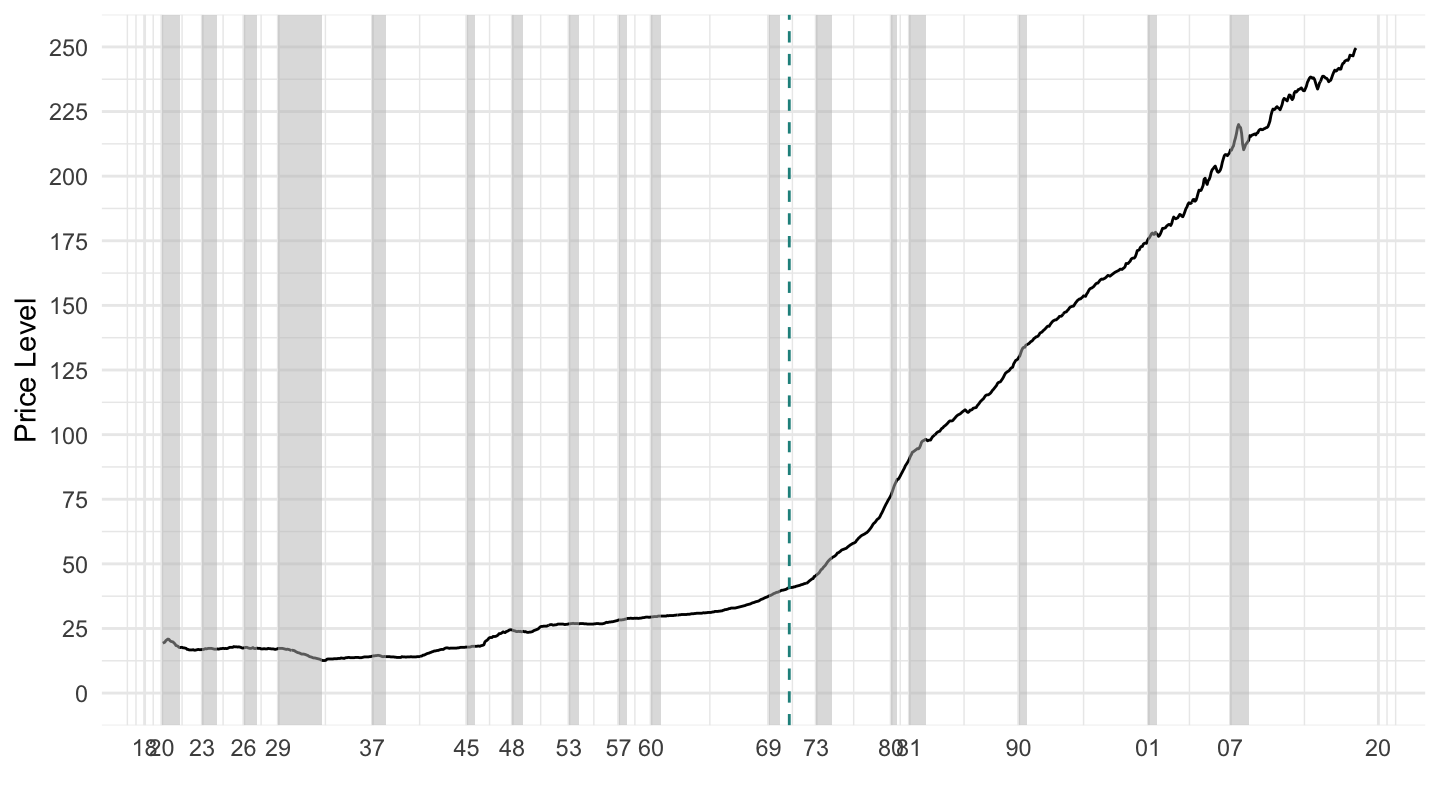
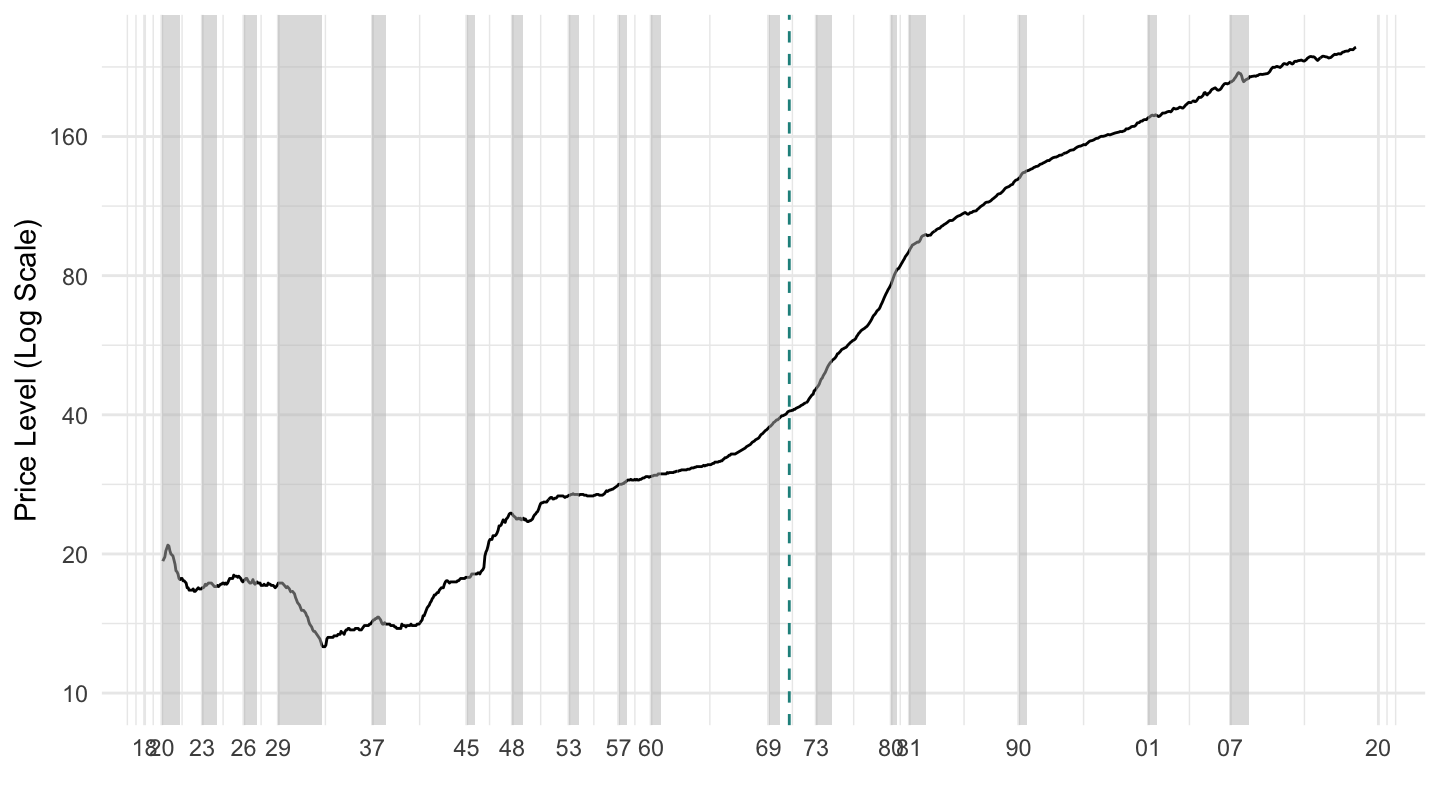
(ref:us-cpi-log-1920-2019) U.S. Price Level 1920-2019 (Log Scale).
cpi_us %>%
  ggplot(.) + geom_line(aes(x = date, y = value)) +
  xlab("") + ylab("Price Level (Log Scale)") +
  geom_rect(data = nber_recessions,
            aes(xmin = Peak, xmax = Trough, ymin = 0, ymax = +Inf),
            fill = 'grey', alpha = 0.5) +
  scale_y_log10(breaks = 20*2^seq(-9, 9, 1),
                limits = c(10, 250)) +
  scale_x_date(breaks = as.Date(nber_recessions$Peak),
               labels = date_format("%y"),
               limits = c(as.Date("1920-01-01"), as.Date("2019-01-01"))) +
  theme_minimal() +
  geom_vline(xintercept = as.Date("1971-08-15"), linetype = "dashed", color = viridis(3)[2])