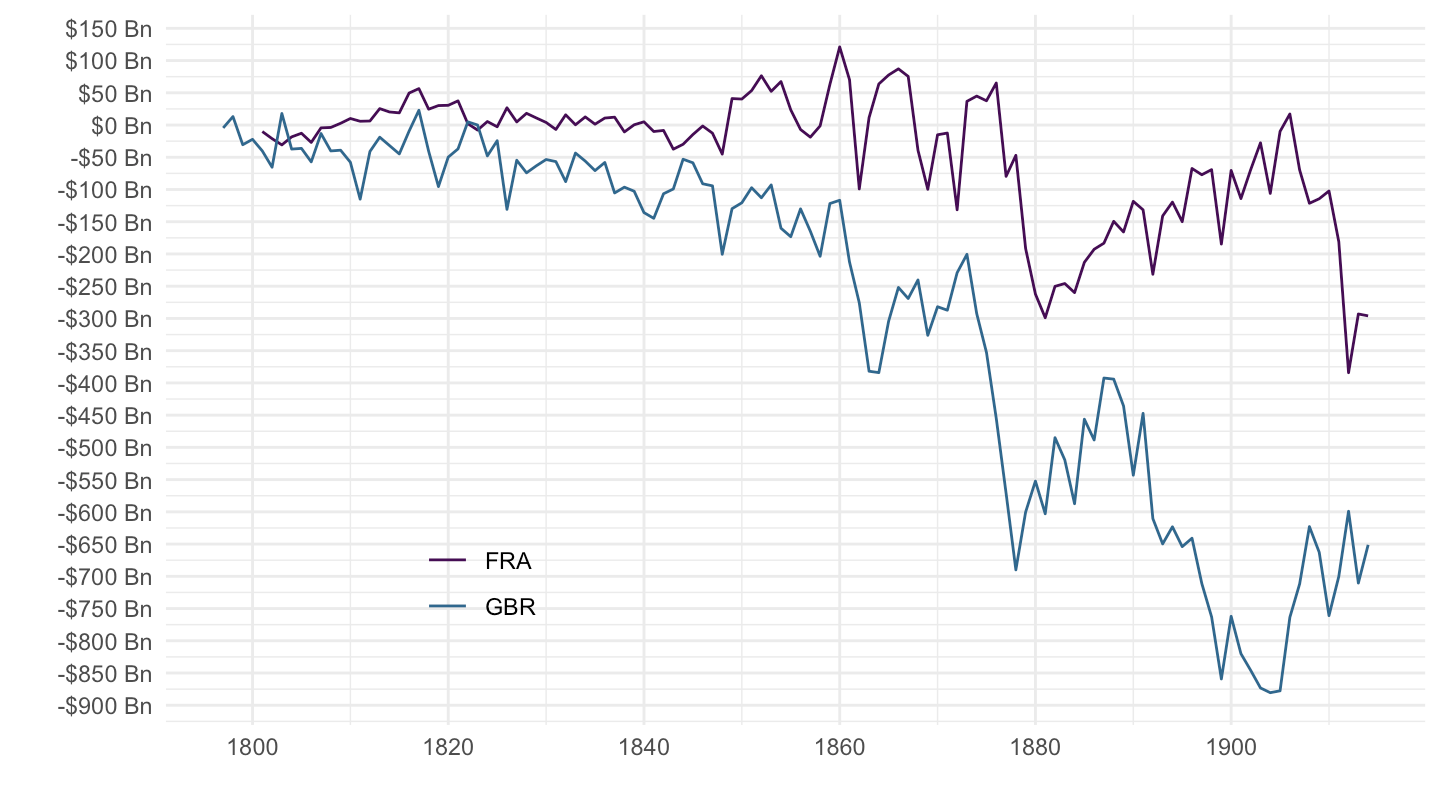
bop %>%
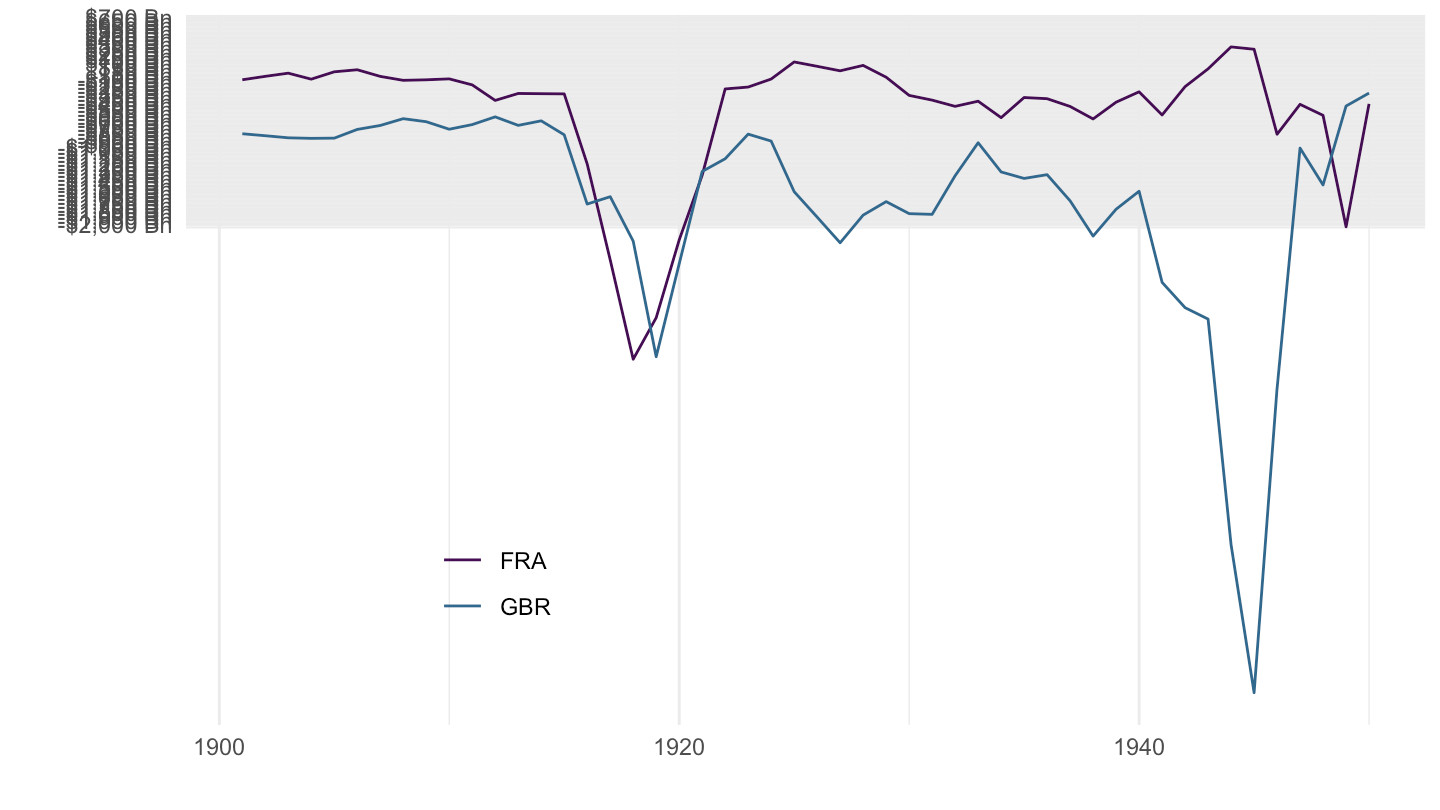
filter(iso3c %in% c("FRA", "GBR", "USA"),
month(date) == 12,
date >= as.Date("1900-01-01"),
date <= as.Date("1950-01-01")) %>%
select(iso3c, variable, date, value) %>%
spread(variable, value) %>%
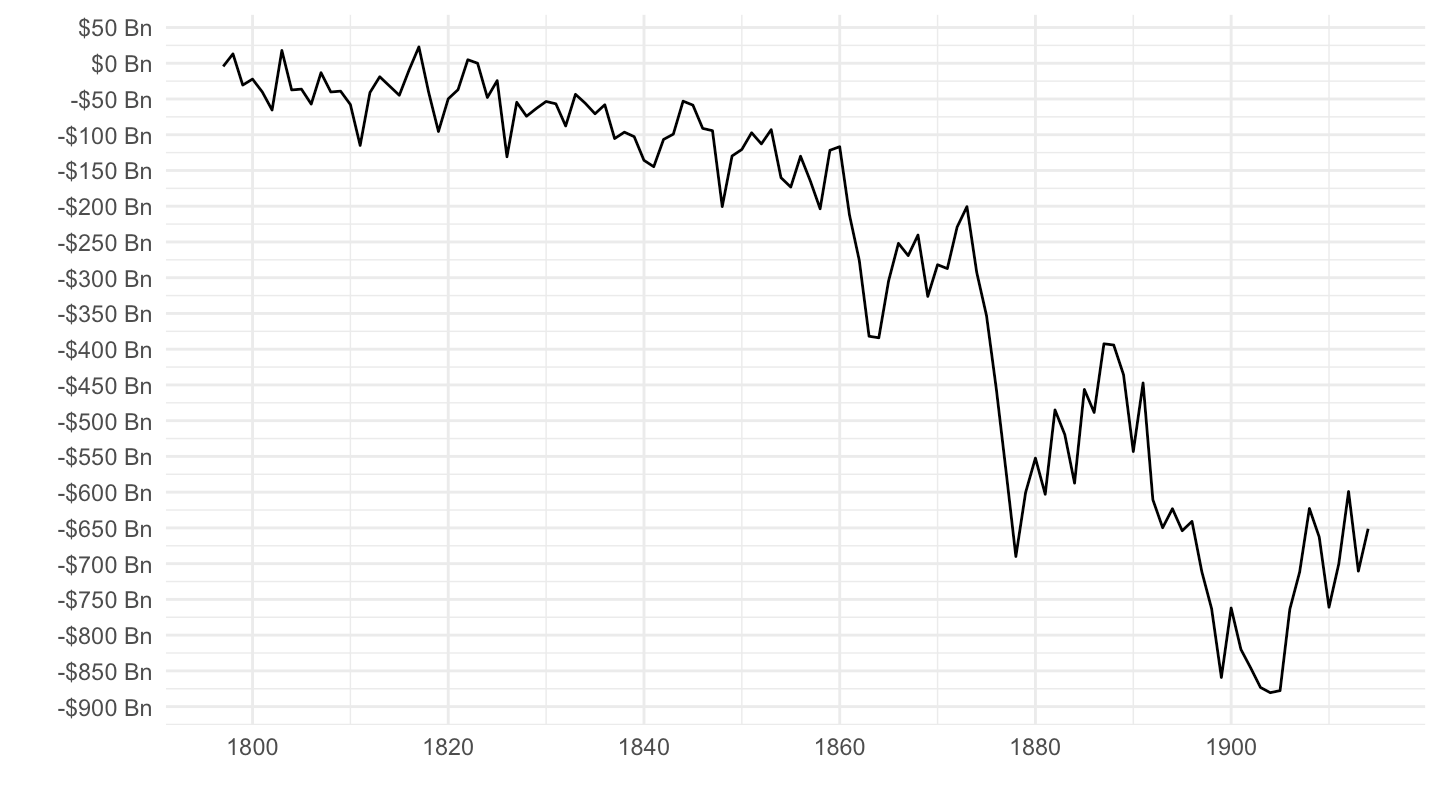
mutate(NX = BXGUA - BMGUA) %>%
ggplot() + geom_line(aes(x = date, y = NX, color = iso3c)) +
scale_color_manual(values = viridis(4)[1:3]) +
theme_minimal() + xlab("") + ylab("") +
scale_x_date(breaks = seq(1800, 2025, 20) %>% paste0("-01-01") %>% as.Date,
labels = date_format("%Y")) +
theme(legend.position = c(0.25, 0.2),
legend.title = element_blank()) +
scale_y_continuous(breaks = seq(-2000, 5000, 50),
labels = dollar_format(suffix = " Bn", accuracy = 1))