Core-Based Statistical Area - CBSA

Data - Freddie

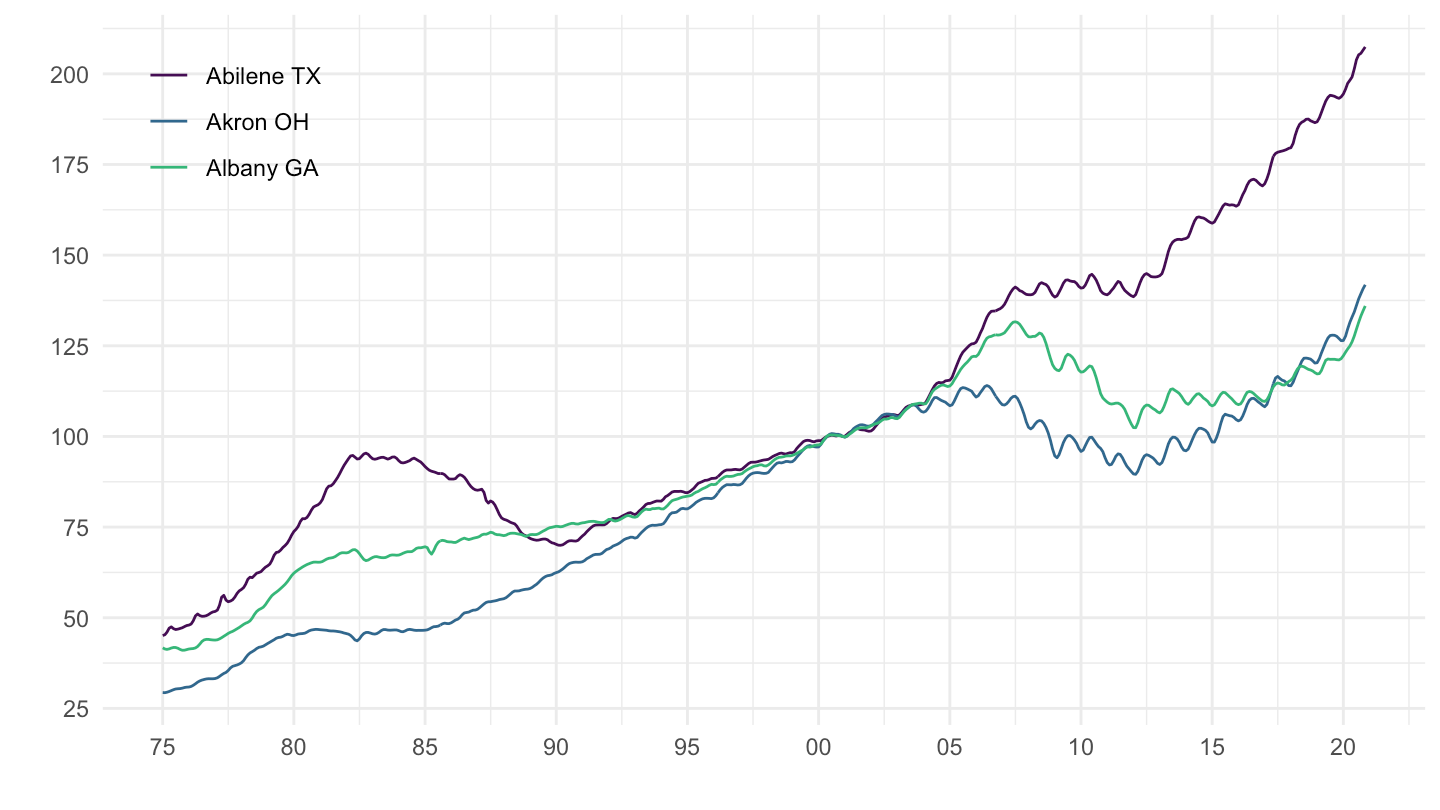
Abilene, Akron

Linear

Code
CBSA %>%
  left_join(geo, by = "geo") %>%
  filter(Geo %in% c("Abilene TX", "Akron OH", "Albany GA"),
         seasonal == F) %>%
  ggplot() + theme_minimal() + xlab("") + ylab("") +
  geom_line(aes(x = date, y = value, color = Geo)) +
  theme(legend.position = c(0.10, 0.85),
        legend.title = element_blank()) + 
  scale_color_manual(values = viridis(4)[1:3]) +
  scale_x_date(breaks = as.Date(paste0(seq(1970, 2025, 5), "-01-01")),
               labels = date_format("%y")) +
  scale_y_continuous(breaks = seq(0, 250, 25))

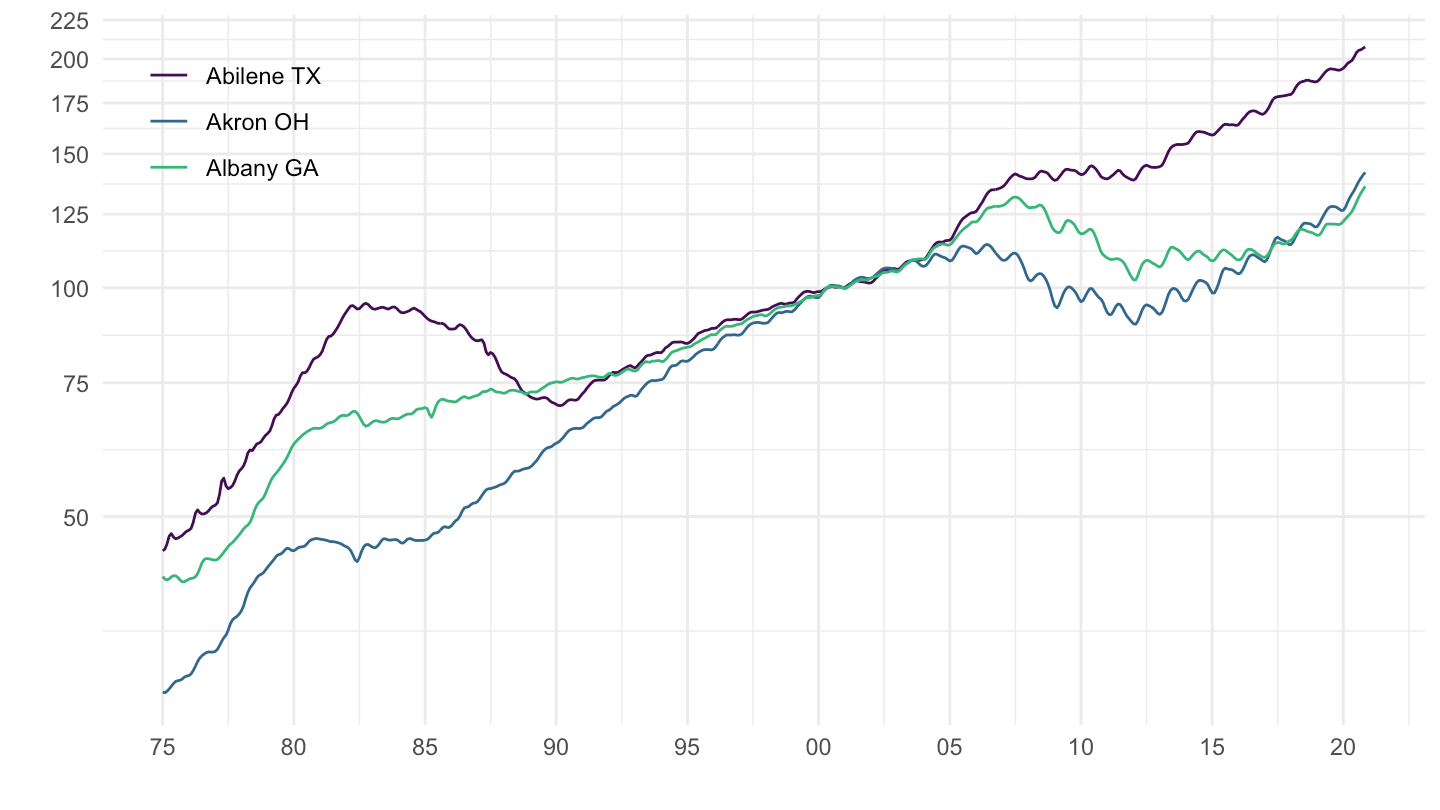
Log

Code
CBSA %>%
  left_join(geo, by = "geo") %>%
  filter(Geo %in% c("Abilene TX", "Akron OH", "Albany GA"),
         seasonal == F) %>%
  ggplot() + theme_minimal() + xlab("") + ylab("") +
  geom_line(aes(x = date, y = value, color = Geo)) +
  theme(legend.position = c(0.10, 0.85),
        legend.title = element_blank()) + 
  scale_color_manual(values = viridis(4)[1:3]) +
  scale_x_date(breaks = as.Date(paste0(seq(1970, 2025, 5), "-01-01")),
               labels = date_format("%y")) +
  scale_y_log10(breaks = seq(0, 250, 25))

1990-1995, 1999-2005, 2006-2009

Table Change

Code
CBSA %>%
  filter(date %in% (c(1990, 1995, 1999, 2005, 2006, 2009) %>% paste0("-01-01") %>% as.Date),
         seasonal == F) %>%
  mutate(group = 1+ floor((1:n()-1)/2)) %>%
  group_by(geo, group) %>%
  arrange(date) %>%
  mutate(HP_d1ln = log(value) - lag(log(value), 1),
         year = year(date),
         minyear = min(year),
         maxyear = max(year),
         period = paste0(minyear, "-", maxyear)) %>%
  filter(!is.na(HP_d1ln)) %>%
  ungroup %>%
  left_join(geo, by = "geo") %>%
  select(period, geo, Geo, HP_d1ln) %>%
  {if (is_html_output()) datatable(., filter = 'top', rownames = F) else .}
Wide

Code
CBSA %>%
  filter(date %in% (c(1990, 1995, 1999, 2005, 2006, 2009) %>% paste0("-01-01") %>% as.Date),
         seasonal == F) %>%
  mutate(group = 1+ floor((1:n()-1)/2)) %>%
  group_by(geo, group) %>%
  arrange(date) %>%
  mutate(HP_d1ln = log(value) - lag(log(value), 1),
         year = year(date),
         minyear = min(year),
         maxyear = max(year),
         period = paste0(minyear, "-", maxyear)) %>%
  filter(!is.na(HP_d1ln)) %>%
  ungroup %>%
  left_join(geo, by = "geo") %>%
  select(period, geo, Geo, HP_d1ln) %>%
  spread(period, HP_d1ln) %>%
  arrange(`2006-2009`) %>%
  {if (is_html_output()) datatable(., filter = 'top', rownames = F) else .}