| LAST_DOWNLOAD |
|---|
| 2026-07-25 |
Wealth - wealth
Data - Fred
Info
LAST_DOWNLOAD
LAST_COMPILE
| LAST_COMPILE |
|---|
| 2026-07-26 |
Last
| date | Nobs |
|---|---|
| 2026-01-01 | 8 |
variable
Code
wealth %>%
  left_join(variable,  by = "variable") %>%
  group_by(variable, Variable) %>%
  summarise(Nobs = n()) %>%
  arrange(-Nobs) %>%
  {if (is_html_output()) datatable(., filter = 'top', rownames = F) else .}
Share of Total Net Worth
Bottom 50%, 50-99%, 90-99th, Top 1%
Code
wealth %>%
  filter(variable %in% c("WFRBSB50215", "WFRBSN09161", "WFRBSN40188", "WFRBST01134")) %>%
  left_join(variable, by = "variable") %>%
  mutate(Variable = gsub("Share of Total Net Worth Held by the ", "", Variable)) %>%
  ggplot(.) + theme_minimal() + xlab("") + ylab("Share of Total Net Worth Held by Group (%)") +
  geom_line(aes(x = date, y = value / 100, color = Variable)) +
  theme(legend.title = element_blank(),
        legend.position = c(0.7, 0.4)) +
  scale_color_manual(values = viridis(5)[1:4]) +
  scale_x_date(breaks = as.Date(paste0(seq(1930, 2022, 2), "-01-01")),
               labels = date_format("%Y")) +
  geom_rect(data = nber_recessions %>%
              filter(Peak > as.Date("1988-01-01")),
            aes(xmin = Peak, xmax = Trough, ymin = -Inf, ymax = +Inf),
            fill = 'grey', alpha = 0.5) +
  scale_y_continuous(breaks = 0.01*seq(0, 50, 5),
                     labels = percent_format(acc = 1))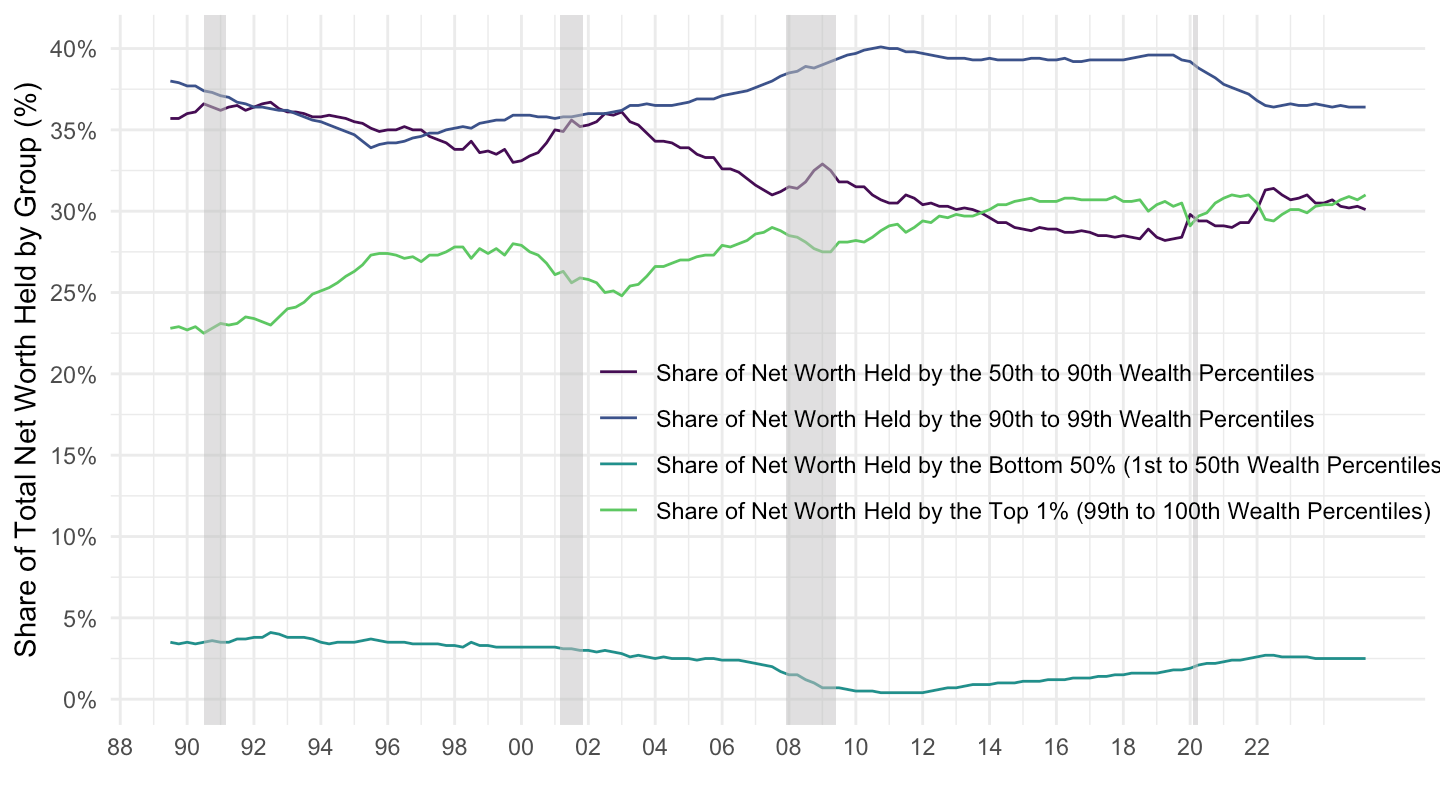
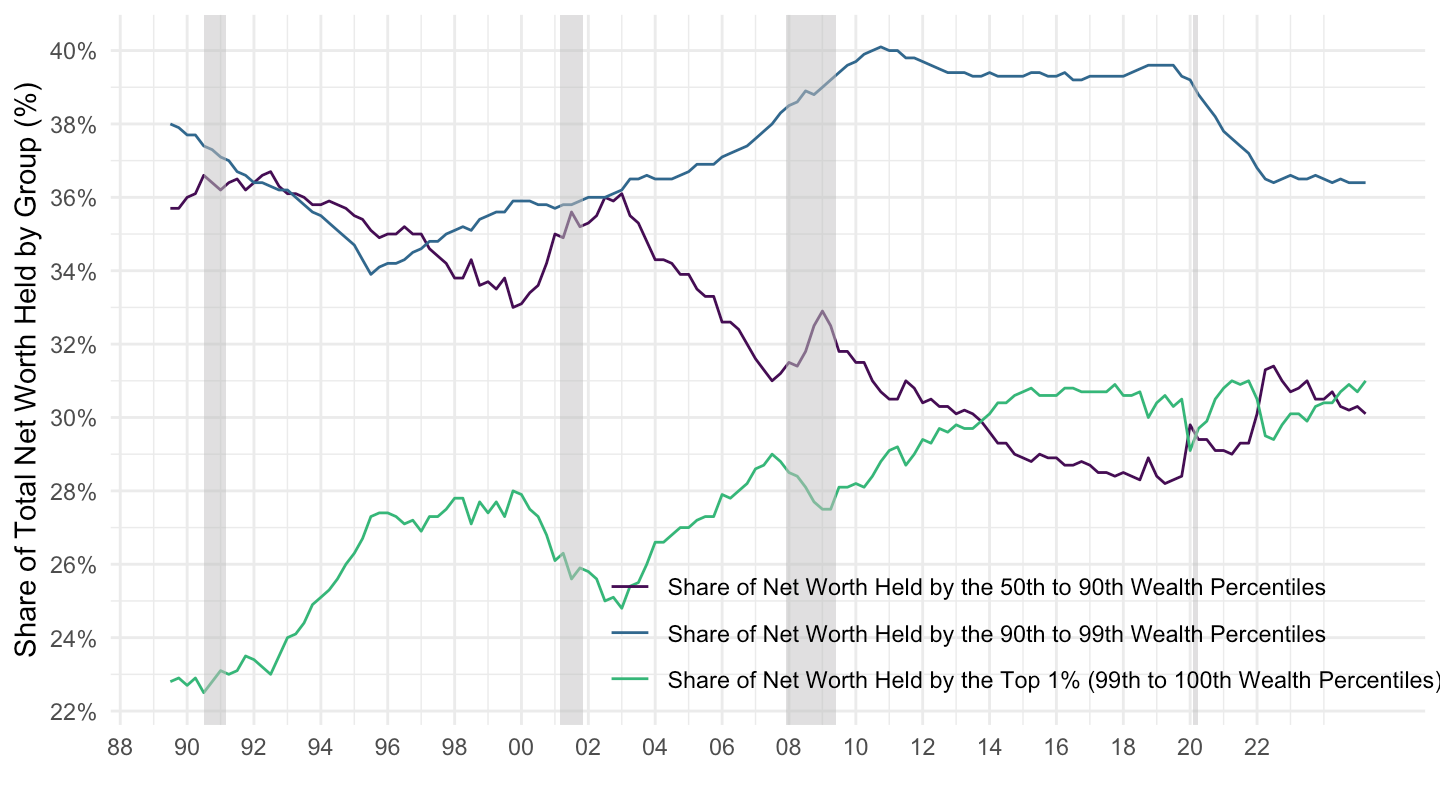
50-99%, 90-99th, Top 1%
Code
wealth %>%
  filter(variable %in% c("WFRBSN09161", "WFRBSN40188", "WFRBST01134")) %>%
  left_join(variable, by = "variable") %>%
  mutate(Variable = gsub("Share of Total Net Worth Held by the ", "", Variable)) %>%
  ggplot(.) + theme_minimal() + xlab("") + ylab("Share of Total Net Worth Held by Group (%)") +
  geom_line(aes(x = date, y = value / 100, color = Variable)) +
  theme(legend.title = element_blank(),
        legend.position = c(0.7, 0.13)) +
  scale_color_manual(values = viridis(4)[1:3]) +
  scale_x_date(breaks = as.Date(paste0(seq(1930, 2022, 2), "-01-01")),
               labels = date_format("%Y")) +
  geom_rect(data = nber_recessions %>%
              filter(Peak > as.Date("1988-01-01")),
            aes(xmin = Peak, xmax = Trough, ymin = -Inf, ymax = +Inf),
            fill = 'grey', alpha = 0.5) +
  scale_y_continuous(breaks = 0.01*seq(0, 50, 2),
                     labels = percent_format(acc = 1))