| LAST_DOWNLOAD |
|---|
| 2026-07-25 |
Minimum wages by state - minimum_wage
Data - Fred
Info
LAST_DOWNLOAD
LAST_COMPILE
| LAST_COMPILE |
|---|
| 2026-07-26 |
Last
| date | Nobs |
|---|---|
| 2026-06-01 | 2 |
variable
Code
minimum_wage %>%
  left_join(variable,  by = "variable") %>%
  group_by(variable, Variable) %>%
  arrange(date) %>%
  summarise(Nobs = n(),
            first = first(date),
            last = last(date)) %>%
  arrange(-Nobs) %>%
  {if (is_html_output()) datatable(., filter = 'top', rownames = F) else .}
State vs Federal Minimum Wages
Map
- Graph. html
Code
ig_b("bls", "minimum-wage-state")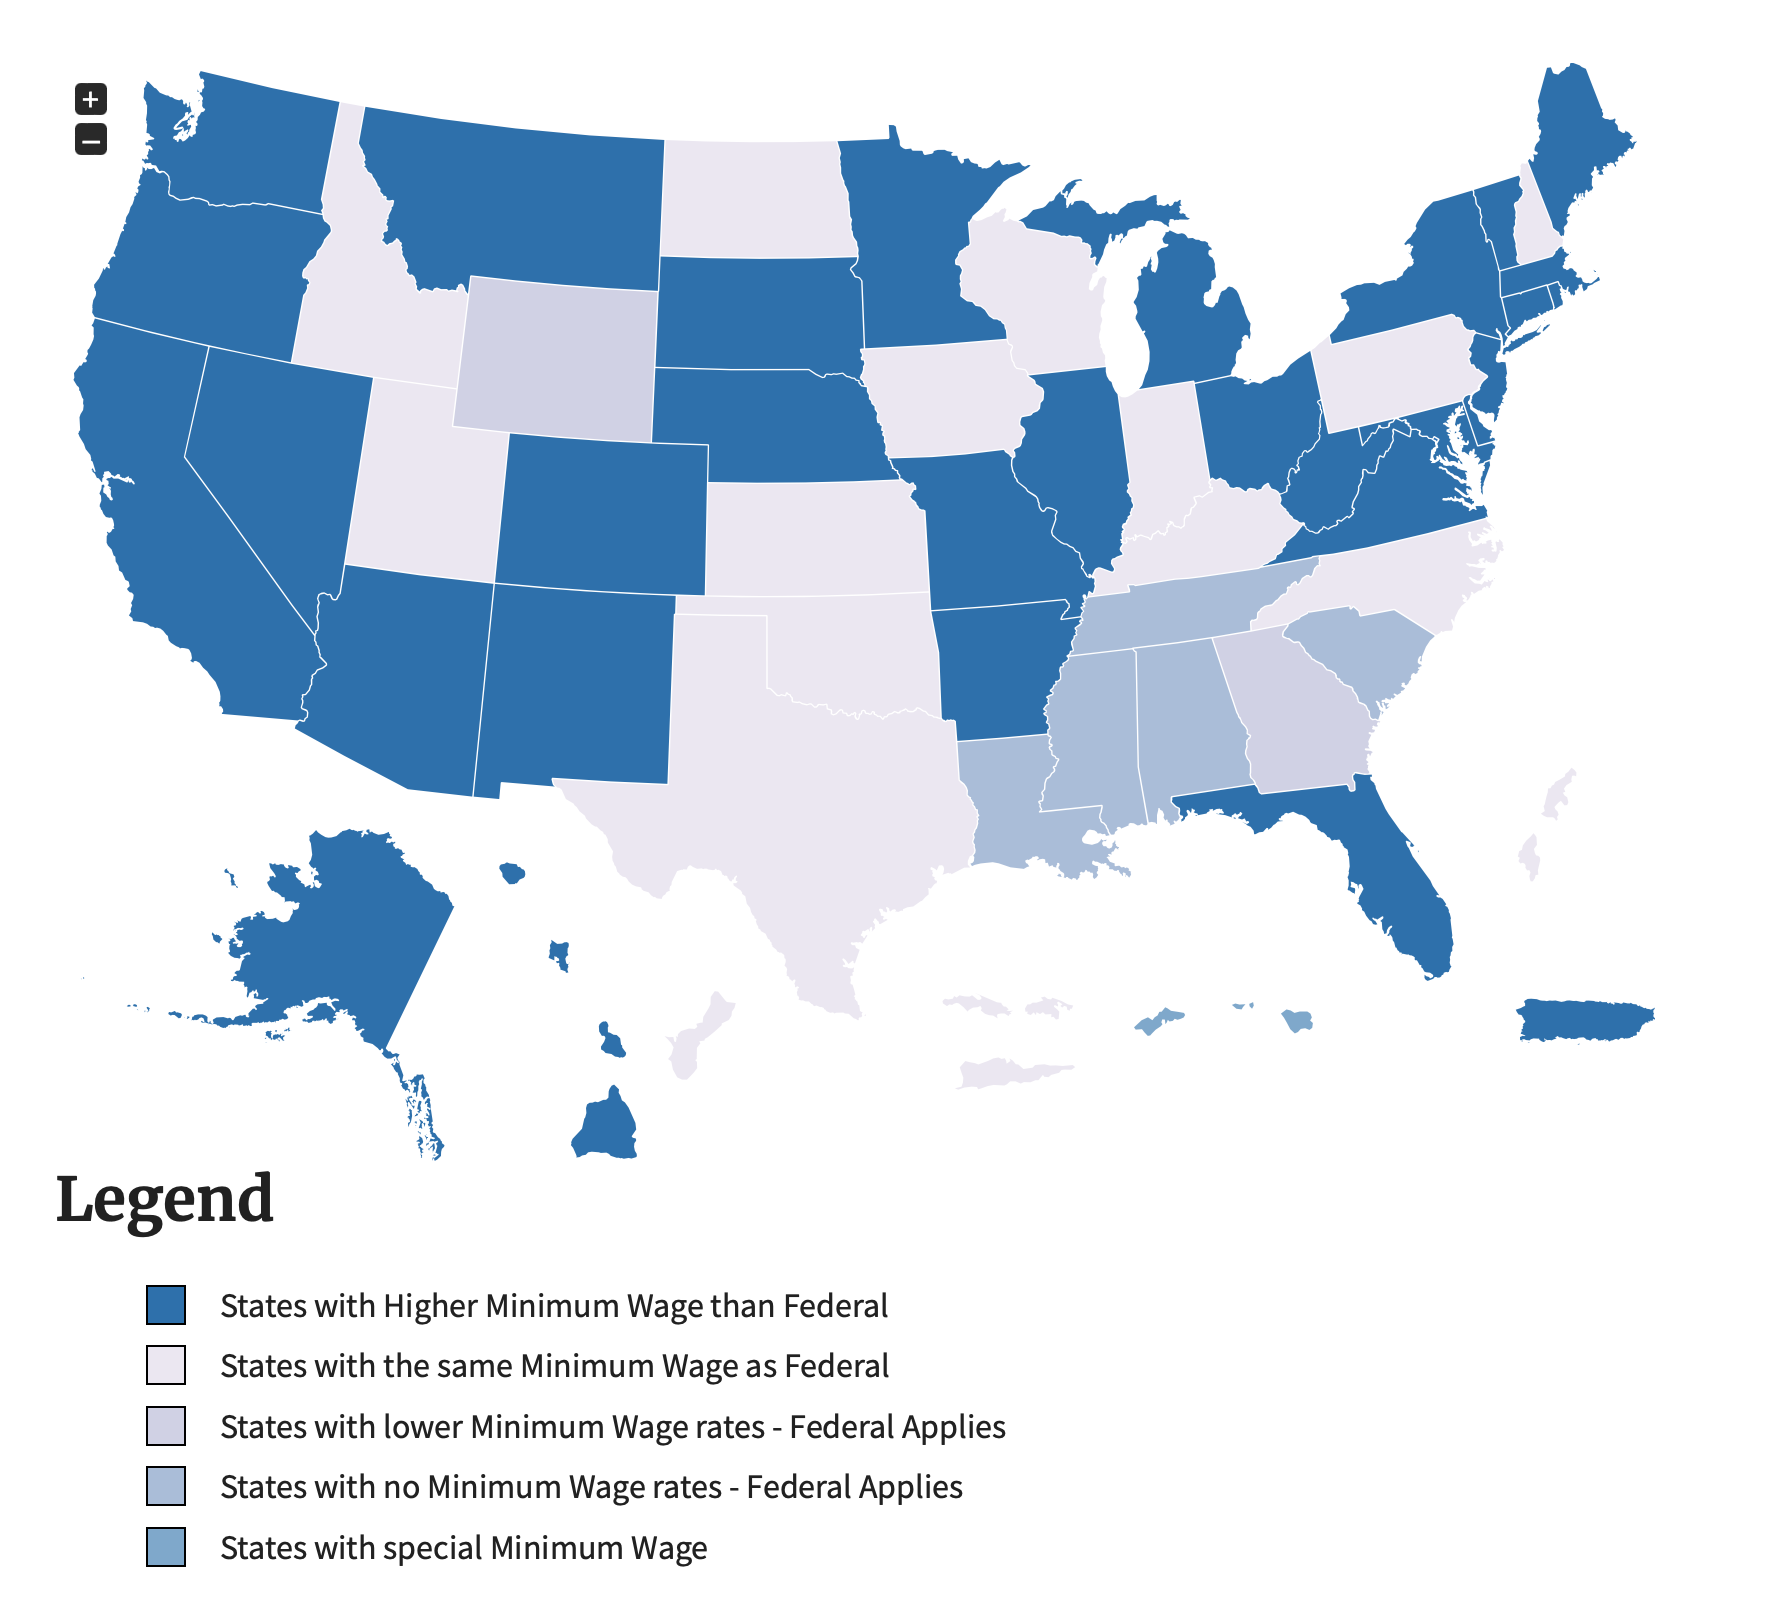
Orders of magnitude
Federal Monthly, 2021 = $1,256.7 per month (173 hours per month ?)
Hours per month: (40 hours per week X 52 weeks per year) / 12 months per year = 173.33 hours per month
Federal minimum wage = $7.25 per hour
State minimum wage (California) = $14 per hour 14*173.33= $2426
California - STTMINWGCA
Index
Code
minimum_wage %>%
  filter(variable == "STTMINWGCA") %>%
  ggplot(.) + geom_line(aes(x = date, y = value)) +
  ylab("Minimum wages") + xlab("") + theme_minimal() +
  scale_y_continuous(breaks = seq(0, 30, 2),
                     labels = dollar_format()) +
  scale_x_date(breaks = as.Date(paste0(seq(1940, 2100, 5), "-01-01")),
               labels = date_format("%Y"))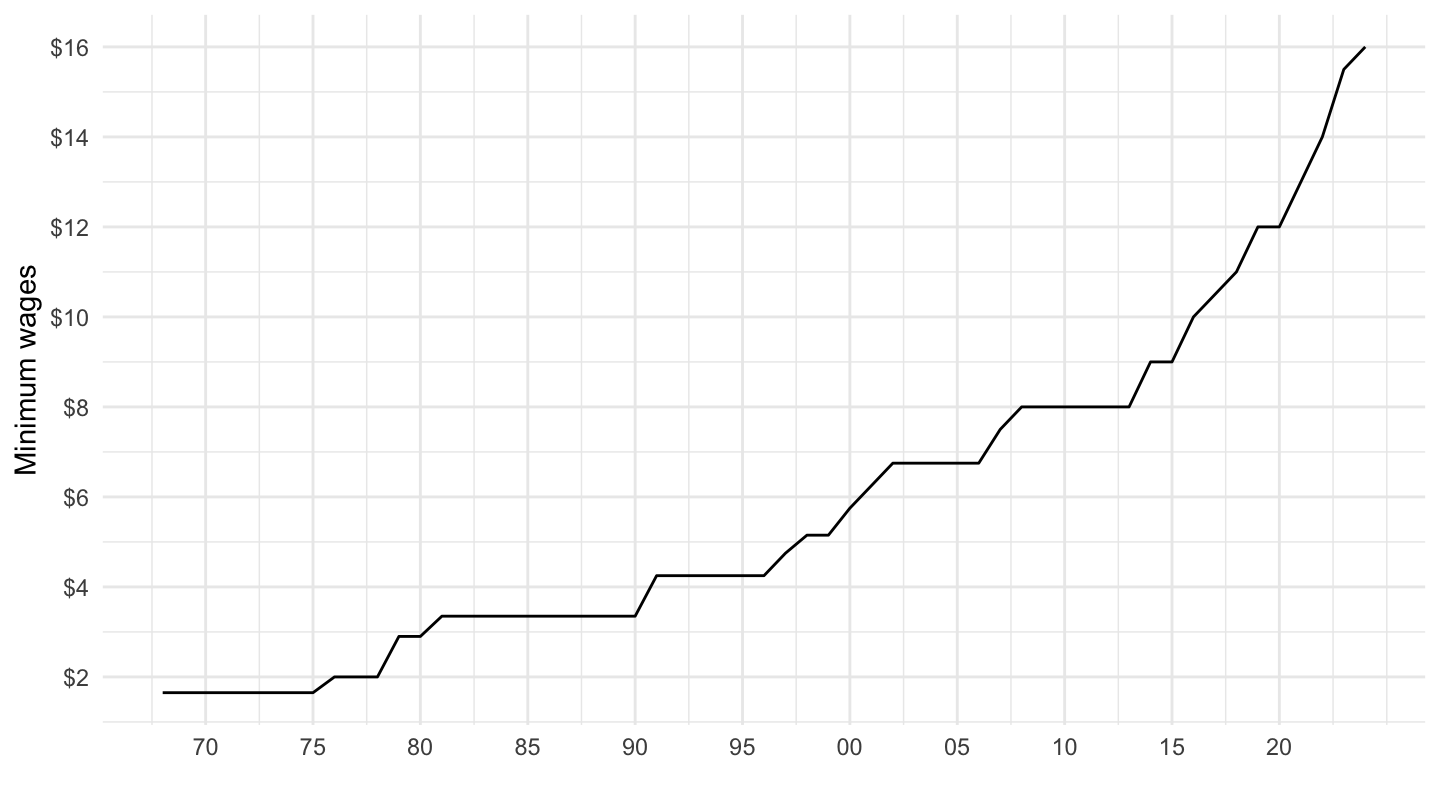
Log
Code
minimum_wage %>%
  filter(variable == "STTMINWGCA") %>%
  ggplot(.) + geom_line(aes(x = date, y = value)) +
  ylab("Minimum wages") + xlab("") + theme_minimal() +
  scale_y_log10(breaks = seq(0, 30, 2),
                     labels = dollar_format(acc = 1)) +
  scale_x_date(breaks = as.Date(paste0(seq(1940, 2100, 5), "-01-01")),
               labels = date_format("%Y"))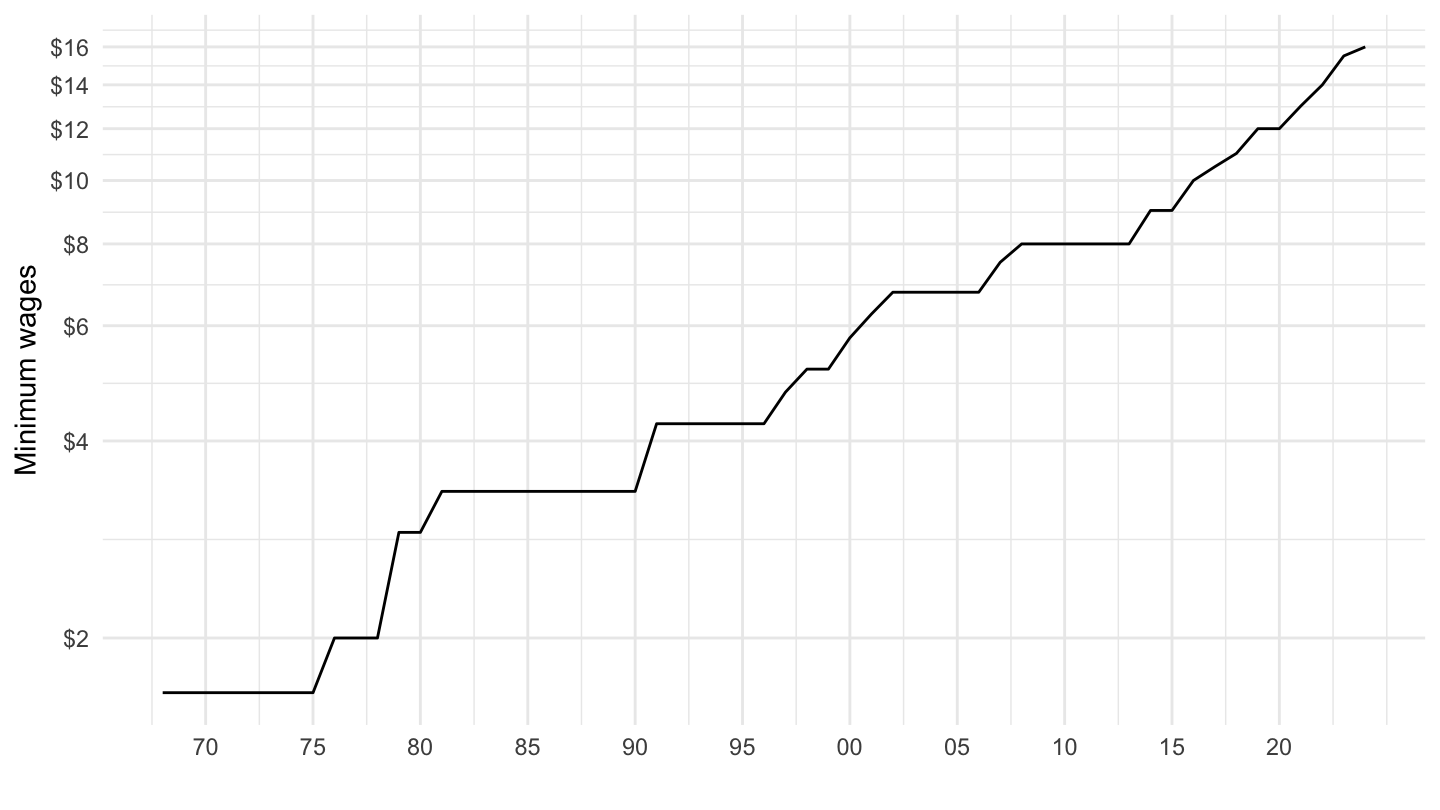
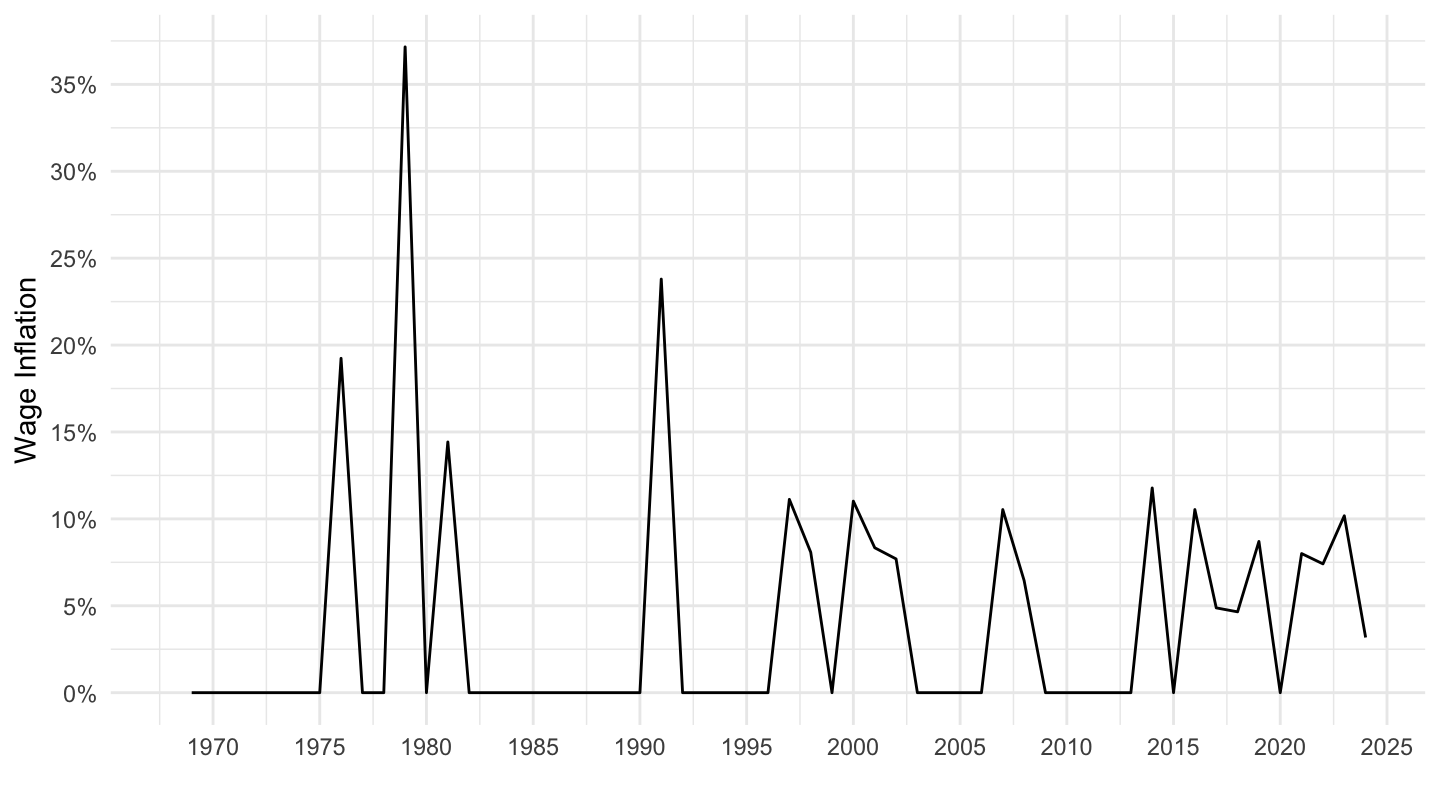
Wage Inflation
Code
minimum_wage %>%
  filter(variable == "STTMINWGCA") %>%
  mutate(year = year(date),
         month = month(date)) %>%
  filter(month == 1) %>%
  mutate(value_log = log(value),
         wage_inflation = value_log - lag(value_log)) %>%
  ggplot(.) + ylab("Wage Inflation") + xlab("") +
  geom_line(aes(x = date, y = wage_inflation)) +
  scale_y_continuous(breaks = seq(-0.2, 0.4, 0.05),
                     labels = percent_format(acc = 1)) +
  scale_x_date(breaks = as.Date(paste0(seq(1940, 2100, 5), "-01-01")),
               labels = date_format("%Y")) +
  theme_minimal()