Code
log %>%
  left_join(variable,  by = "variable") %>%
  group_by(variable, Variable) %>%
  summarise(Nobs = n()) %>%
  arrange(-Nobs) %>%
{if (is_html_output()) datatable(., filter = 'top', rownames = F) else .}Data - Fred
log %>%
left_join(variable, by = "variable") %>%
group_by(variable, Variable) %>%
summarise(Nobs = n()) %>%
arrange(-Nobs) %>%
{if (is_html_output()) datatable(., filter = 'top', rownames = F) else .}plot_linear <- log %>%
filter(date >= as.Date("1996-05-01"),
variable %in% c("HPIPONM226S", "AHETPI")) %>%
left_join(variable, by = "variable") %>%
group_by(Variable) %>%
mutate(value = 100*value/value[1]) %>%
ggplot(.) + theme_minimal() + xlab("") + ylab("") +
geom_line(aes(x = date, y = value, color = Variable)) +
theme(legend.position = c(0.4, 0.90),
legend.title = element_blank()) +
scale_x_date(breaks = seq(1700, 2100, 5) %>% paste0("-01-01") %>% as.Date,
labels = date_format("%Y")) +
scale_y_continuous(breaks = seq(100, 400, 50))
plot_linear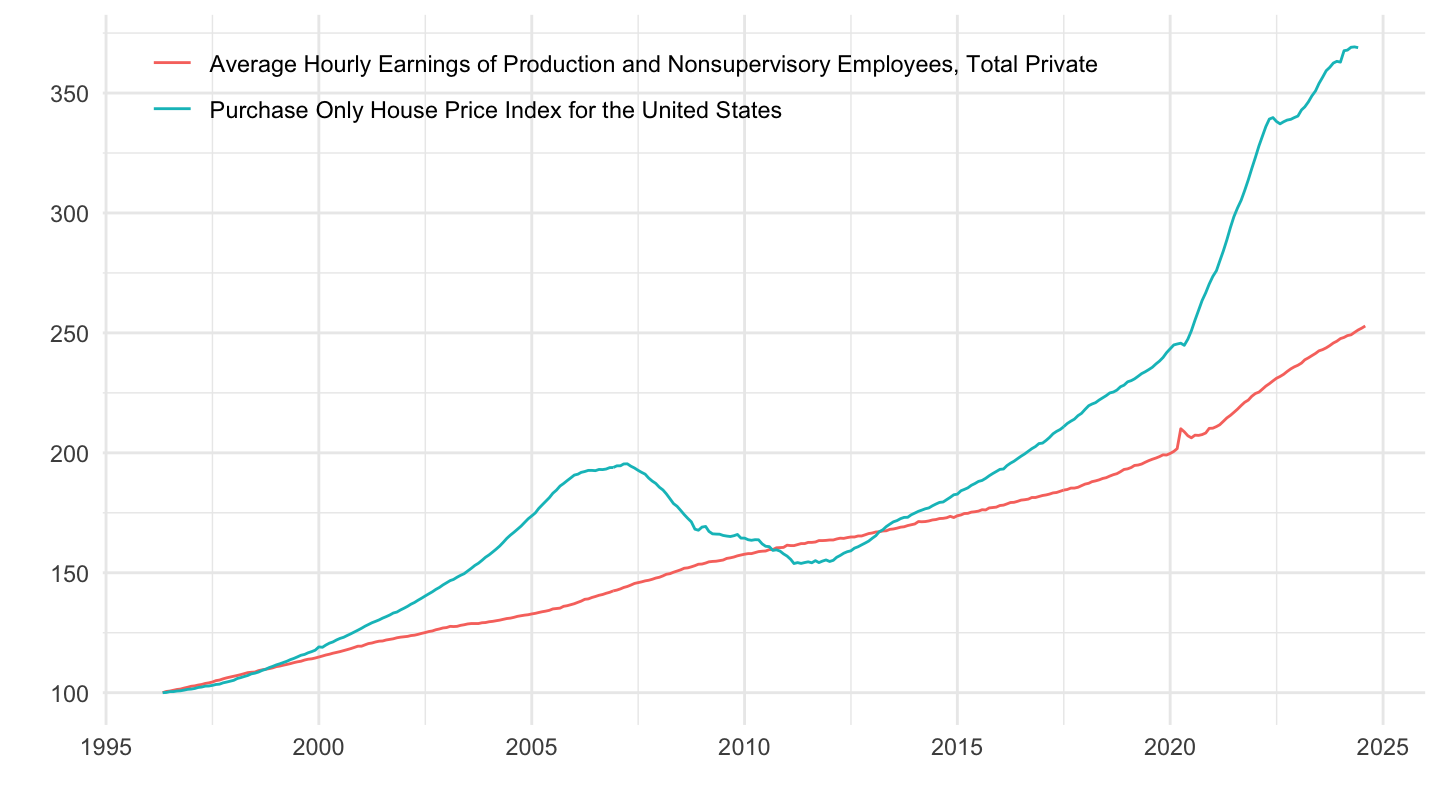
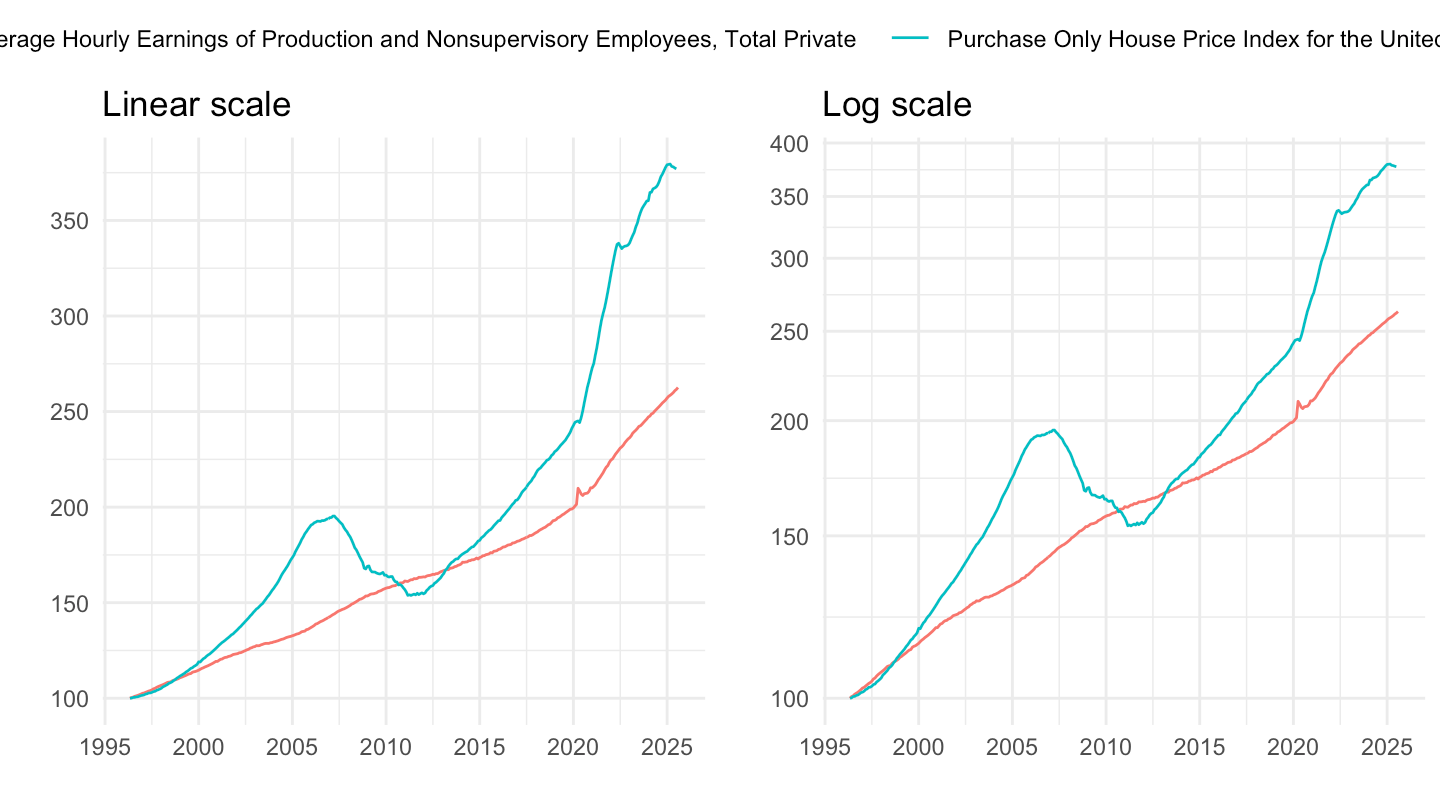
plot_log <- plot_linear +
  scale_y_log10(breaks = seq(100, 400, 50))

plot_log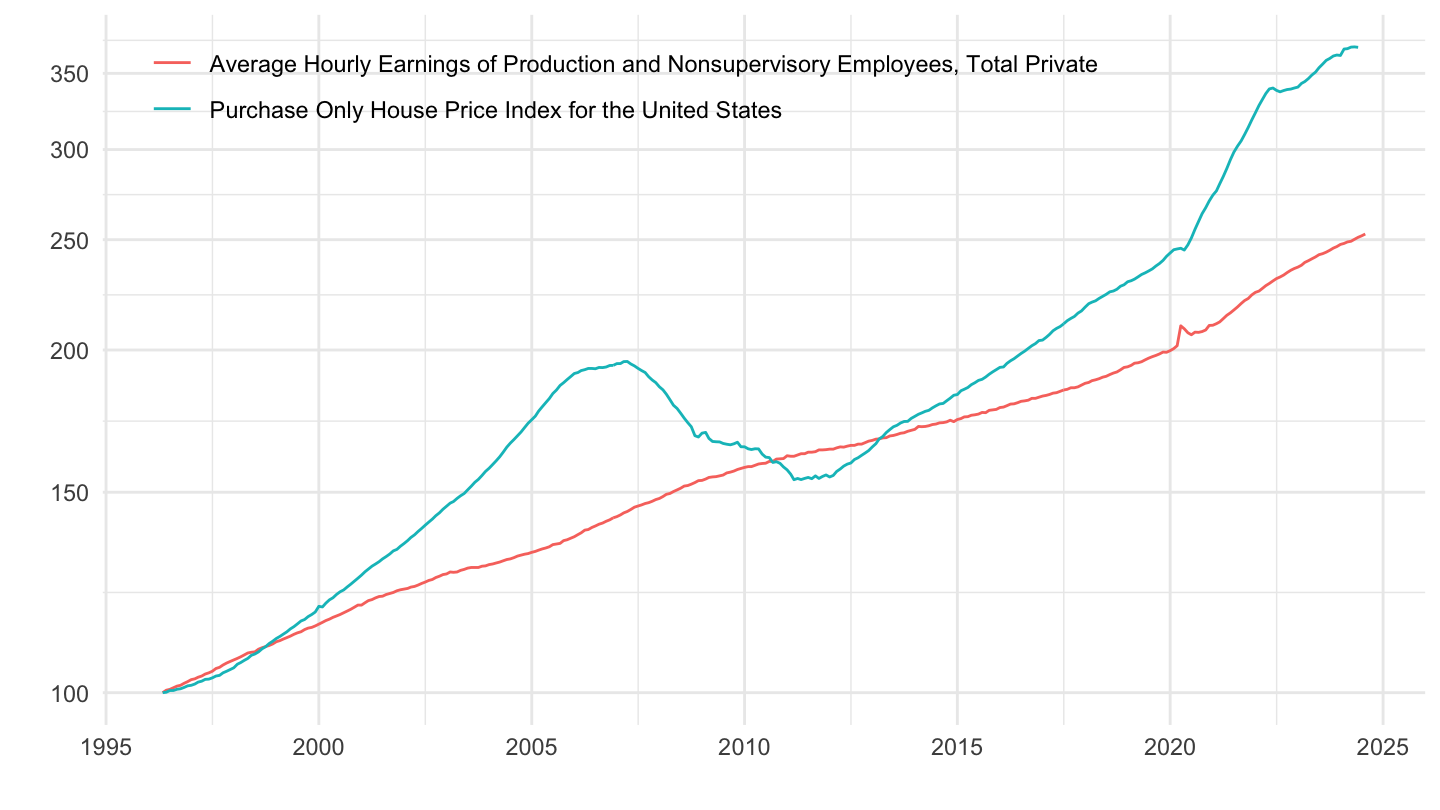
ggpubr::ggarrange(plot_linear + ggtitle("Linear scale"), plot_log + ggtitle("Log scale"), common.legend = T)