Federal Reserve bank of Saint Louis - FRED
Data - Fred
Datasets
Javascript
Flat
| id | Title | .RData | .html |
|---|---|---|---|
| api | Fred's API | NA | [2026-06-20] |
| cpi_indexes | Consumer Price Index Indexes | 2024-11-09 | [2026-06-20] |
| cpi | Consumer Price Index | 2026-06-20 | [2026-06-19] |
| debt | Debt | 2026-06-20 | [2026-06-20] |
| energy | Energy | 2026-06-20 | [2026-06-20] |
| gdp | Gross Domestic Product | 2026-06-20 | [2026-06-19] |
| housing | House Prices | 2026-06-20 | [2026-06-19] |
| industrie | Industrie | 2026-06-20 | [2026-06-19] |
| industry | Manufacturing, Industry | 2026-06-20 | [2026-06-20] |
| inflation | Inflation | 2026-06-20 | [2026-06-19] |
| japan | Japan - japan | 2026-06-20 | [2026-06-20] |
| log | Log Artefacts - log | 2026-06-20 | [2026-06-20] |
| minimum_wage | Minimum wages by state - minimum_wage | 2026-06-20 | [2026-06-20] |
| money | Money | 2026-06-20 | [2026-06-20] |
| phillips | Phillips curves | 2026-06-20 | [2026-06-19] |
| r | Interest Rates | 2026-06-20 | [2026-06-20] |
| recessions | Interest Rates | 2025-08-19 | [2026-06-20] |
| saving | Saving - saving | 2026-06-20 | [2026-06-20] |
| unr | Unemployment - unr | 2026-06-20 | [2026-06-19] |
| wage | Wage | 2026-06-20 | [2026-06-20] |
| wealth | Wealth - wealth | 2026-06-20 | [2026-06-20] |
| xrates | Exchange Rates | 2026-06-20 | [2026-04-26] |
Budget Surplus
US (2012-2020)
Code
ig_d("fred", "saving", "surplus-gdp-1929-2020")
Japan
Foreign Exchange interventions
Code
ig_d("fred", "japan", "JPINTDUSDJPY-JPINTDEXR-JPINTDDMEJPY-JPINTDUSDRP")
Interest Rates
Code
ig_d("fred", "japan", "INTGSTJPM193N-IRSTCB01JPM156N-1980")
Stock Market (1980-2020)
Code
ig_d("fred", "japan", "NIKKEI225-80-20")
Stock Market (1980-1995)
Code
ig_d("fred", "japan", "NIKKEI225-80-95")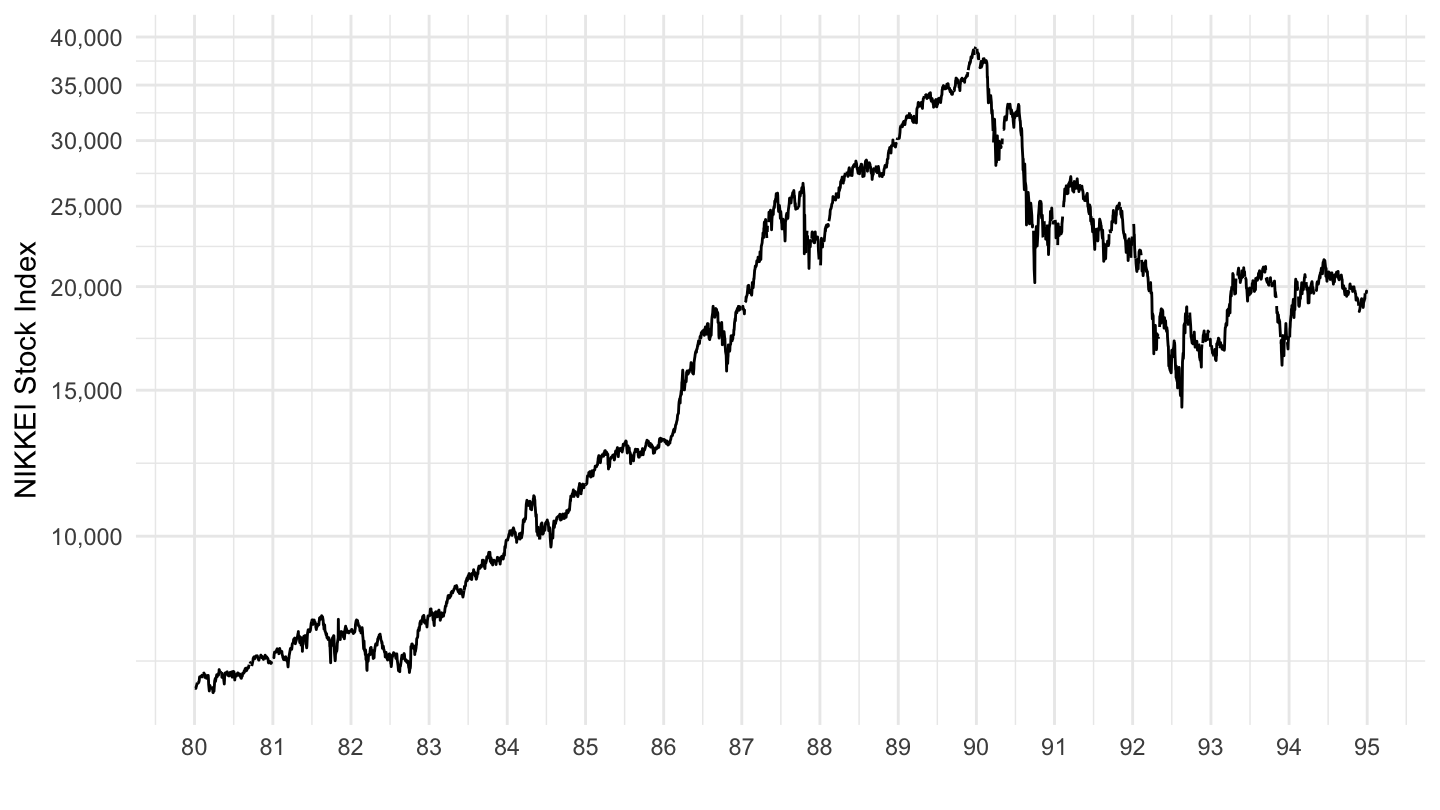
Interest Rates
U.S. Versus Euro Area Discount Rates
(ref:US-EUR-discount-rates) U.S. Versus Euro Area Discount Rates
Code
ig_d("fred", "r", "FEDFUNDS-INTDSREZQ193N")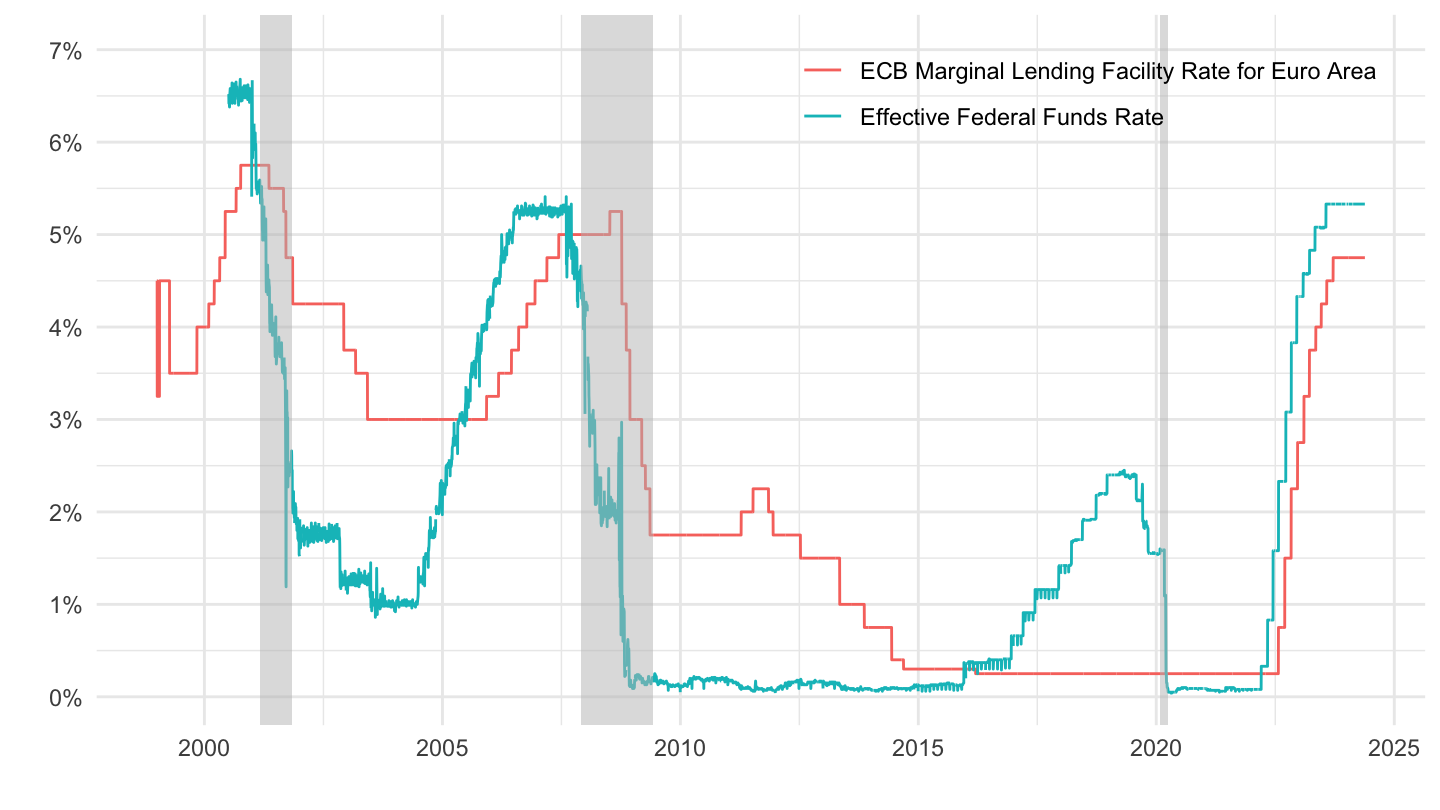
1990 Hiking Cycle
30-year convential Mortgage Rate
Code
ig_d("fred", "r", "MORTGAGE30US-87-93")
Federal Funds Rate (Source: FRED)
Code
ig_d("fred", "r", "FEDFUNDS-87-93")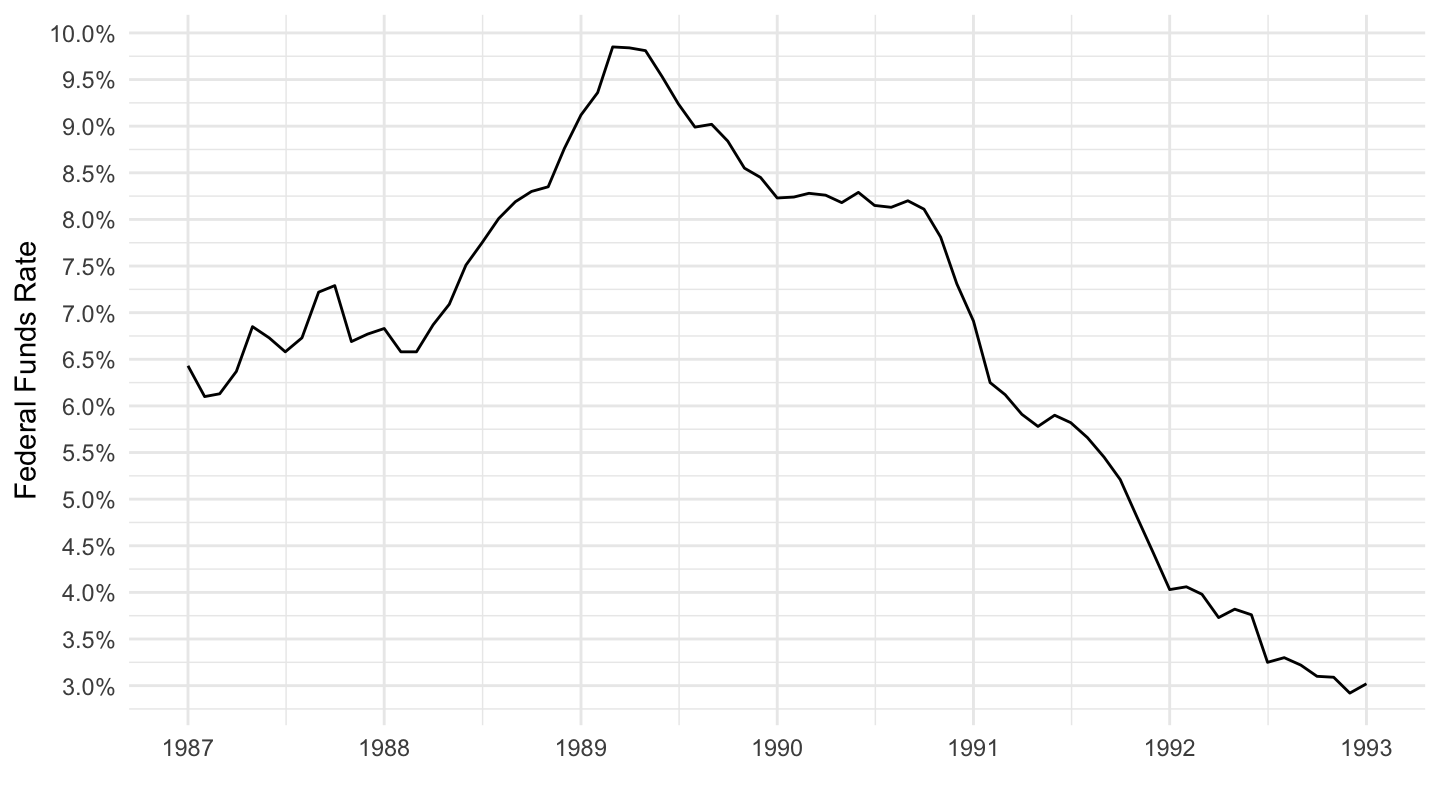
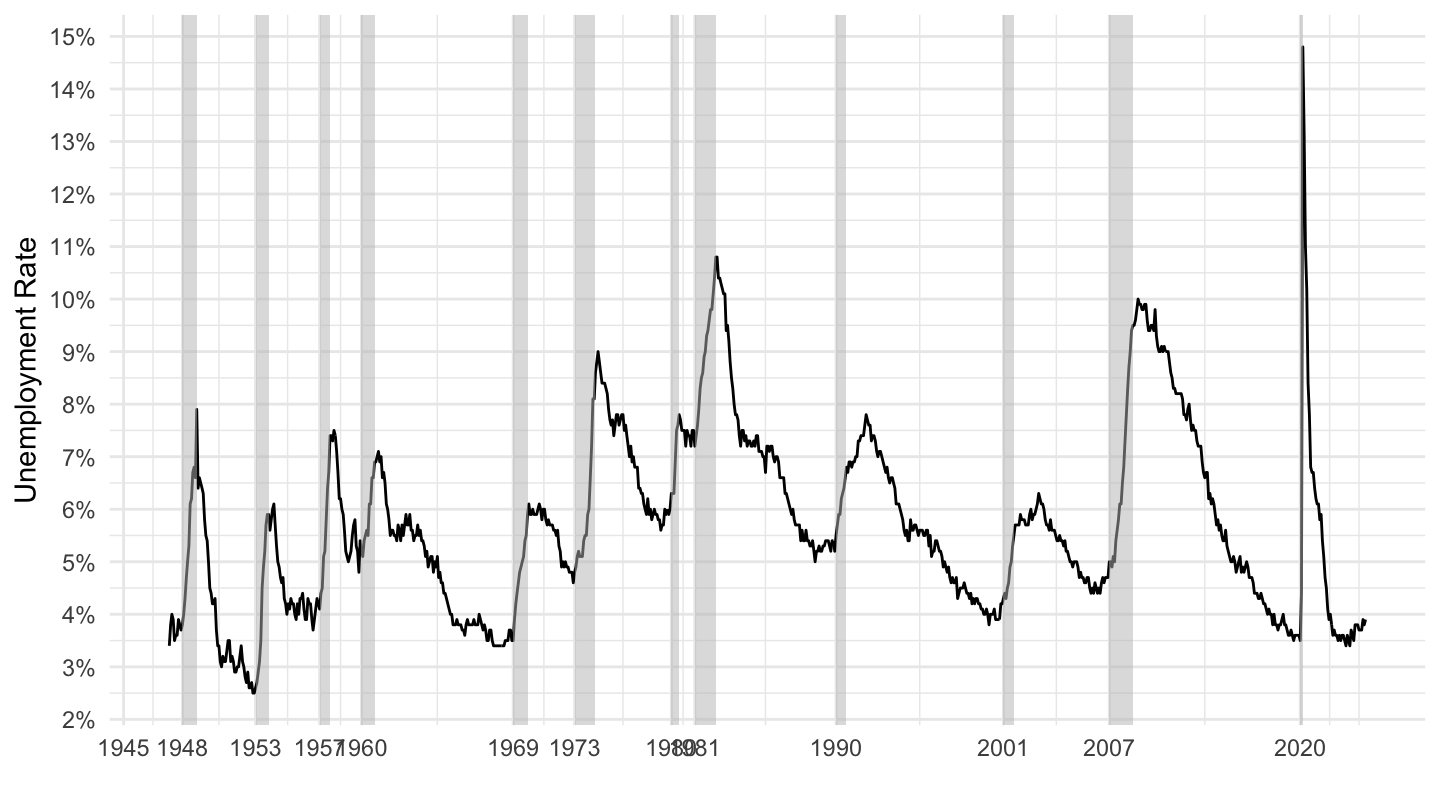
Unemployment Rate (1987-1993)
Code
ig_d("fred", "unr", "UNRATE-87-93")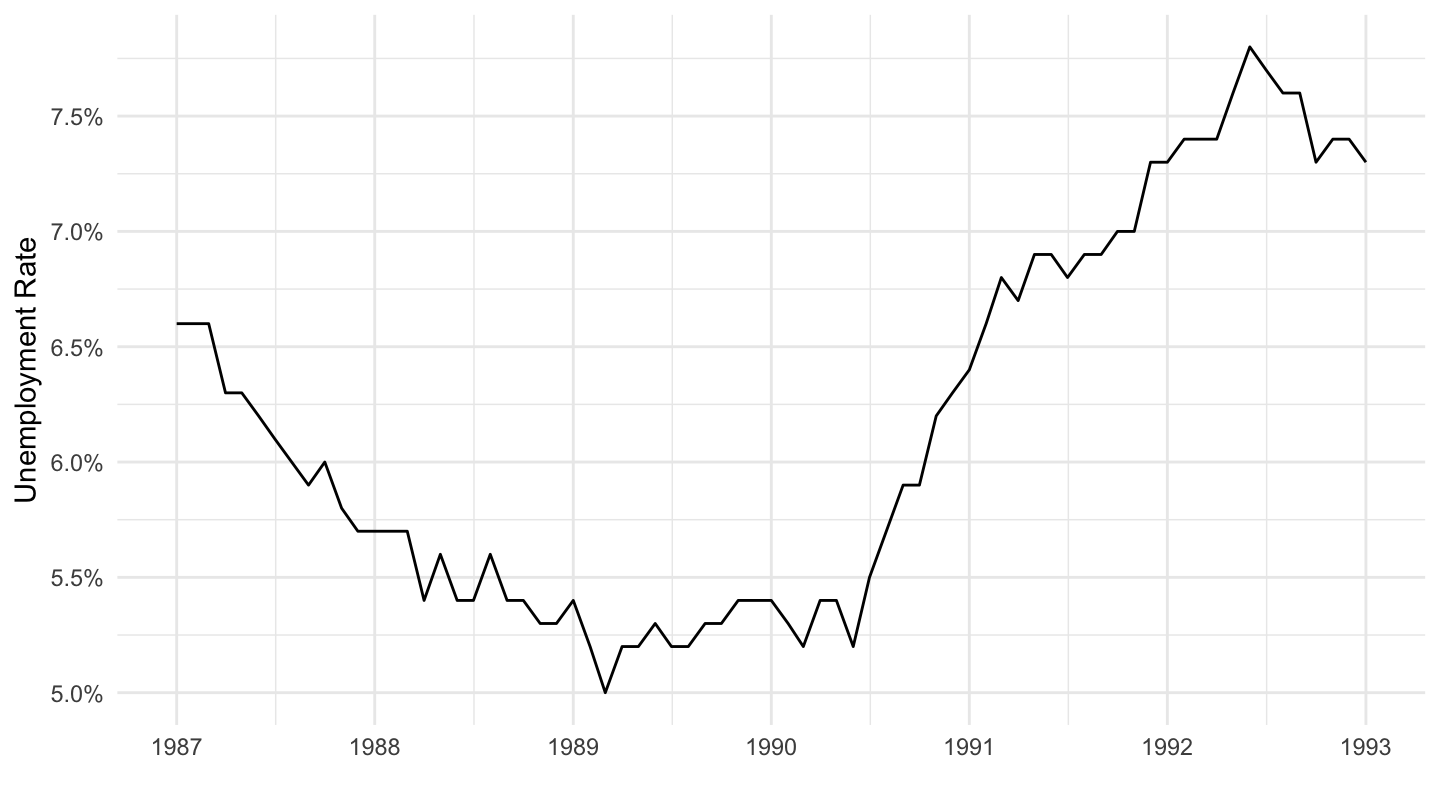
2004-2007 Hiking Cycle
Federal Funds Rate (Source: FRED)
Code
ig_d("fred", "r", "FEDFUNDS-04-12")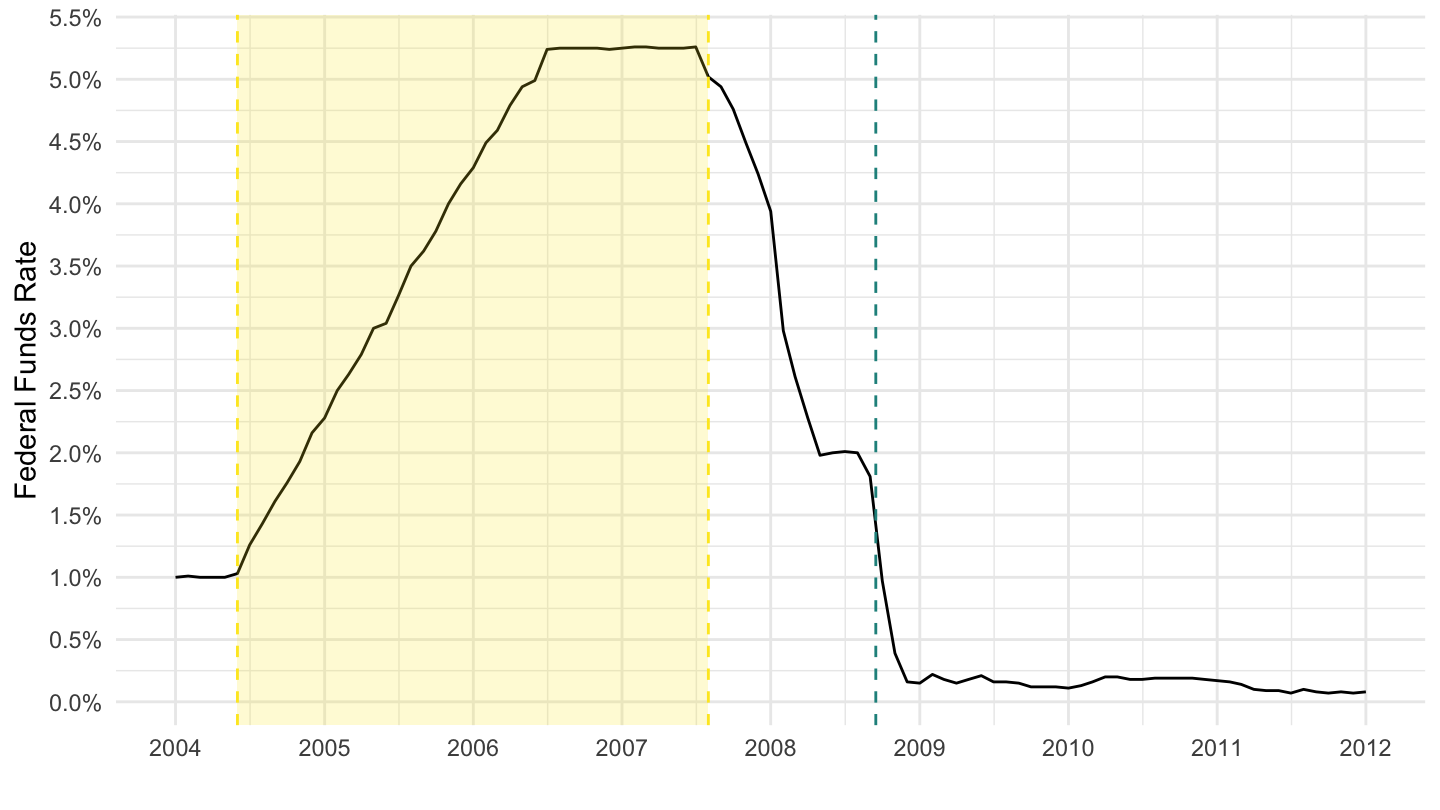
Unemployment Rate (2004-2012)
Code
ig_d("fred", "unr", "UNRATE-04-12")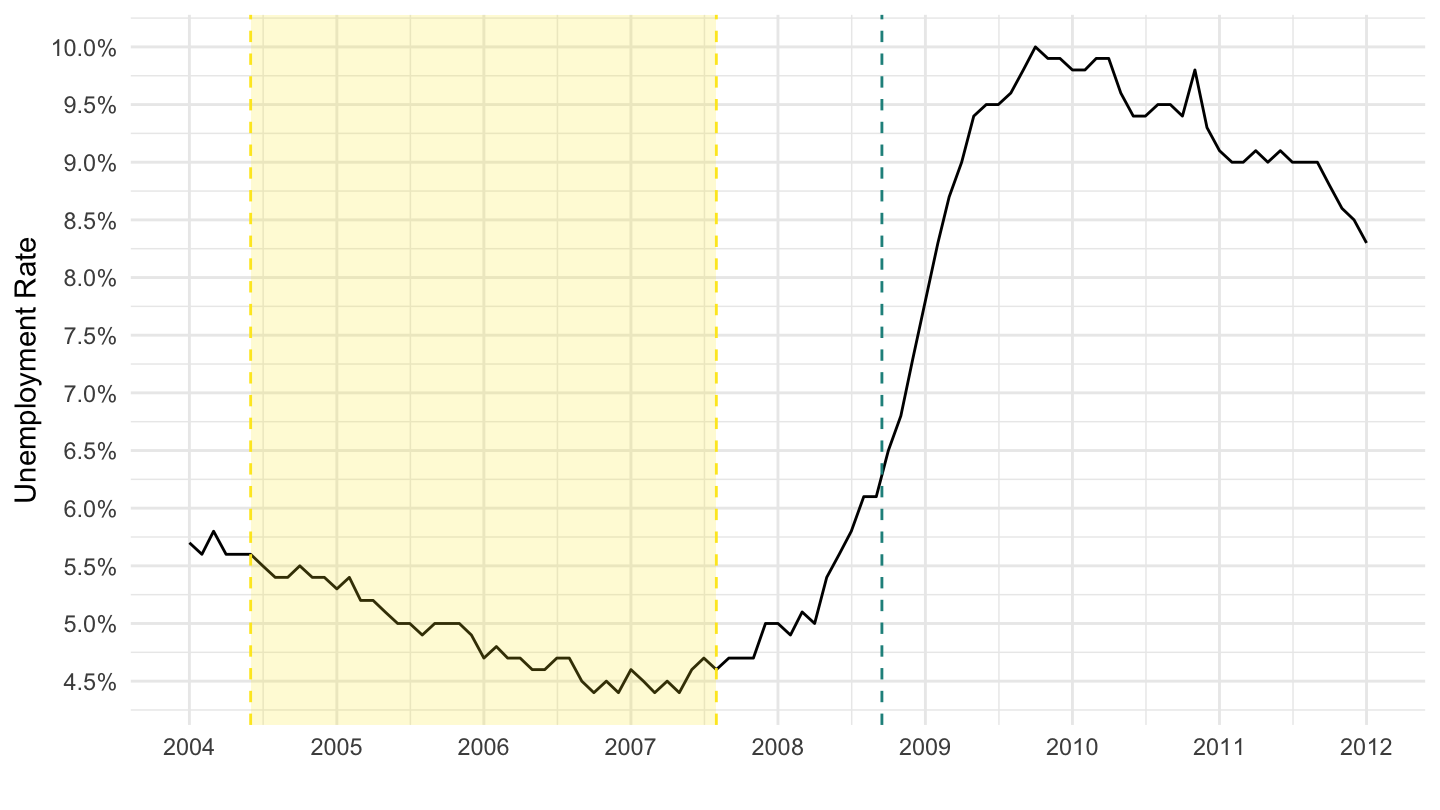
2013 Taper Tentrum
30-year convential Mortgage Rate before and after Taper Tantrum
Code
ig_d("fred", "r", "MORTGAGE30US-11-16")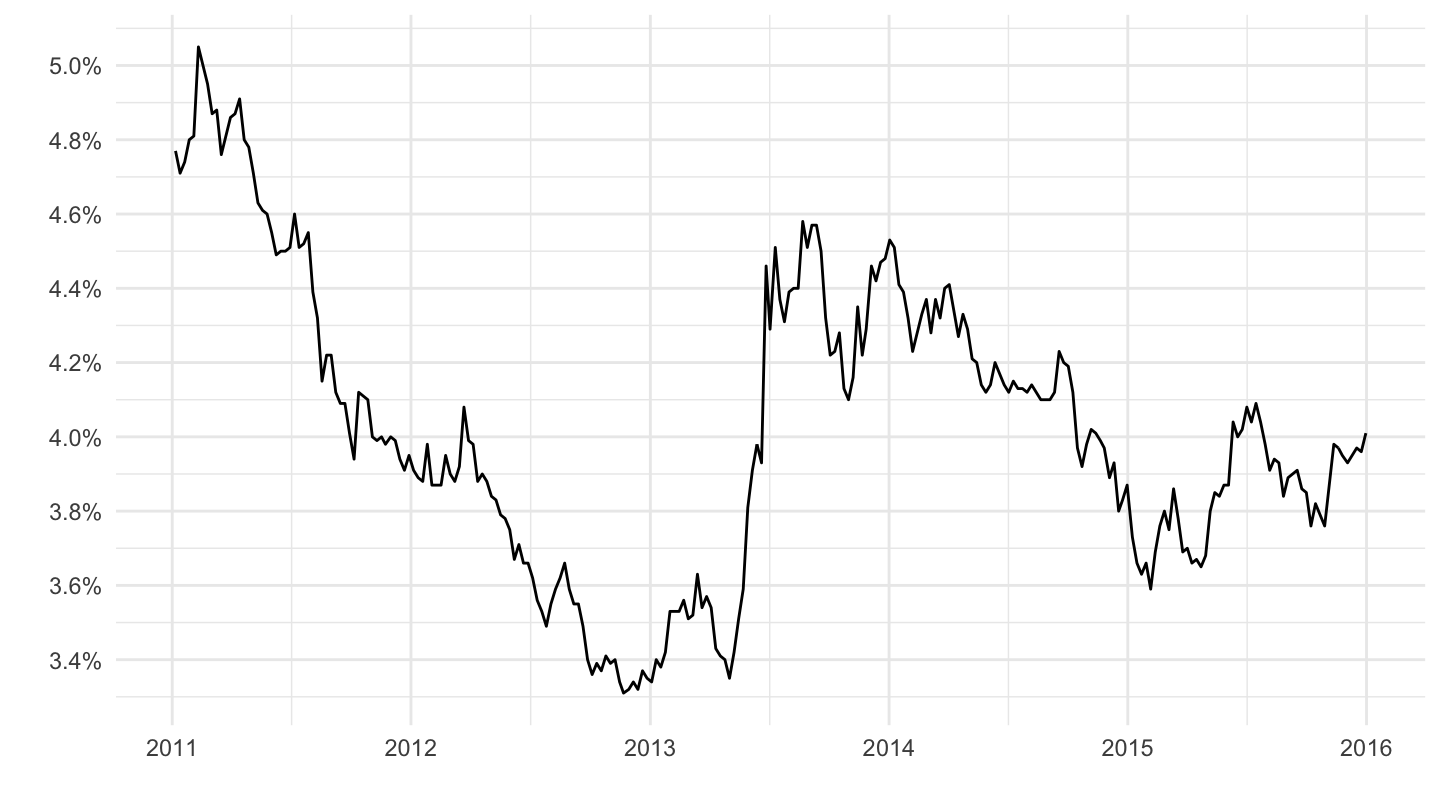
Mortgage Debt Service Payments (2011-2016)
(ref:MDSP-11-16) Mortgage Debt Service Payments (2011-2016)
Code
ig_d("fred", "r", "MDSP-11-16")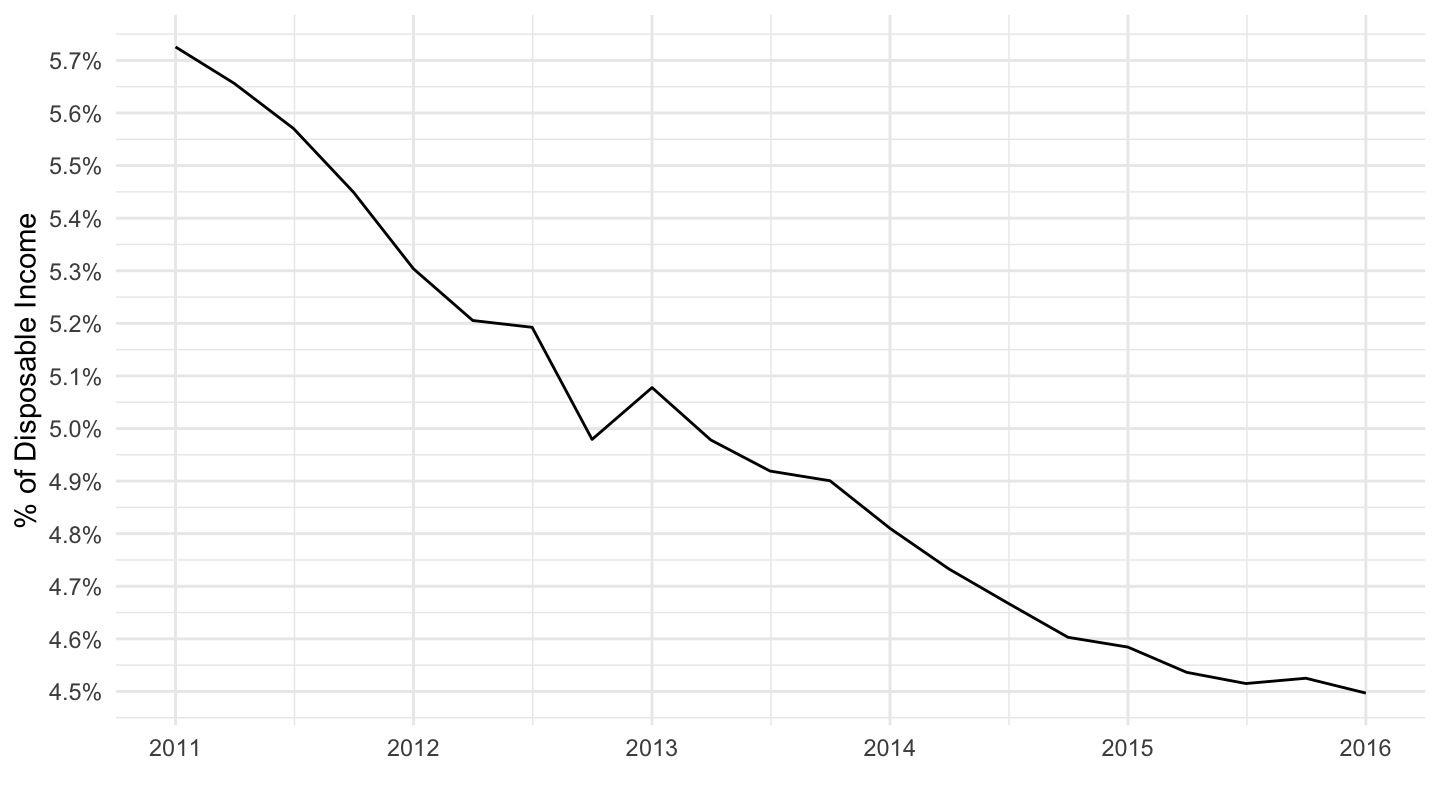
Financial Crisis Macroeconomic Aggregates
Household Debt to GDP (% of GDP)
(ref:HDTGPDUSQ163N) Mortgage Debt Service Payments, in Billions (2000-2012)
Code
ig_d("fred", "gdp", "HDTGPDUSQ163N")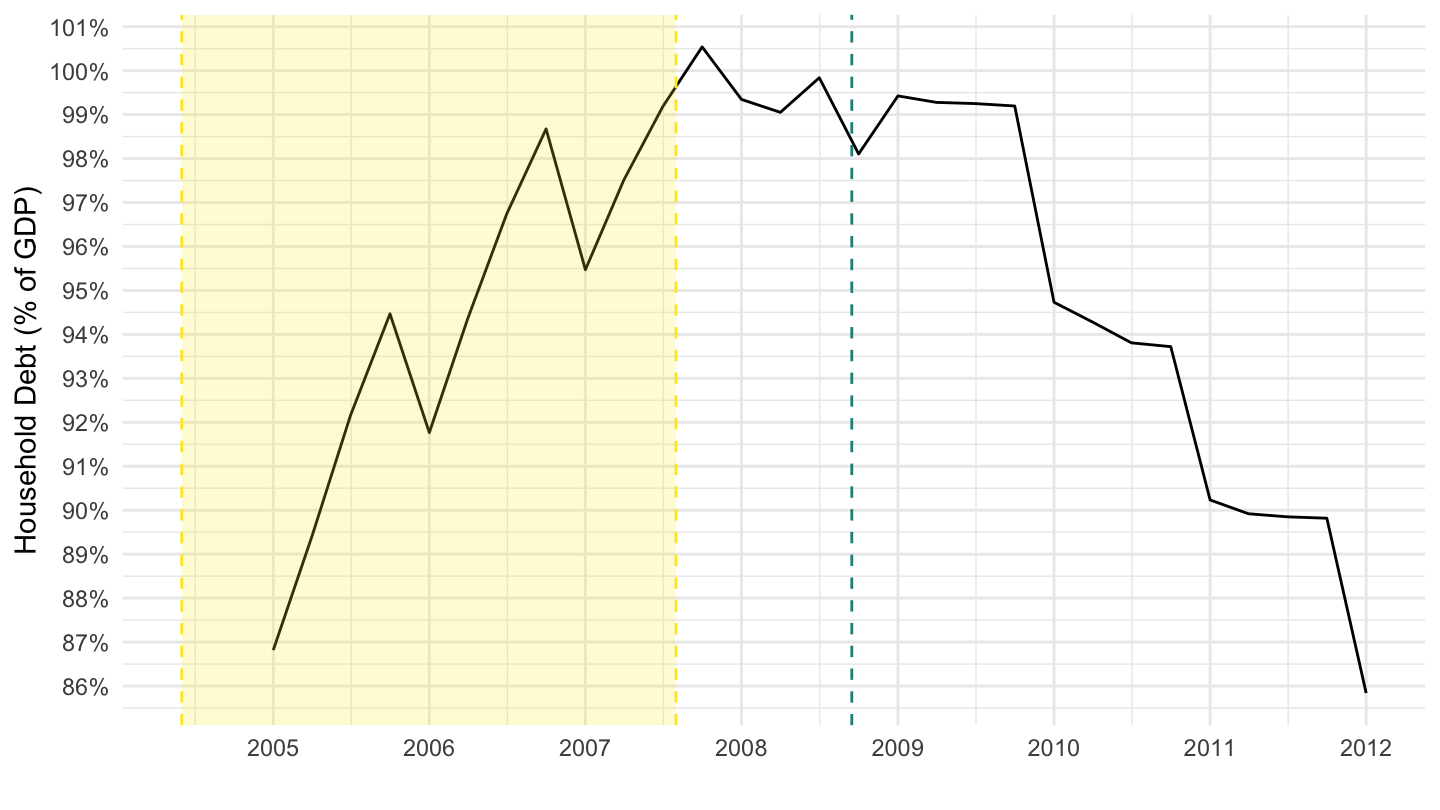
Mortgage Debt Service Payments (in Billion Dollars)
(ref:MDSP-DSPI) Mortgage Debt Service Payments, in Billions (2000-2012)
Code
ig_d("fred", "gdp", "MDSP-DSPI")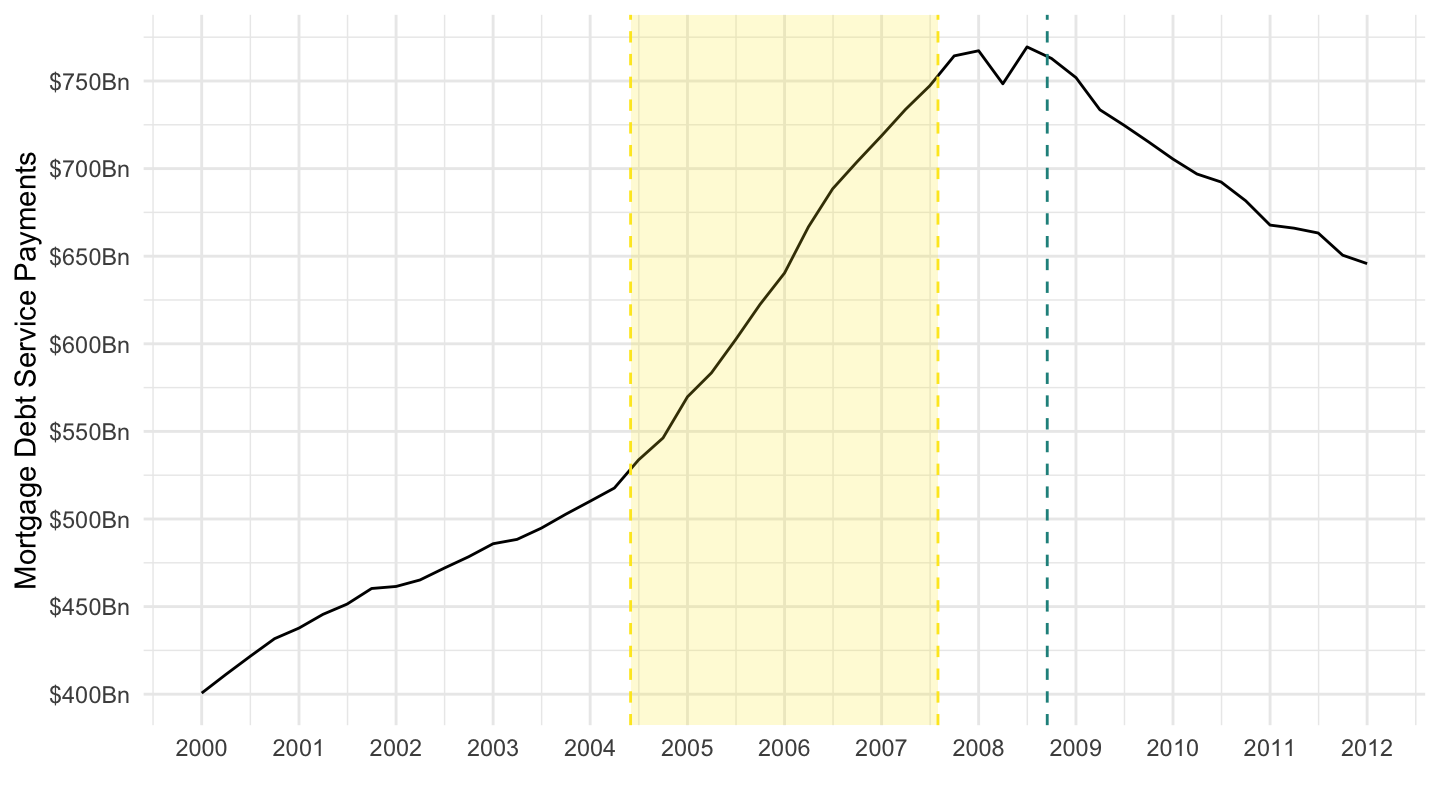
Mortgage Debt Service Payments (% Disposable Personal Income)
(ref:MDSP) Mortgage Debt Service Payments (2000-2019)
Code
ig_d("fred", "gdp", "MDSP")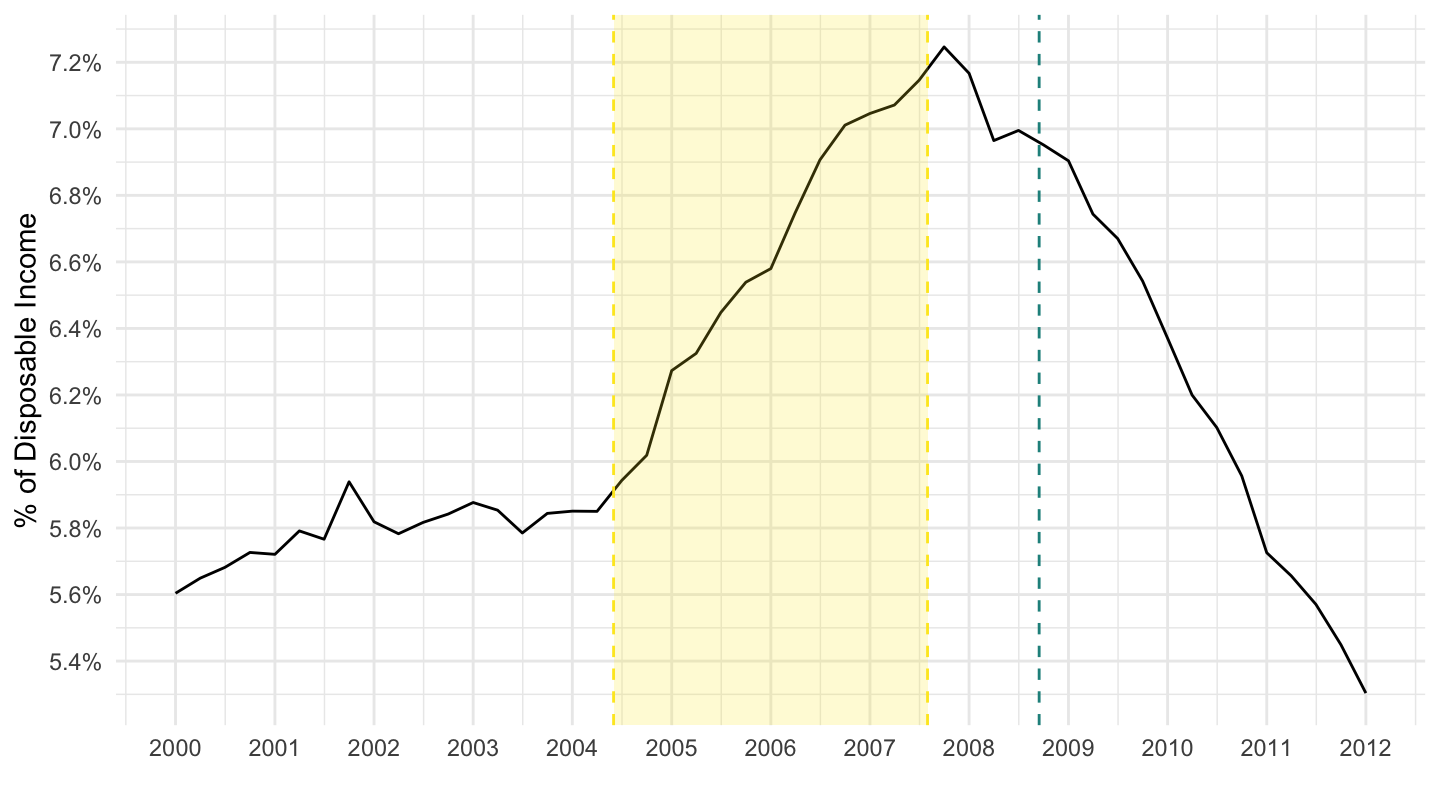
House Prices
(ref:USSTHPI) House Prices (Index)
Code
ig_d("fred", "gdp", "USSTHPI")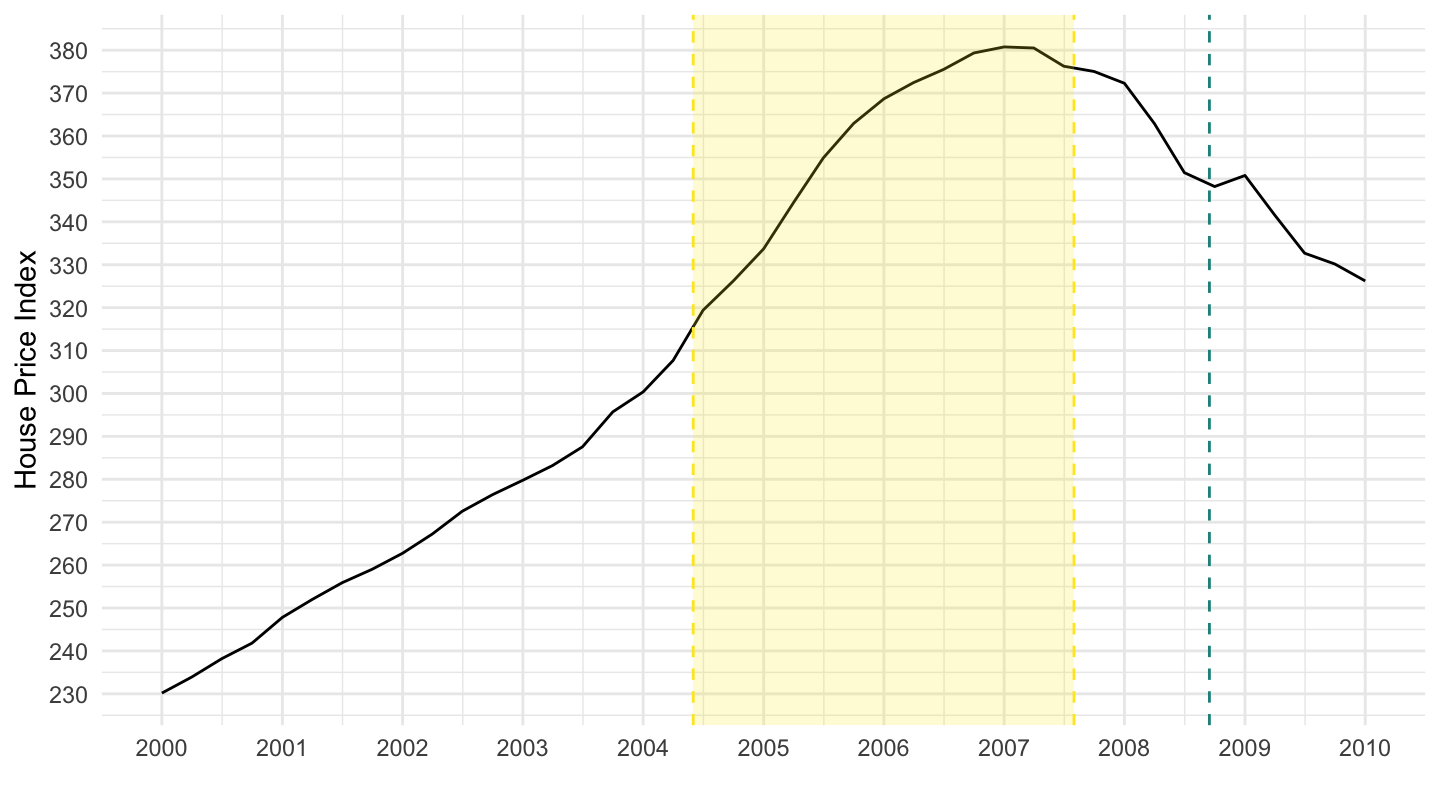
Disposable Income
(ref:DSPI-3) Disposable Income (2000-2019)
Code
ig_d("fred", "gdp", "DSPI-3")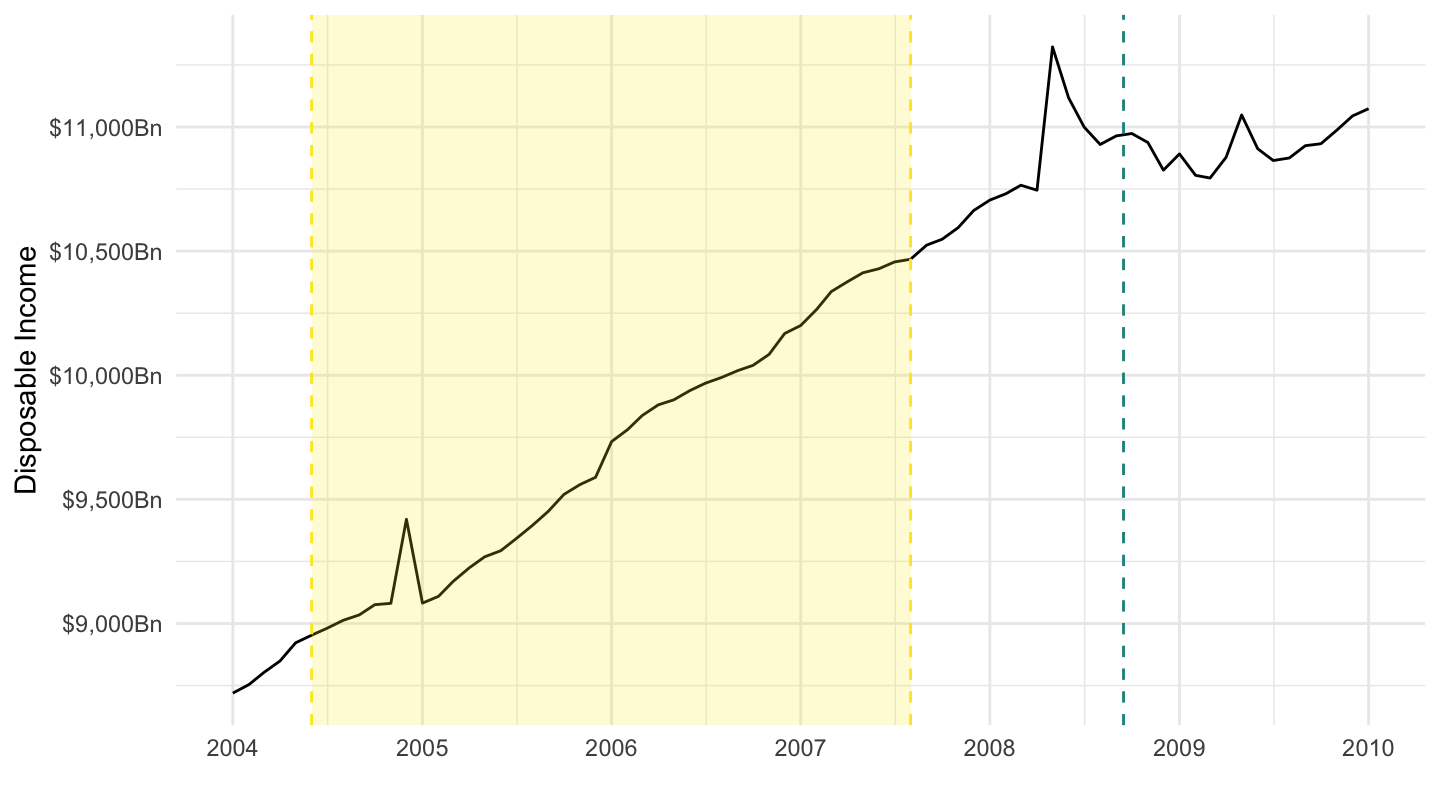
Consumption
Code
ig_d("fred", "gdp", "PCEC-06-20")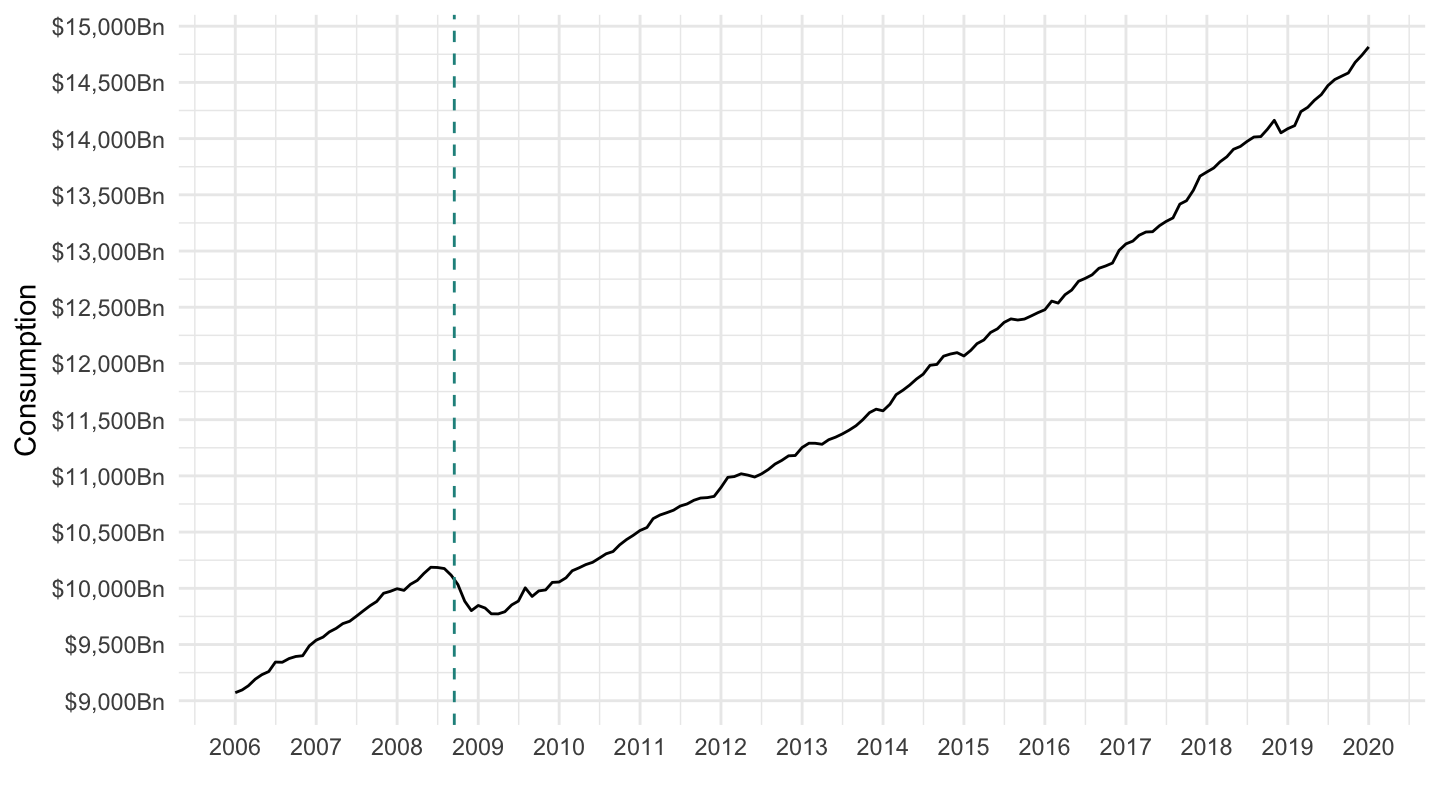
Durable, Non-Durable, Services
(ref:PCND-06-20) Non-durable Expenditures
Code
ig_d("fred", "gdp", "PCND-06-20")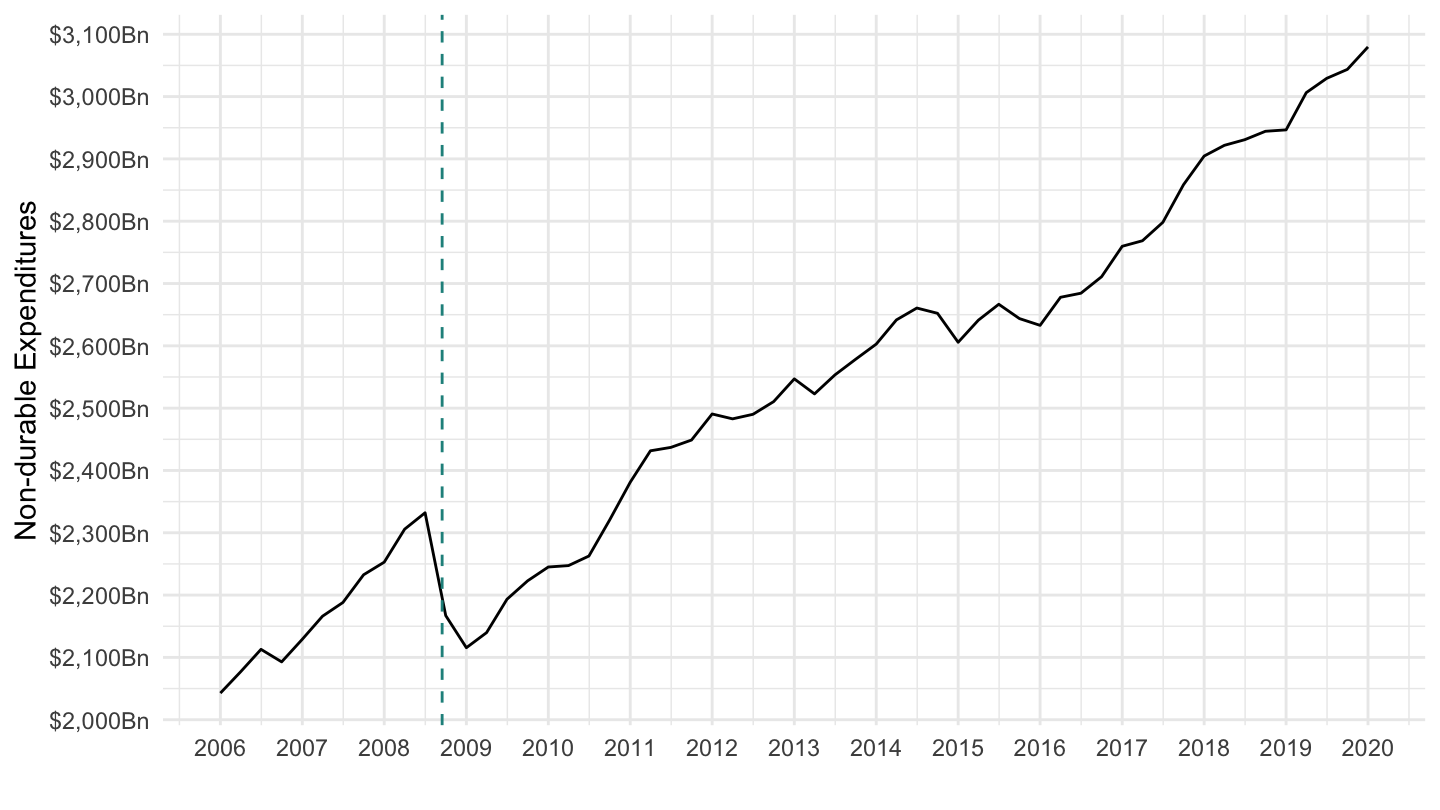
Durable Expenditures
(ref:PCEDG-06-20) Durable Expenditures
Code
ig_d("fred", "gdp", "PCEDG-01-15")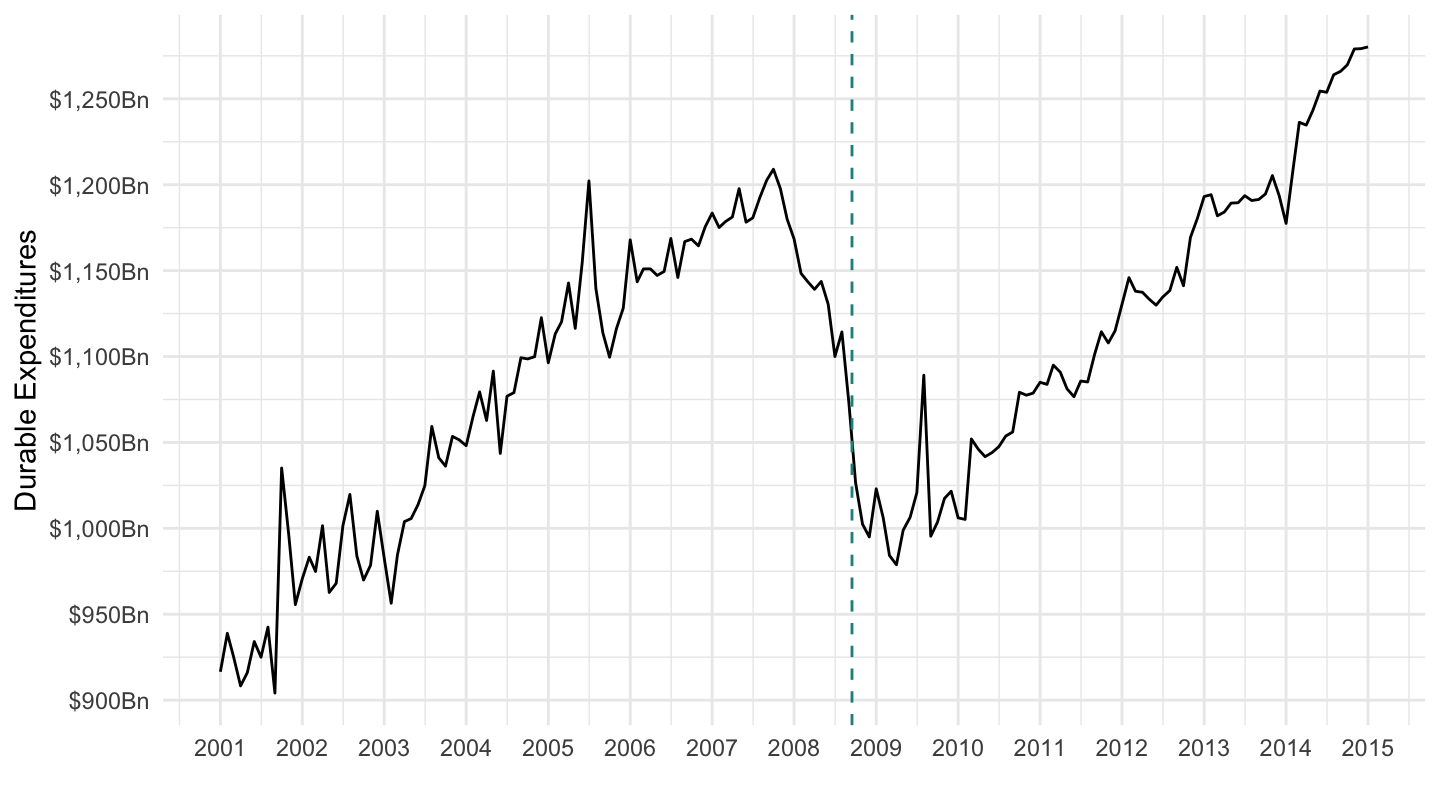
Service Expenditures
(ref:PCESV-06-20) Service Expenditures
Code
ig_d("fred", "gdp", "PCESV-06-20")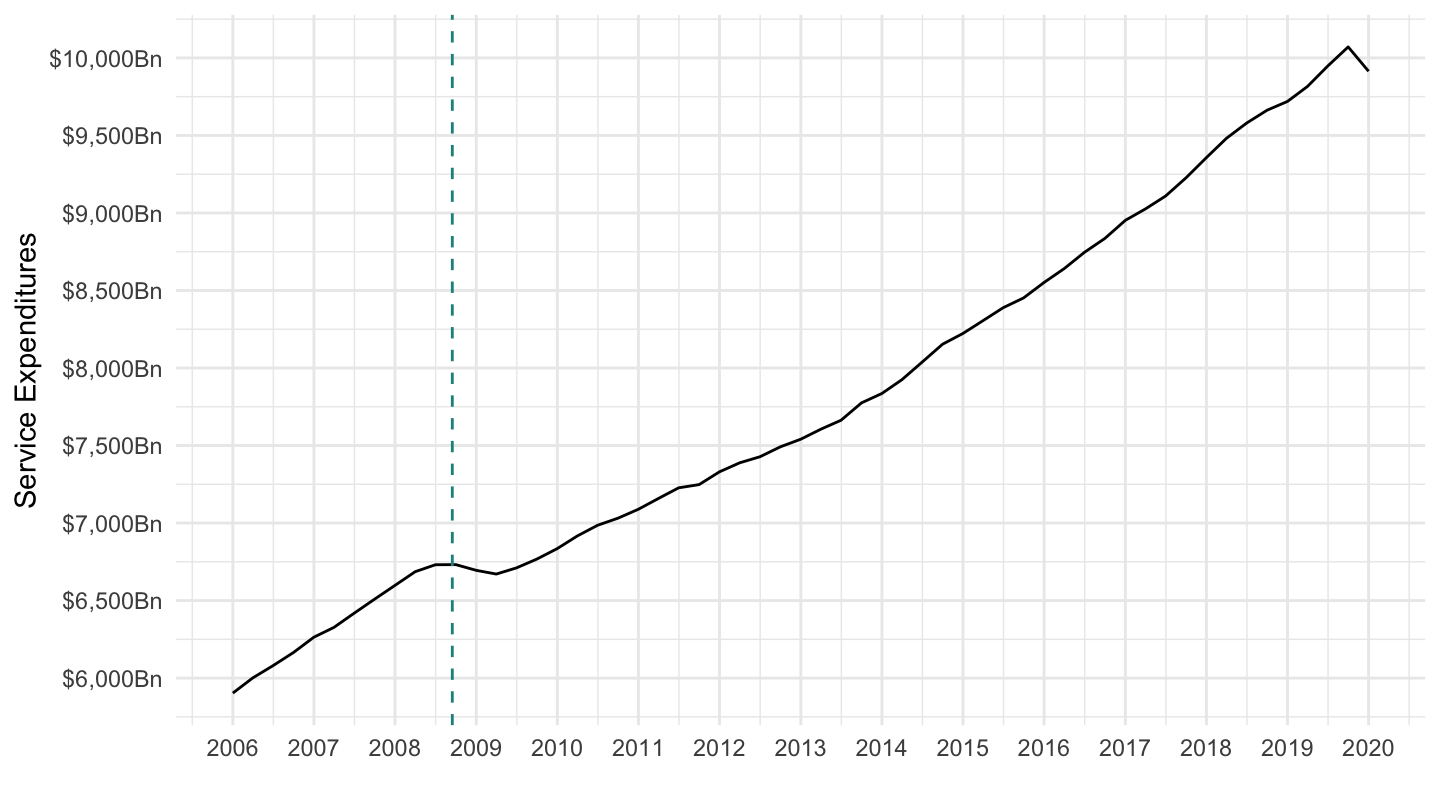
Imputed rental
(ref:DOWNRC1A027NBEA) Imputed rental
Code
ig_d("fred", "gdp", "DOWNRC1A027NBEA-06-20")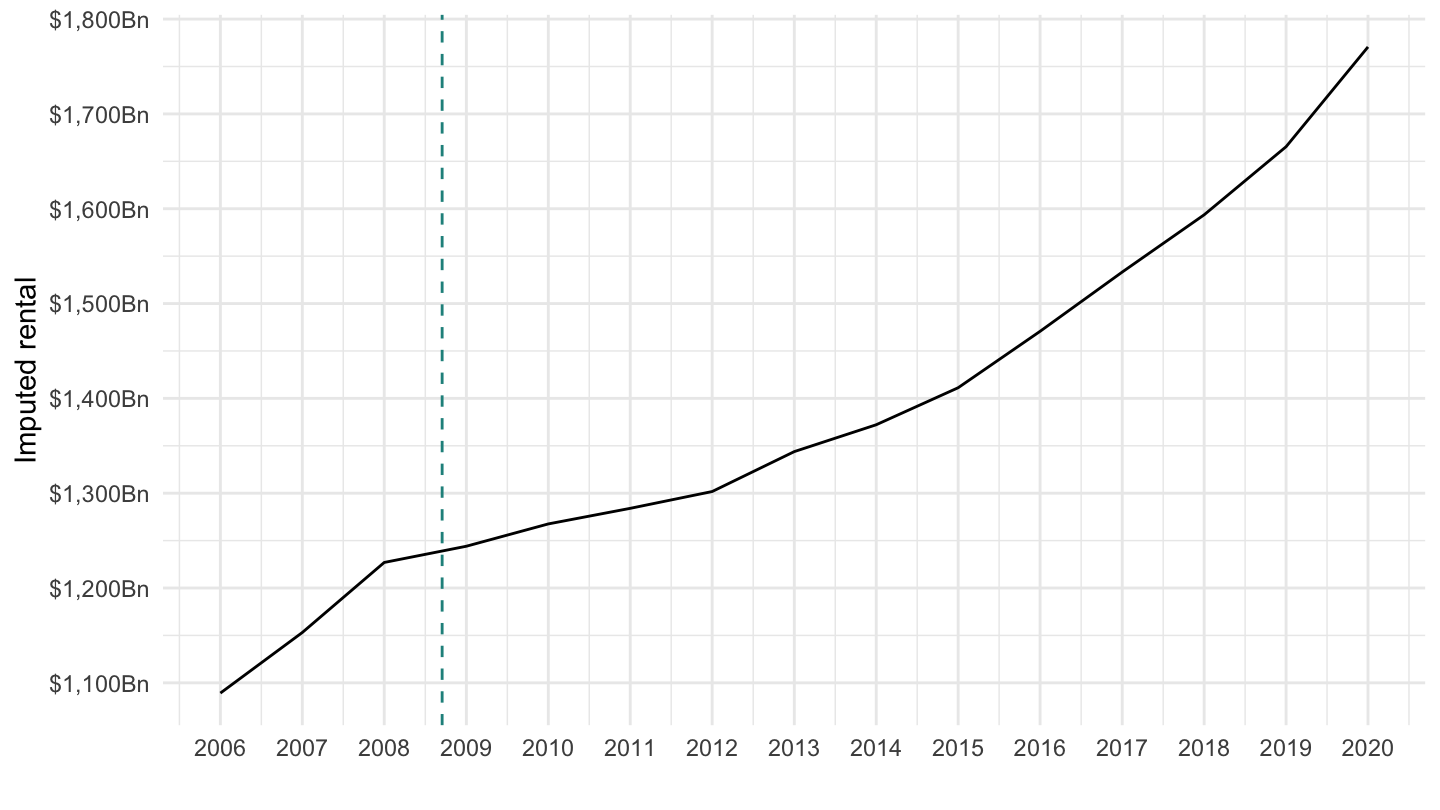
Health Care
(ref:USPCEHLTHCARE) Health Care
Code
ig_d("fred", "gdp", "USPCEHLTHCARE-06-20")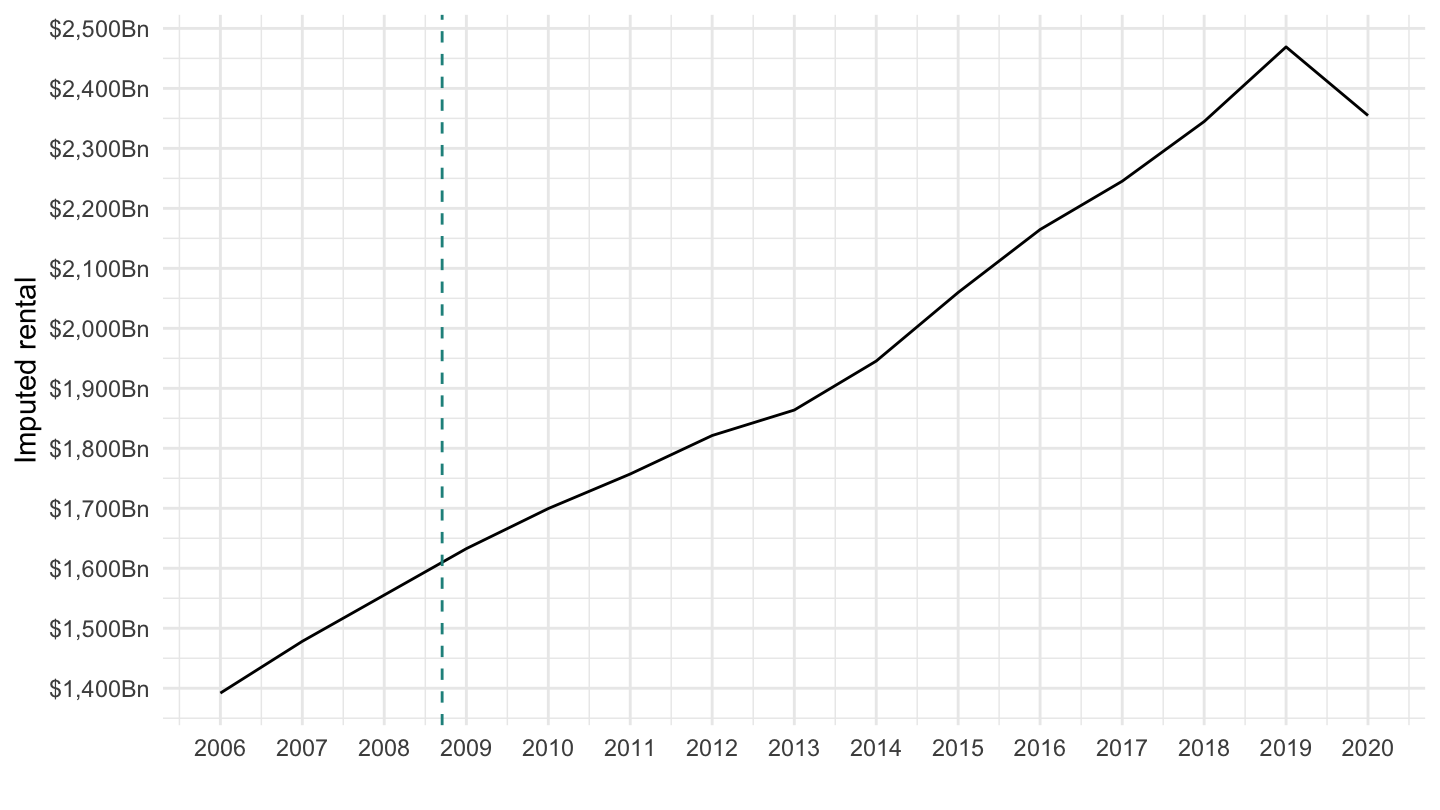
Housing
(ref:DHSGRC0-06-20) Housing
Code
ig_d("fred", "gdp", "DHSGRC0-06-20")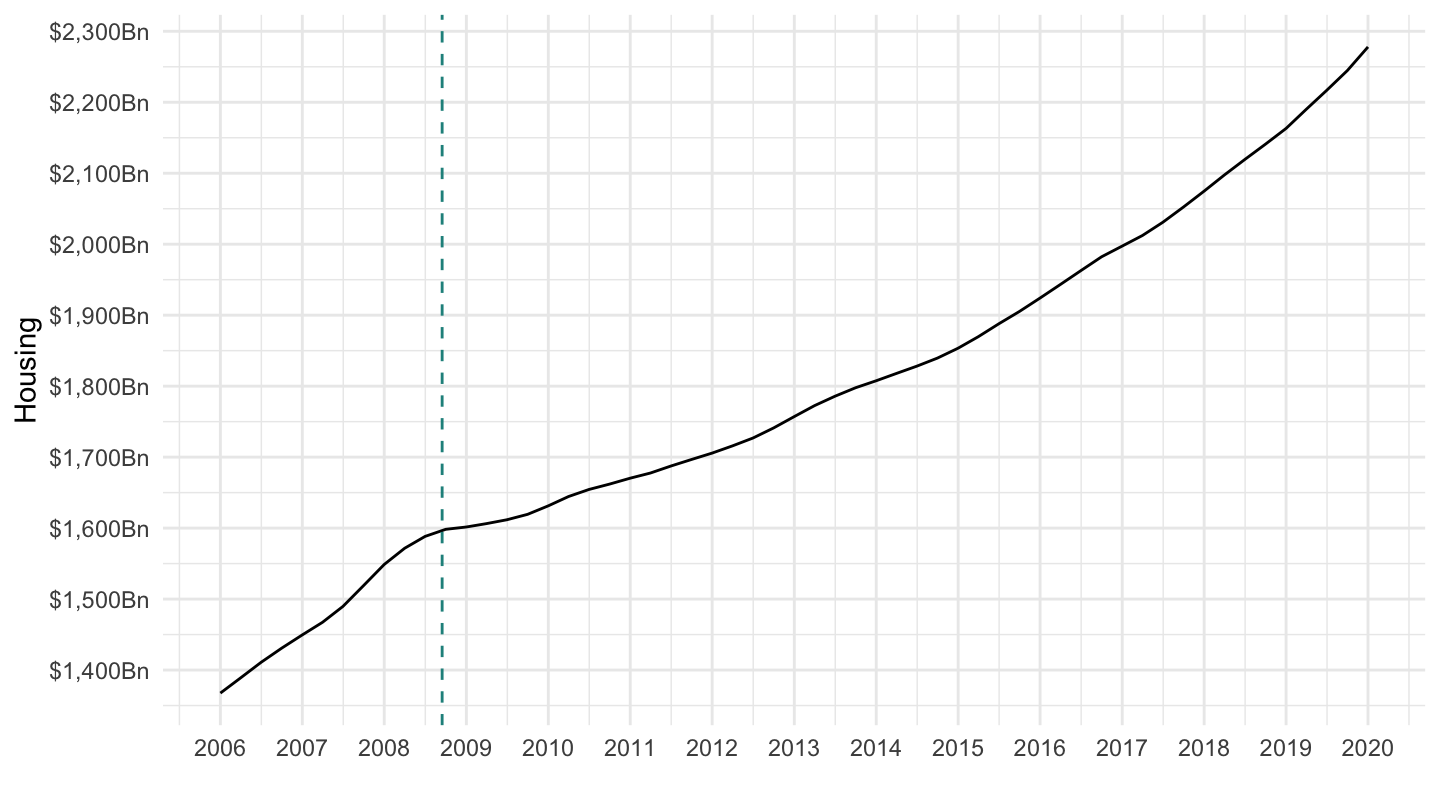
Clothing
(ref:DCAFRC1A027NBEA-06-20) Clothing
Code
ig_d("fred", "gdp", "DCAFRC1A027NBEA-06-20")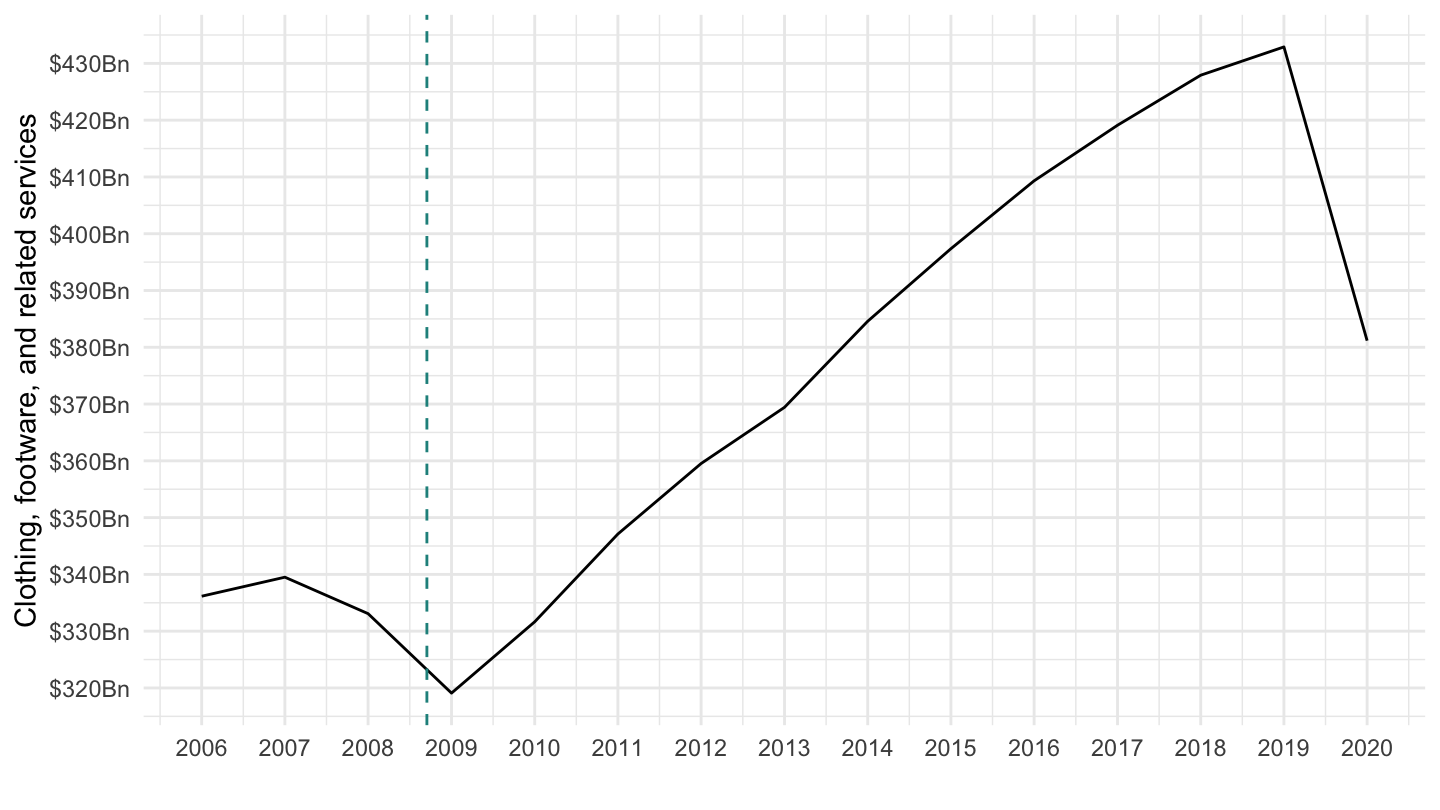
Corporate Bonds
Germany, Japan
(ref:fred-GER-JPN-10Y) Long-Term Government Bond Yields, Germany (Source: FRED).
Code
ig_d("fred", "r", "fred-GER-JPN-10Y")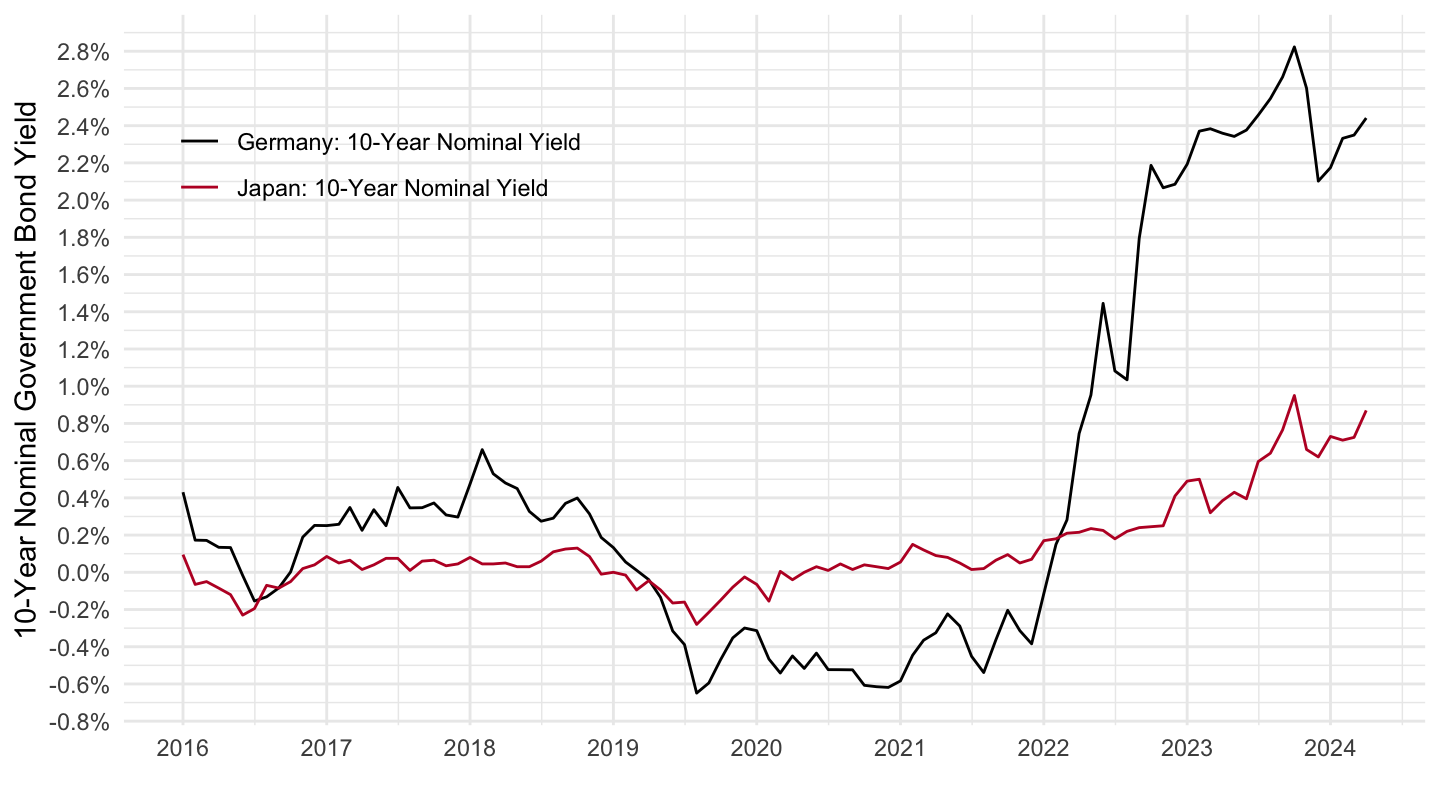
Interest Rates
Code
ig_d("fred", "r", "AAA-BAA-DGS10-DFII10")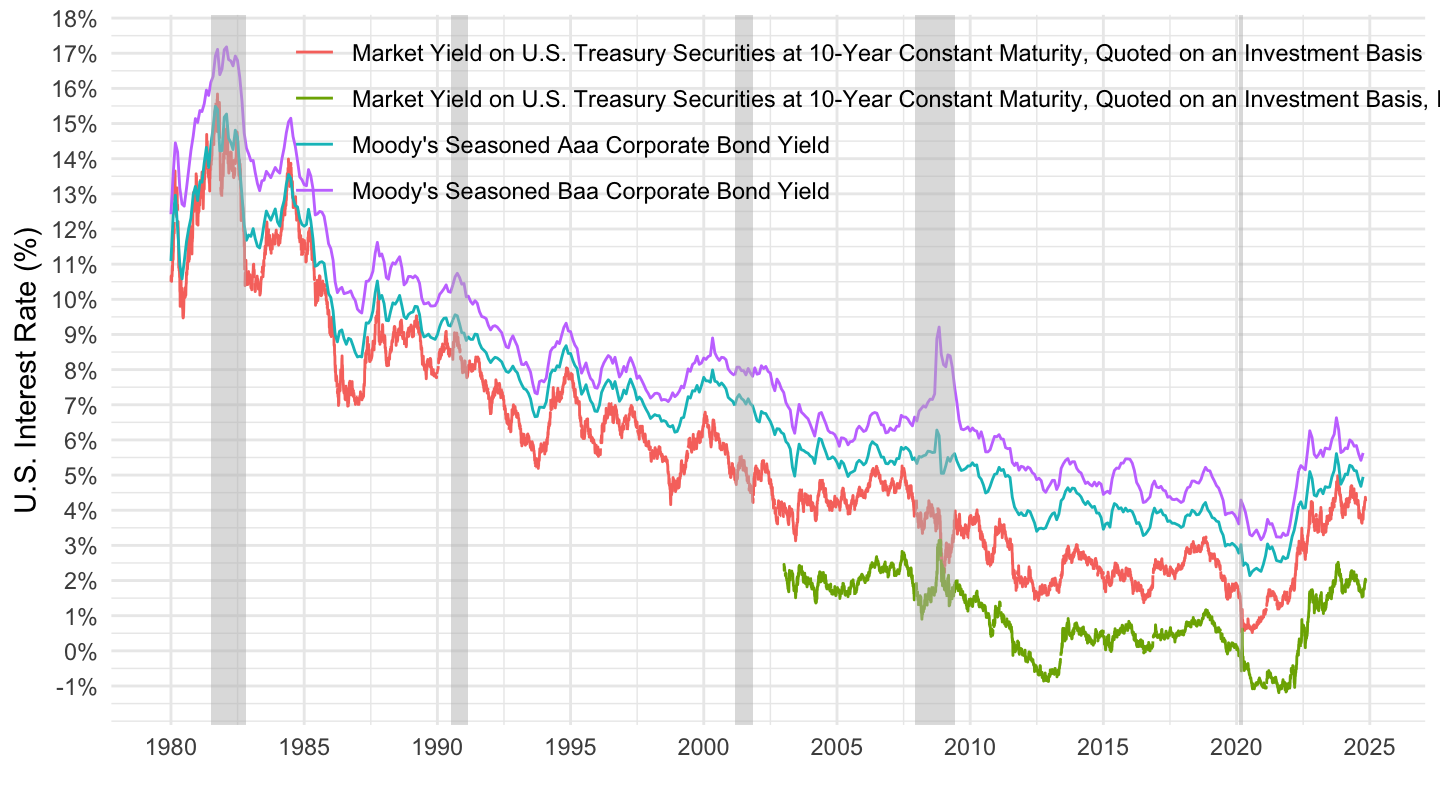
1980-2020
Code
ig_d("fred", "r", "AAA-BAA-1980")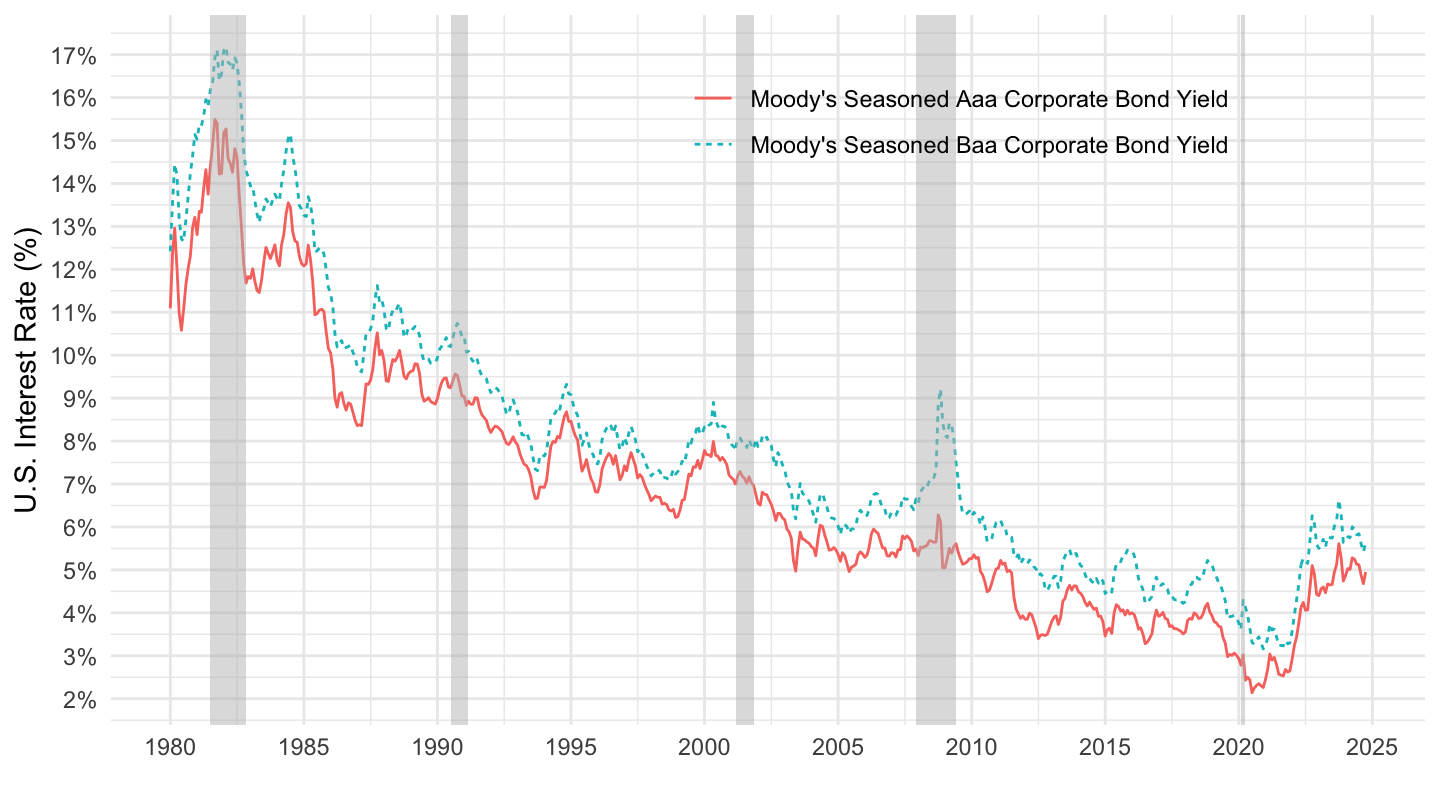
1920-2020
Code
ig_d("fred", "r", "AAA-BAA-1920")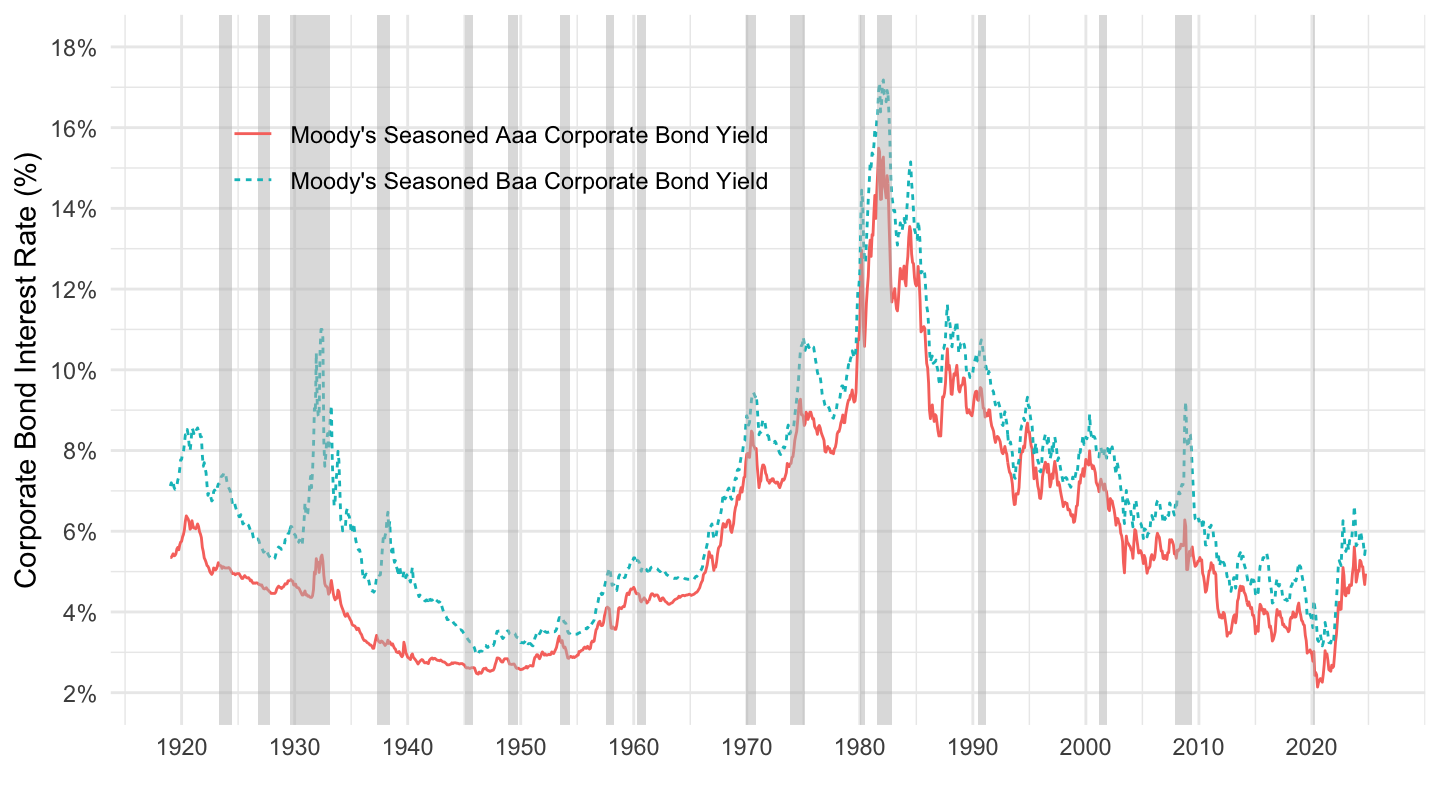
US
All
(ref:surplus-gdp-1929-2019) Budget Surplus, 1929-2019 (% of GDP).
Code
ig_d("fred", "gdp", "surplus-gdp-1929-2019")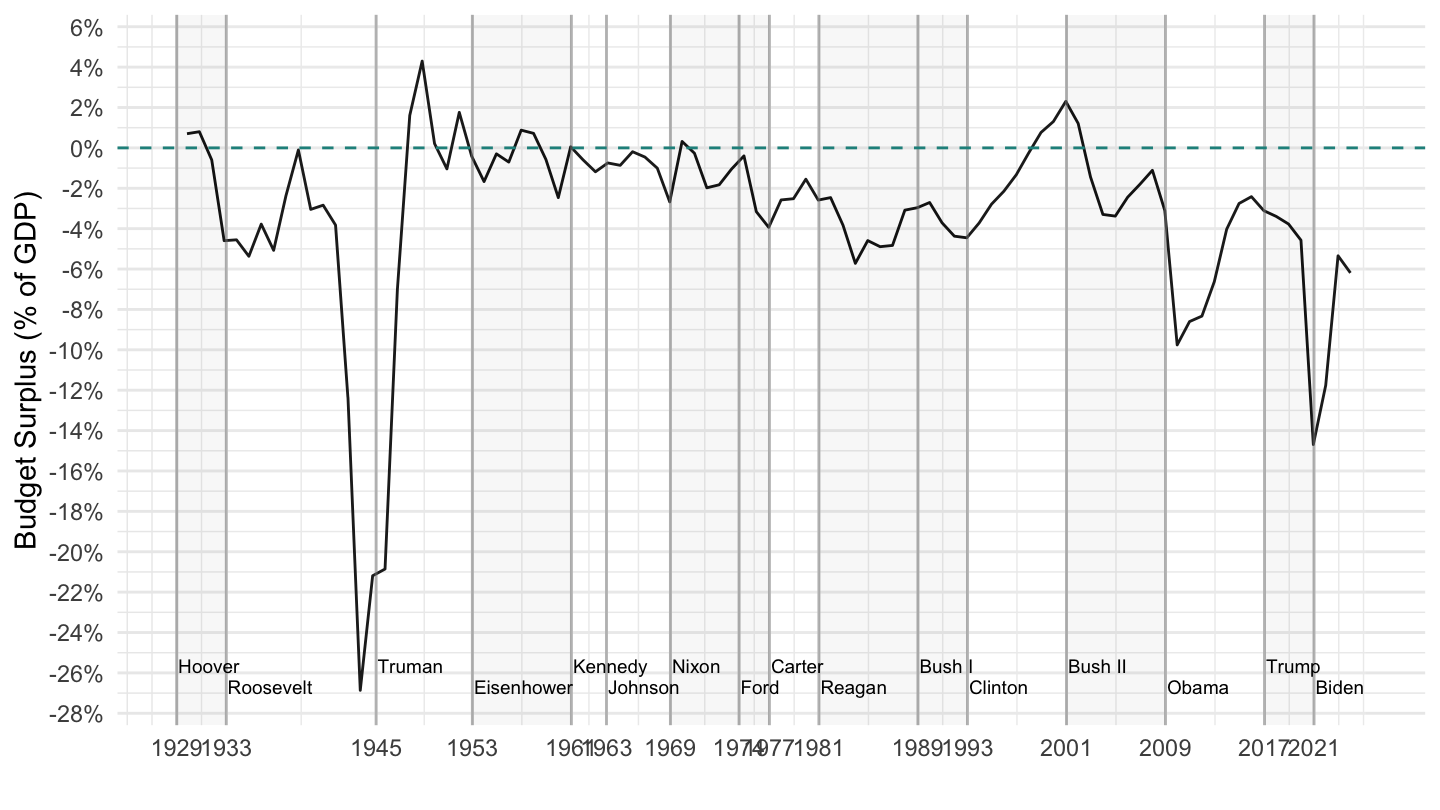
1945-2021
Code
ig_d("fred", "gdp", "surplus-gdp-1945-2021")
United Kingdom
Original
- UNRTUKA: Unemployment Rate in the United Kingdom
- CPIIUKA: Consumer Price Inflation in the United Kingdom
Code
ig_d("fred", "phillips", "uk-1860-1915")
D1
- UNRTUKA: Unemployment Rate in the United Kingdom
- CPIIUKA: Consumer Price Inflation in the United Kingdom
Code
ig_d("fred", "phillips", "uk-1860-1915-UNRTUKA-d1")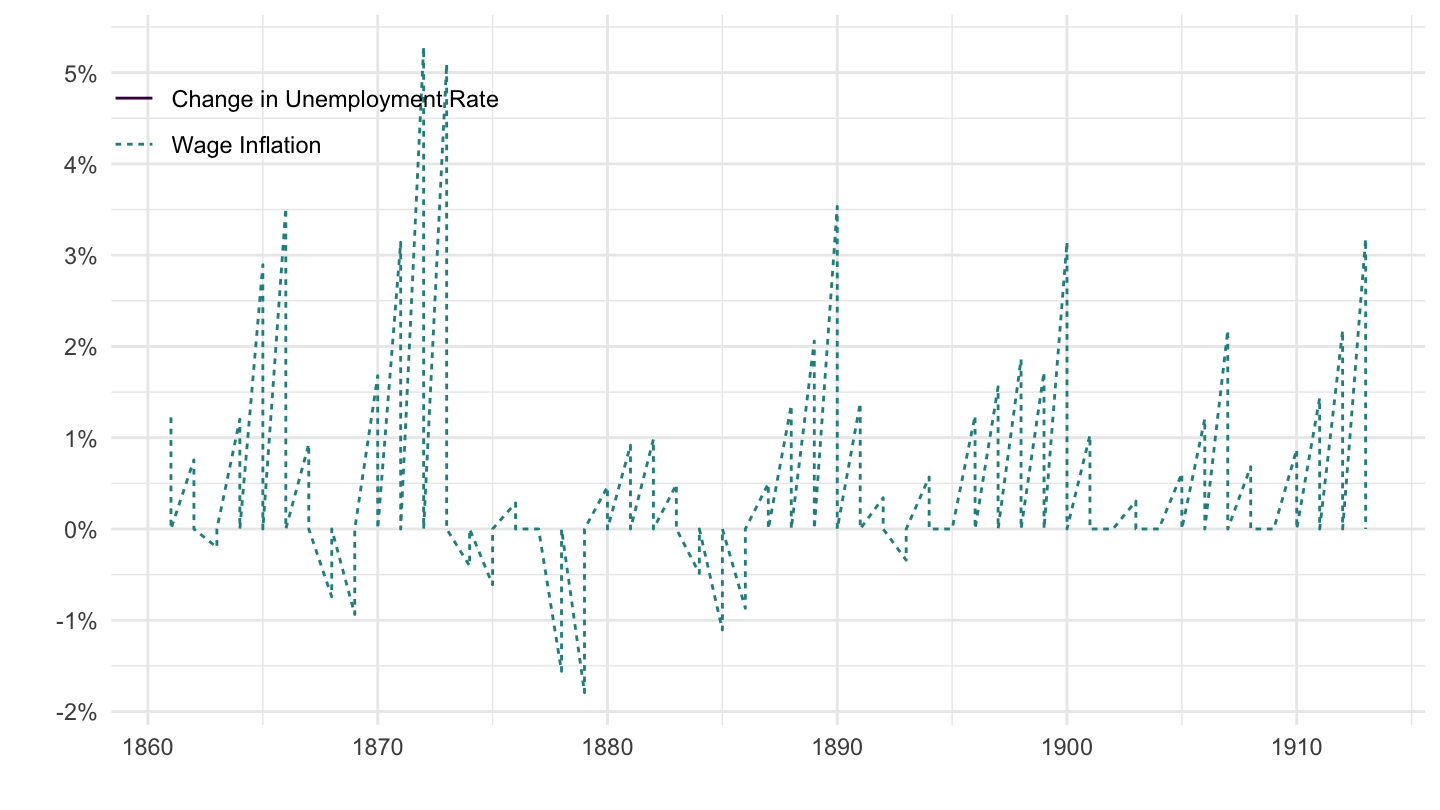
Exchange Rates
U.S. - Euro Nominal Exchange Rate
(ref:US-EUR-exchange-rate) U.S. - Euro Nominal Exchange Rate
Code
ig_d("fred", "xrates", "US-EUR-exchange-rate")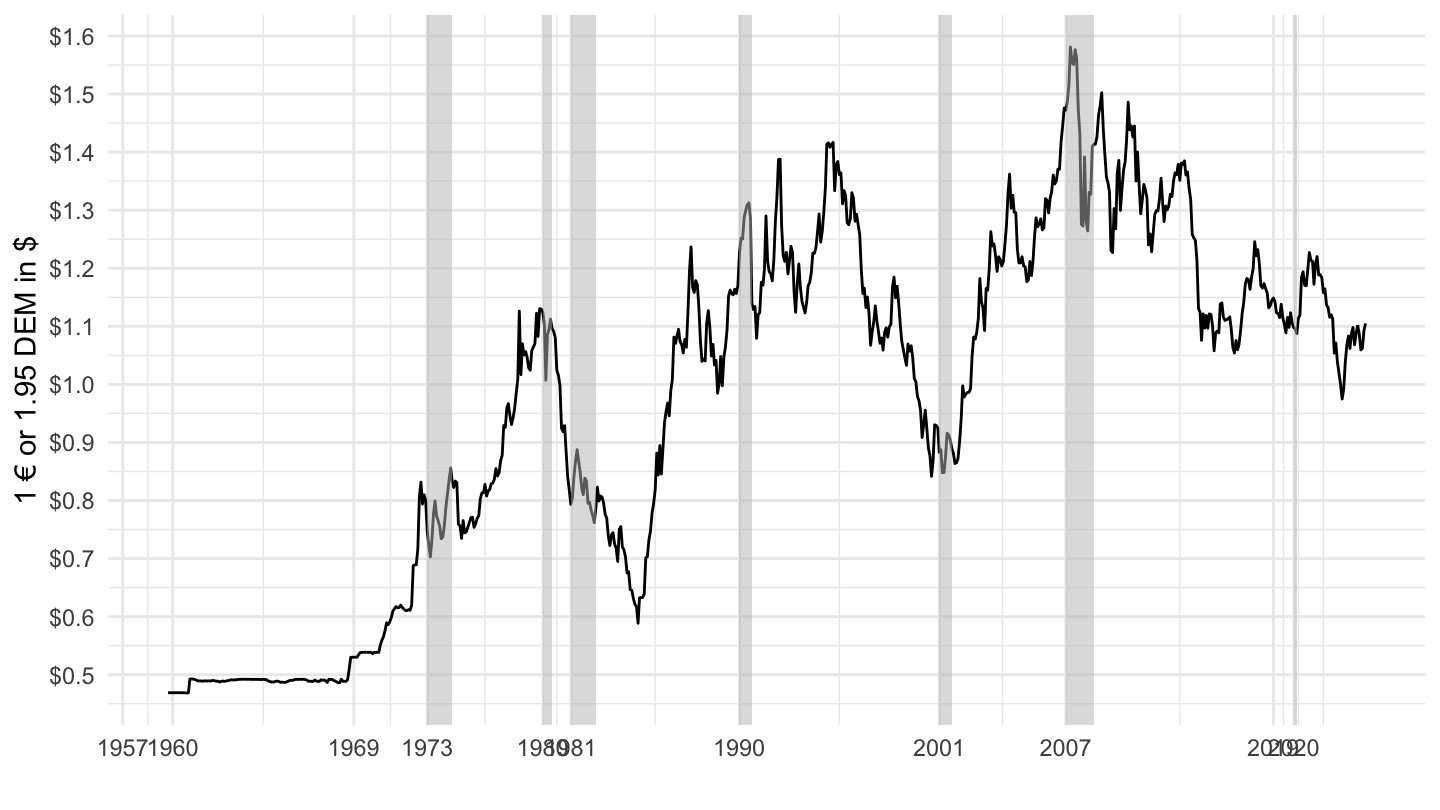
U.S. - U.K Nominal Exchange Rate
(ref:US-UK-exchange-rate) U.S. - U.K Nominal Exchange Rate
Code
ig_d("fred", "xrates", "US-UK-exchange-rate")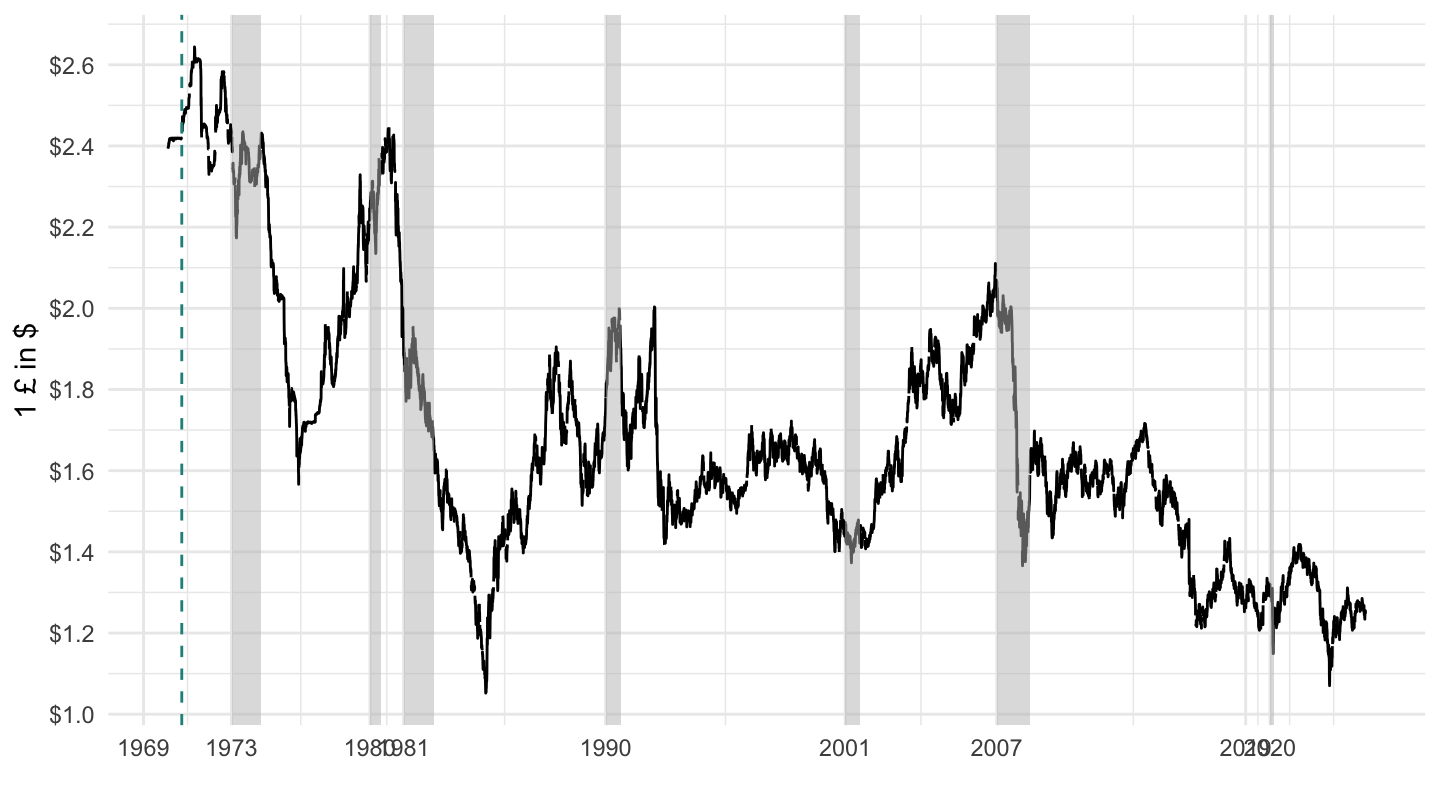
Manufacturing, Construction Employment
Manufacturing
Time Series
Code
ig_d("fred", "industry", "MANEMP")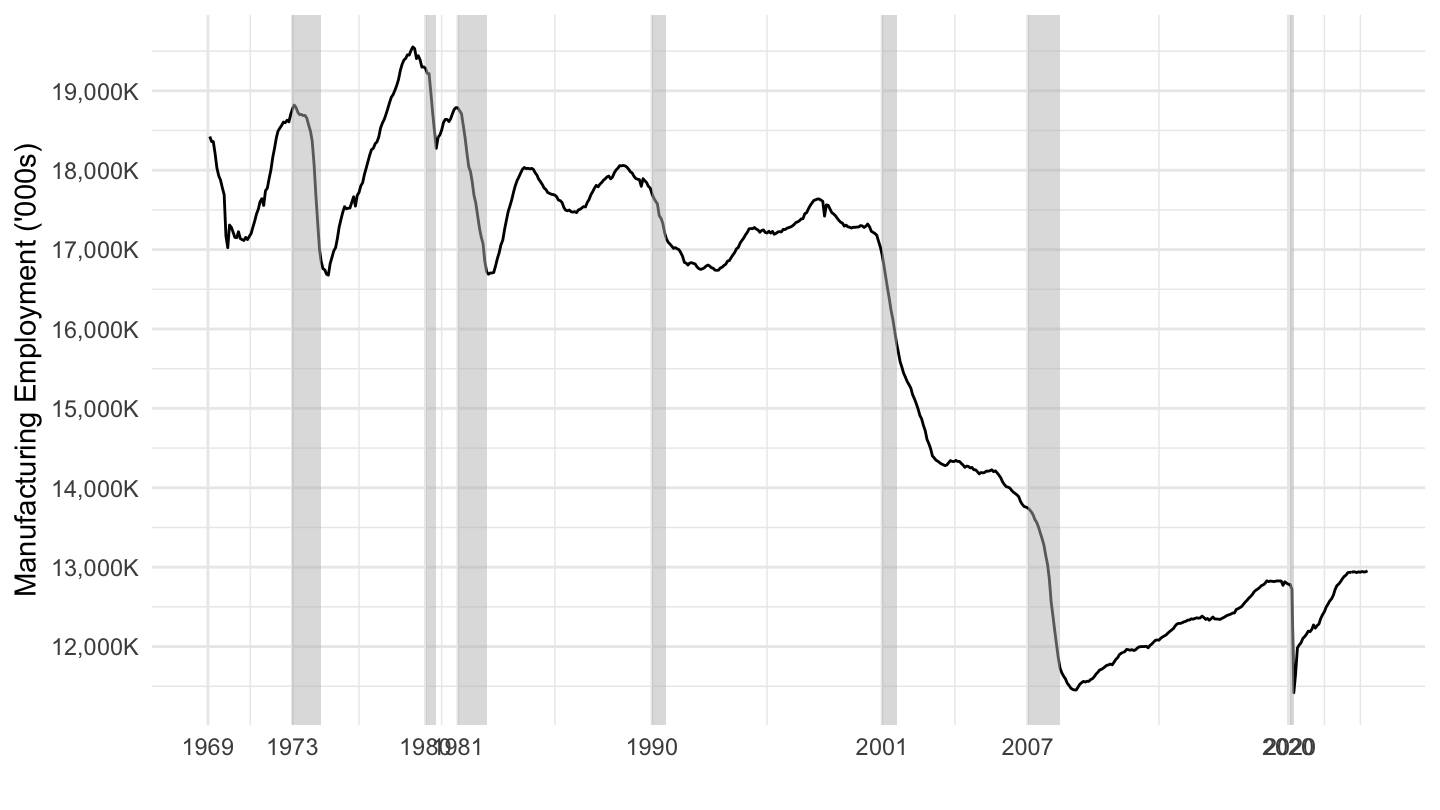
Presidents
Code
ig_d("fred", "industry", "MANEMP-presidents")
1953 -
Code
ig_d("fred", "industry", "MANEMP-USCONS")
Manufacturing Employment (%)
Code
ig_d("fred", "industry", "MANEMP-PAYEMS-USPRIV-share")
All Employees
Time Series
Code
ig_d("fred", "industry", "PAYEMS-USPRIV")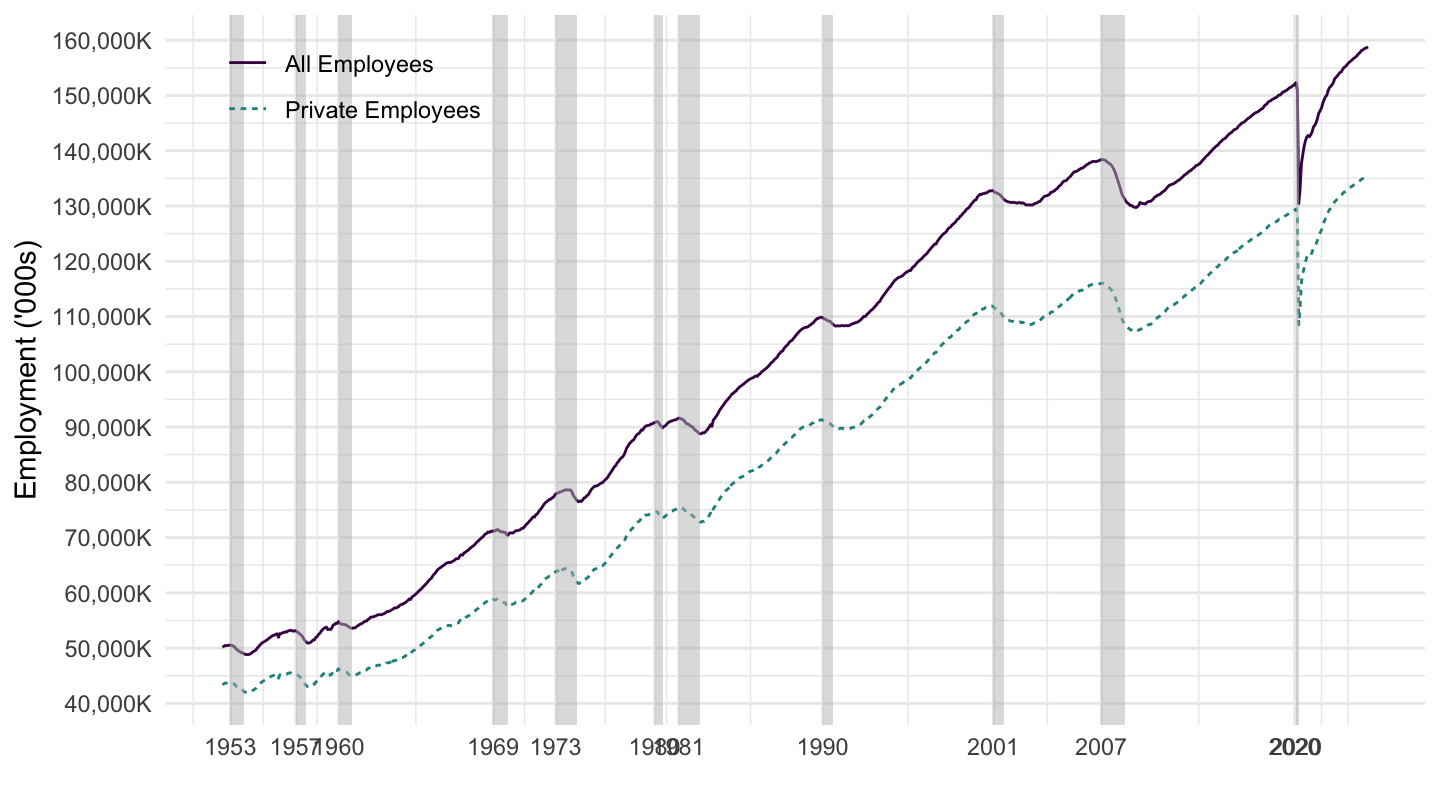
1969 -
Code
ig_d("fred", "industry", "MANEMP-USCONS-1969")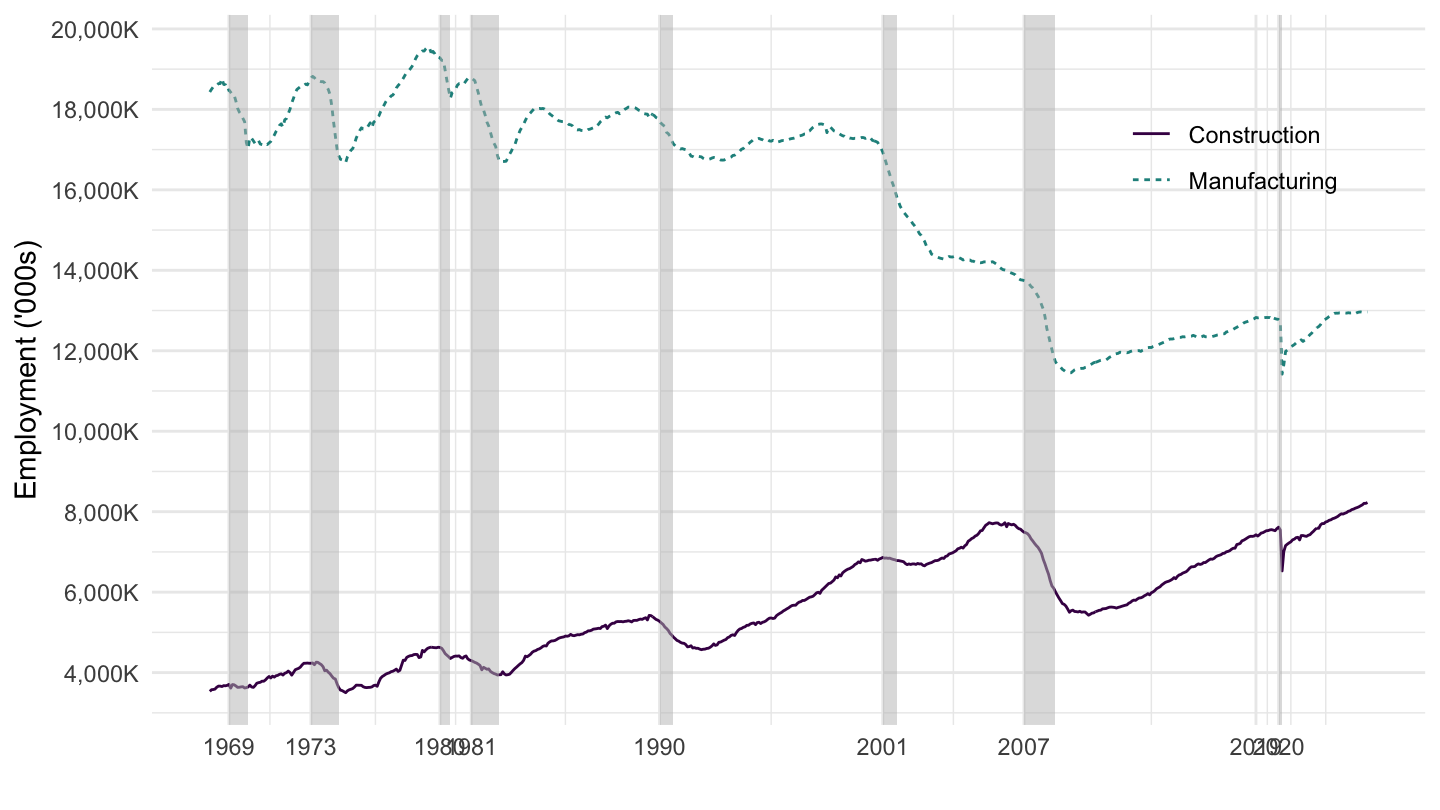
IRLTLT01ITM156N - Italian 10-year Government Bond Yields
Code
ig_d("fred", "r", "IRLTLT01ITM156N")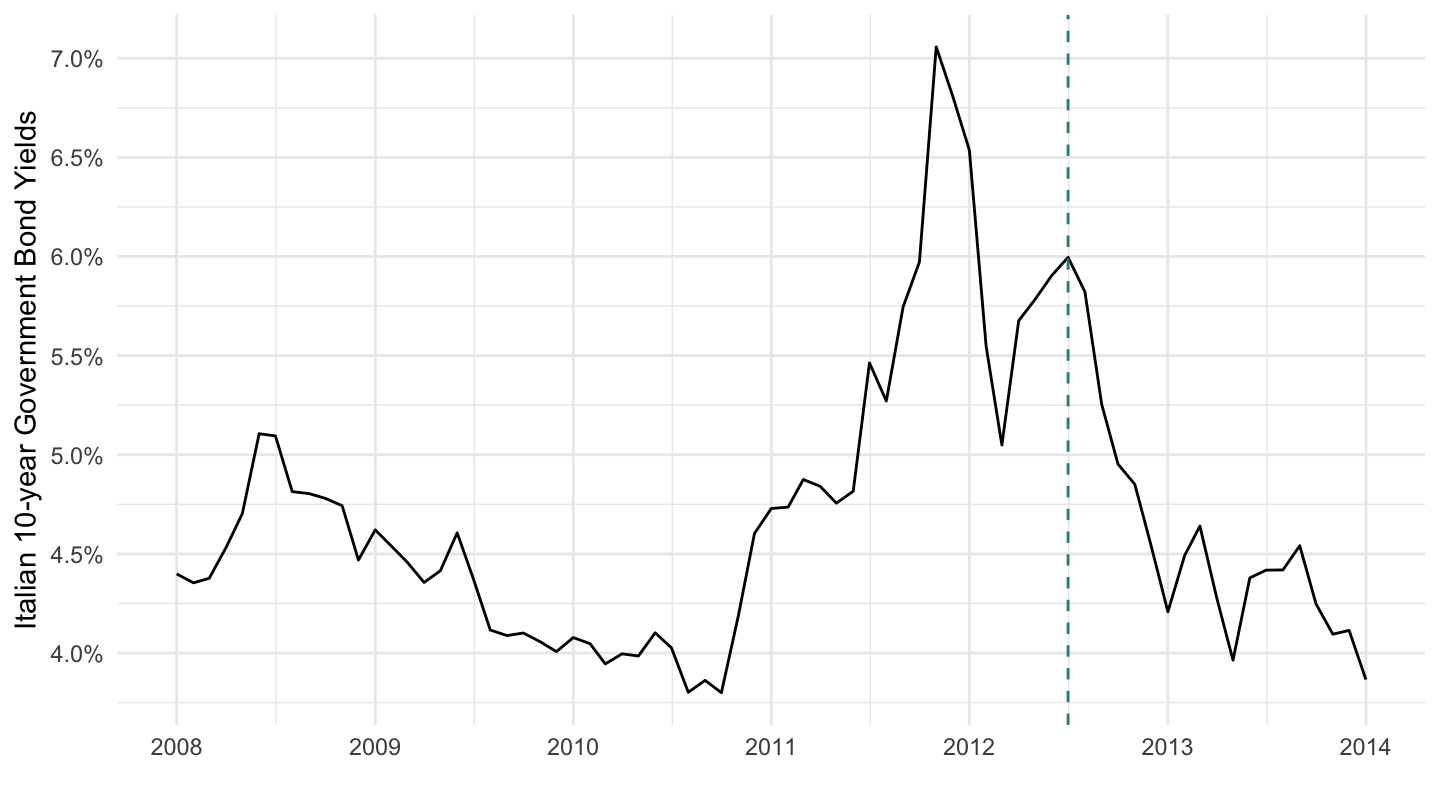
FYOIGDA188S - Interest Payments
Code
ig_d("fred", "r", "FYOIGDA188S")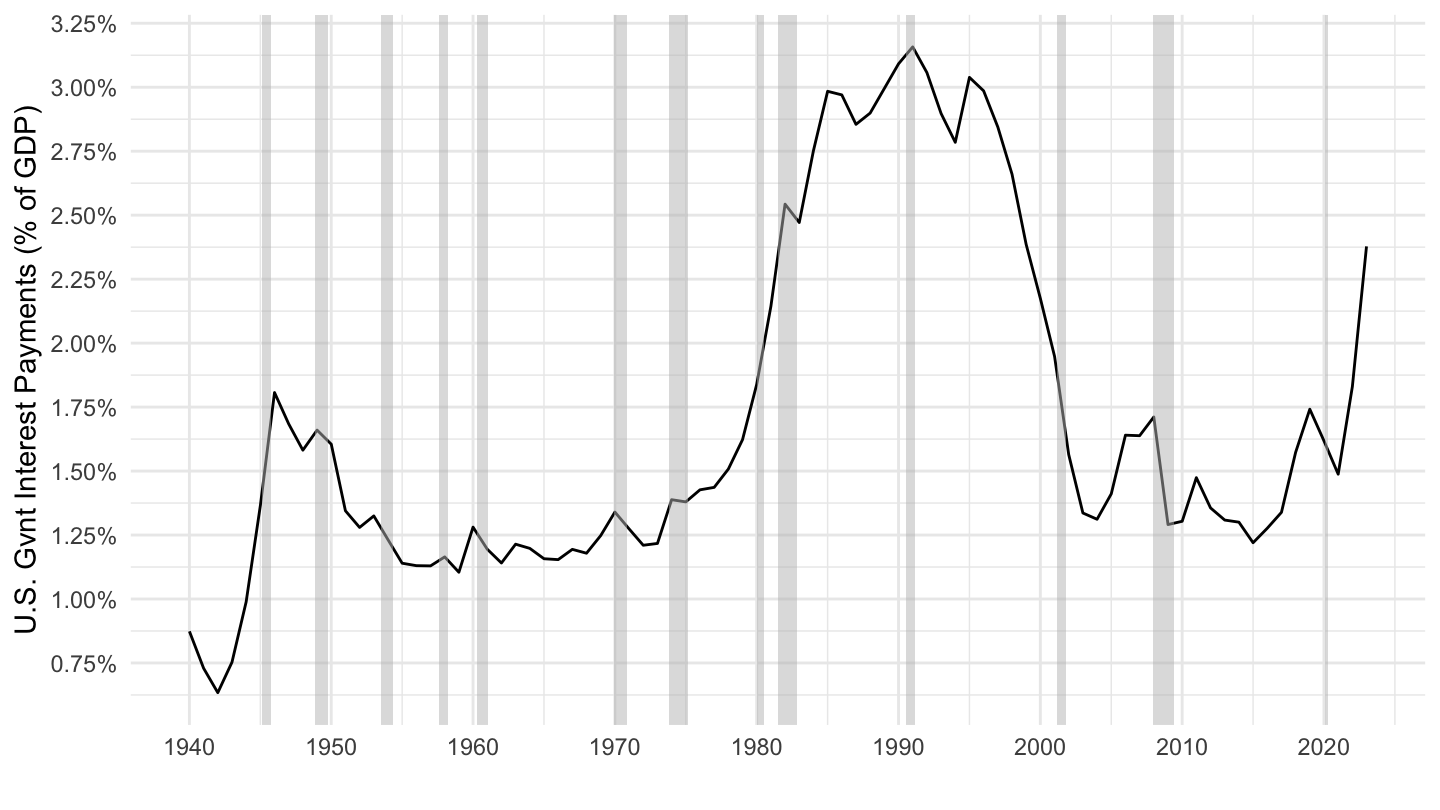
DGS - 10-Year Treasury Rate
Code
ig_d("fred", "r", "DGS10-DGS20-DGS30")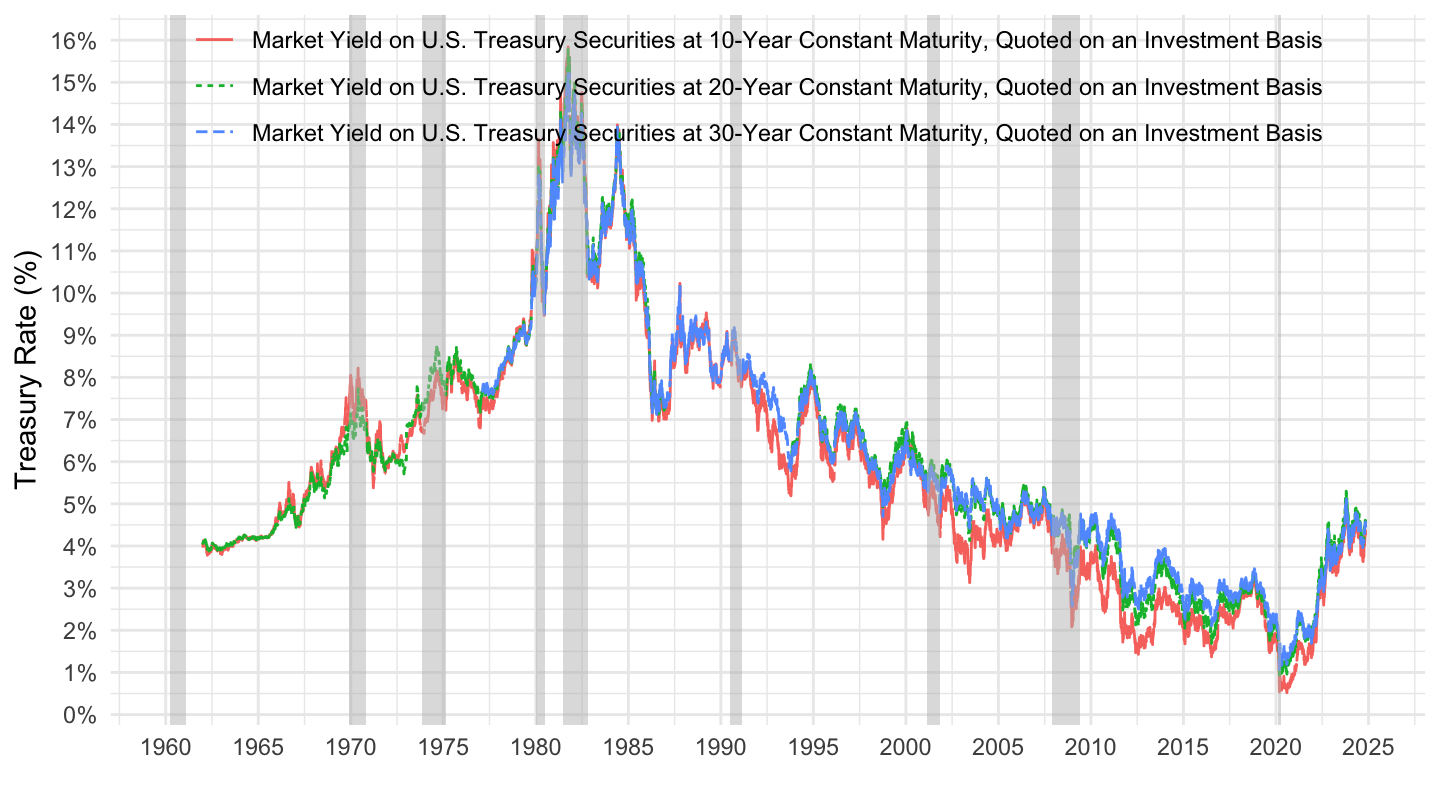
Code
ig_d("fred", "r", "DGS10-DGS20-DGS30-2000")
Code
ig_d("fred", "r", "DGS10-DGS20-DGS30-2010")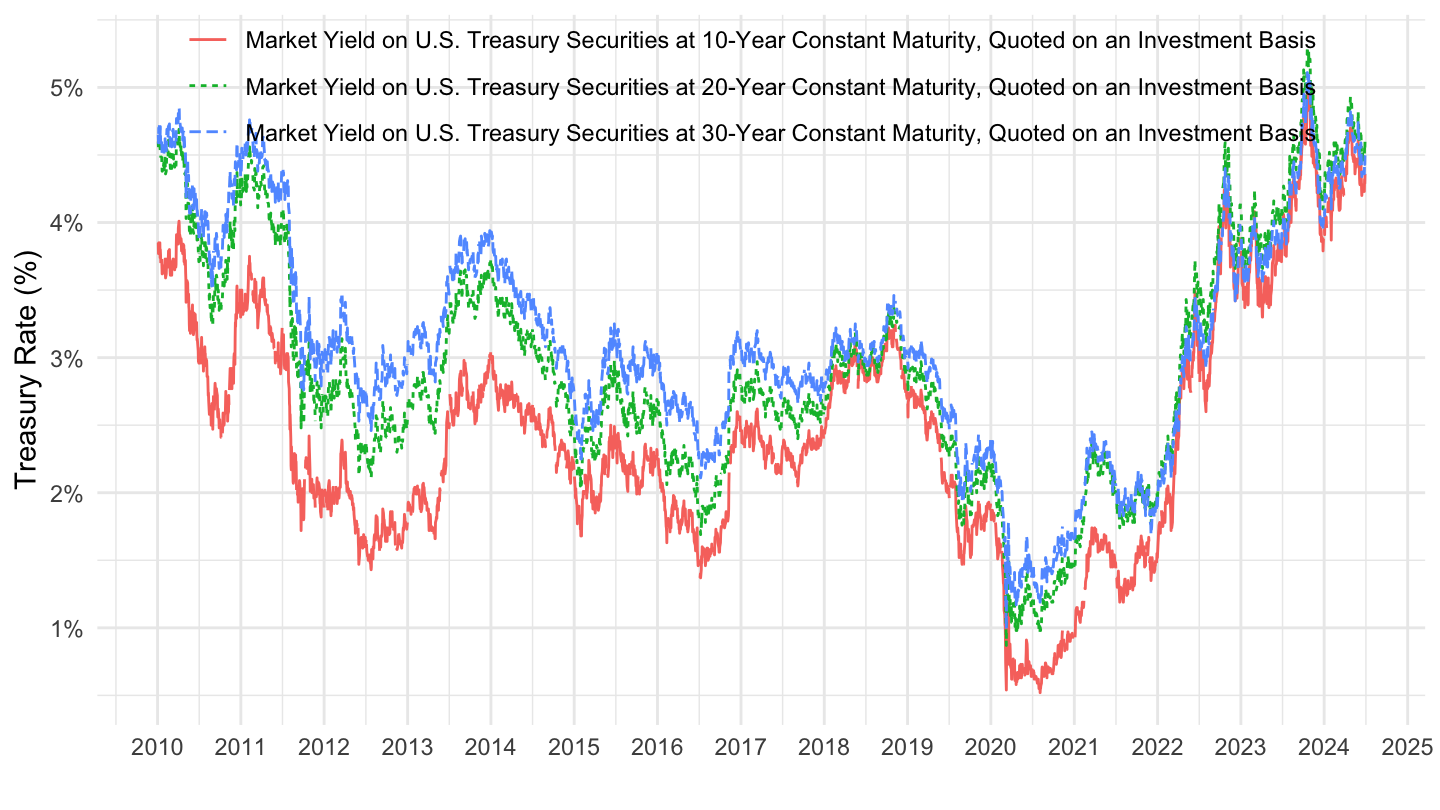
DFII - Treasury Inflation-Indexed Security
Code
ig_d("fred", "r", "DFII10-DFII20-DFII30")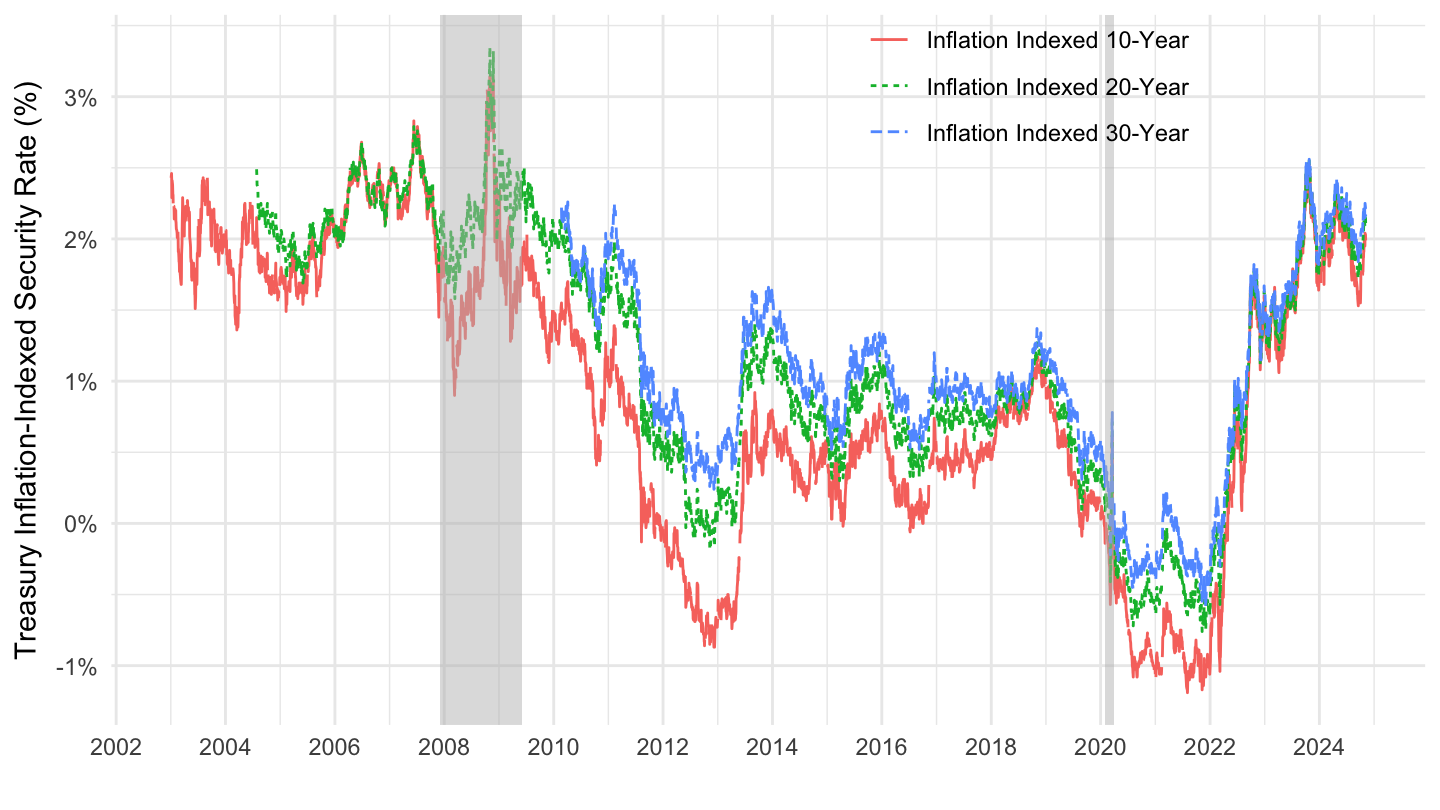
Oil
CPIAUCSL, WTISPLC
Code
ig_d("fred", "energy", "WTISPLC-CPIAUCSL")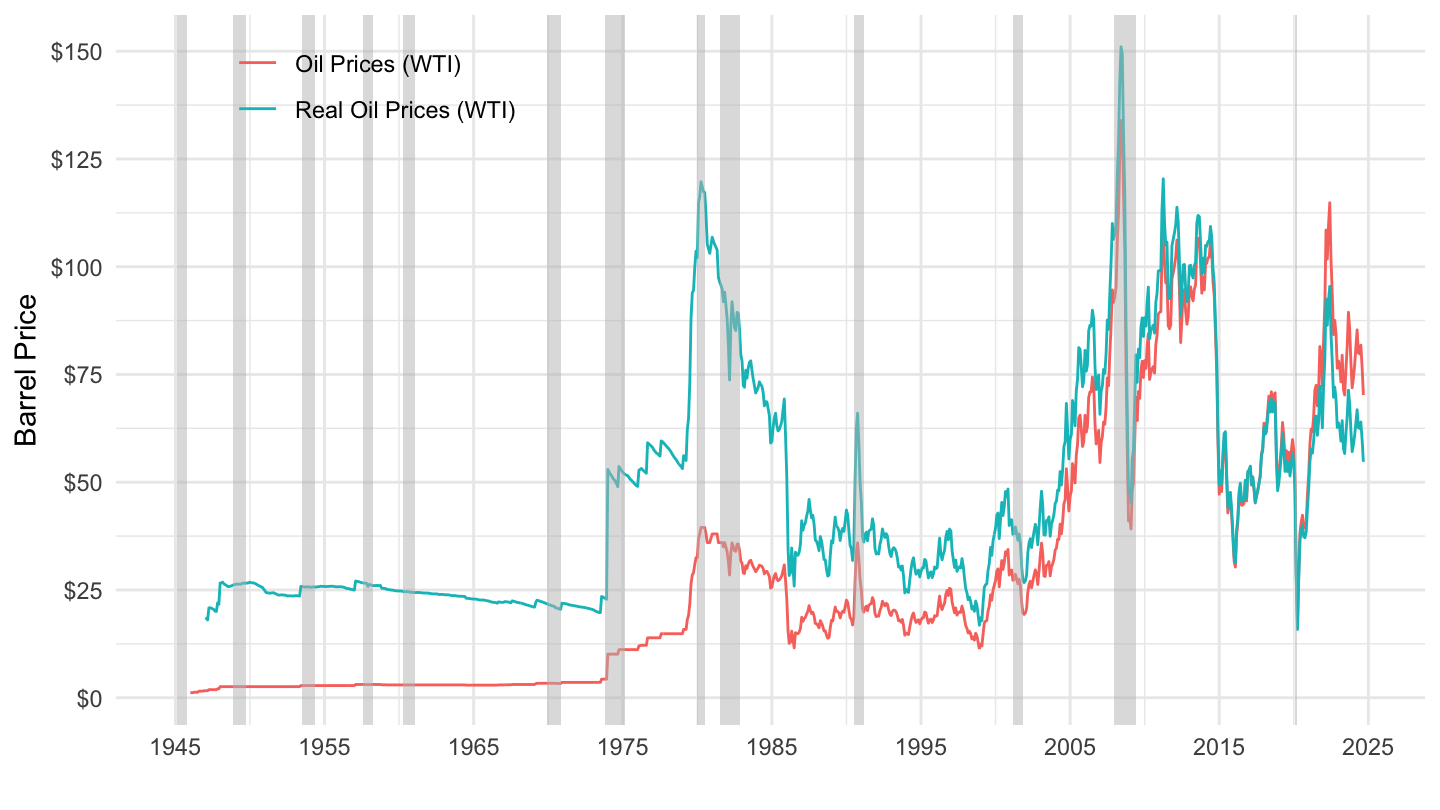
UNRATE - U.S. Unemployment Rate (Source: FRED)
Code
ig_d("fred", "unr", "UNRATE")