| LAST_DOWNLOAD |
|---|
| 2025-12-13 |
The Atlanta Fed’s Wage Growth Tracker - wage-growth-data
Data - FRB
Info
LAST_DOWNLOAD
LAST_COMPILE
| LAST_COMPILE |
|---|
| 2026-07-25 |
Last
| date | Nobs |
|---|---|
| 2025-09-01 | 16 |
date
Code
`wage-growth-data` %>%
  group_by(date) %>%
  summarise(Nobs = n()) %>%
  arrange(desc(date)) %>%
  print_table_conditional()
variable
Code
`wage-growth-data` %>%
  group_by(variable) %>%
  summarise(Nobs = n()) %>%
print_table_conditional()| variable | Nobs |
|---|---|
| Age 25-54 | 345 |
| College degree | 345 |
| Female | 345 |
| Full-time | 345 |
| Job Stayer | 345 |
| Job Switcher | 345 |
| Lower 1/2 of wage distn | 345 |
| Male | 345 |
| Overall | 345 |
| Overall: 25/20 trimmed mean | 345 |
| Overall: Weekly Basis | 345 |
| Overall: Weighted | 345 |
| Overall: Weighted 97 | 345 |
| Paid Hourly | 345 |
| Services | 345 |
| Upper 1/2 of wage distn | 345 |
Leisure and Hospitality, Overall
Nominal
Code
`wage-growth-data-industry` %>%
  filter(variable %in% c("Leisure and hospitality", "Overall")) %>%
  ggplot(.) + geom_line(aes(x = date, y = value/100, color = variable)) +
  theme_minimal() + ylab("Nominal Wage Growth (%)") + xlab("") +
  theme(legend.title = element_blank(),
        legend.position = c(0.85, 0.9)) +
  geom_rect(data = nber_recessions %>%
              filter(Peak > as.Date("1993-01-01")),
            aes(xmin = Peak, xmax = Trough, ymin = -Inf, ymax = +Inf),
            fill = 'grey', alpha = 0.5) +
  scale_color_manual(values = viridis(3)[1:2]) +
  scale_x_date(breaks = seq(1930, 2100, 2) %>% paste0("-01-01") %>% as.Date,
               labels = date_format("%Y")) +
  scale_y_continuous(breaks = 0.01*seq(-100, 700, 1),
                     labels = scales::percent_format(accuracy = 1))
Real
Code
`wage-growth-data-industry` %>%
  filter(variable %in% c("Leisure and hospitality", "Overall")) %>%
  left_join(inflation, by = "date") %>%
  mutate(value = value - inflation) %>%
  ggplot(.) + geom_line(aes(x = date, y = value/100, color = variable)) +
  theme_minimal() + ylab("Nominal Wage Growth (%)") + xlab("") +
  theme(legend.title = element_blank(),
        legend.position = c(0.85, 0.9)) +
  geom_rect(data = nber_recessions %>%
              filter(Peak > as.Date("1993-01-01")),
            aes(xmin = Peak, xmax = Trough, ymin = -Inf, ymax = +Inf),
            fill = 'grey', alpha = 0.5) +
  scale_color_manual(values = viridis(3)[1:2]) +
  scale_x_date(breaks = seq(1930, 2100, 2) %>% paste0("-01-01") %>% as.Date,
               labels = date_format("%Y")) +
  scale_y_continuous(breaks = 0.01*seq(-100, 700, 1),
                     labels = scales::percent_format(accuracy = 1)) +
  geom_hline(yintercept = 0, linetype = "dashed")
Services, Unweighted overall
Nominal
Code
`wage-growth-data` %>%
  filter(variable %in% c("Services", "Weighted Overall")) %>%
  ggplot(.) + geom_line(aes(x = date, y = value/100, color = variable)) +
  theme_minimal() + ylab("Nominal Wage Growth (%)") + xlab("") +
  theme(legend.title = element_blank(),
        legend.position = c(0.2, 0.2)) +
  geom_rect(data = nber_recessions %>%
              filter(Peak > as.Date("1993-01-01")),
            aes(xmin = Peak, xmax = Trough, ymin = -Inf, ymax = +Inf),
            fill = 'grey', alpha = 0.5) +
  scale_color_manual(values = viridis(3)[1:2]) +
  scale_x_date(breaks = seq(1930, 2100, 2) %>% paste0("-01-01") %>% as.Date,
               labels = date_format("%Y")) +
  scale_y_continuous(breaks = 0.01*seq(-100, 700, 1),
                     labels = scales::percent_format(accuracy = 1))
Real
Code
`wage-growth-data` %>%
  filter(variable %in% c("Services", "Weighted Overall")) %>%
  left_join(inflation, by = "date") %>%
  mutate(value = value - inflation) %>%
  ggplot(.) + geom_line(aes(x = date, y = value/100, color = variable)) +
  theme_minimal() + ylab("Nominal Wage Growth (%)") + xlab("") +
  theme(legend.title = element_blank(),
        legend.position = c(0.2, 0.2)) +
  geom_rect(data = nber_recessions %>%
              filter(Peak > as.Date("1993-01-01")),
            aes(xmin = Peak, xmax = Trough, ymin = -Inf, ymax = +Inf),
            fill = 'grey', alpha = 0.5) +
  scale_color_manual(values = viridis(3)[1:2]) +
  scale_x_date(breaks = seq(1930, 2100, 2) %>% paste0("-01-01") %>% as.Date,
               labels = date_format("%Y")) +
  scale_y_continuous(breaks = 0.01*seq(-100, 700, 1),
                     labels = scales::percent_format(accuracy = 1)) +
  geom_hline(yintercept = 0, linetype = "dashed")
Job-stayer, Job-switcher
Nominal
Code
`wage-growth-data` %>%
  filter(variable %in% c("Job Stayer", "Job Switcher")) %>%
  ggplot(.) + geom_line(aes(x = date, y = value/100, color = variable)) +
  theme_minimal() + ylab("Nominal Wage Growth (%)") + xlab("") +
  theme(legend.title = element_blank(),
        legend.position = c(0.85, 0.9)) +
  geom_rect(data = nber_recessions %>%
              filter(Peak > as.Date("1993-01-01")),
            aes(xmin = Peak, xmax = Trough, ymin = -Inf, ymax = +Inf),
            fill = 'grey', alpha = 0.5) +
  scale_color_manual(values = viridis(3)[1:2]) +
  scale_x_date(breaks = seq(1930, 2100, 2) %>% paste0("-01-01") %>% as.Date,
               labels = date_format("%Y")) +
  scale_y_continuous(breaks = 0.01*seq(-100, 700, 1),
                     labels = scales::percent_format(accuracy = 1))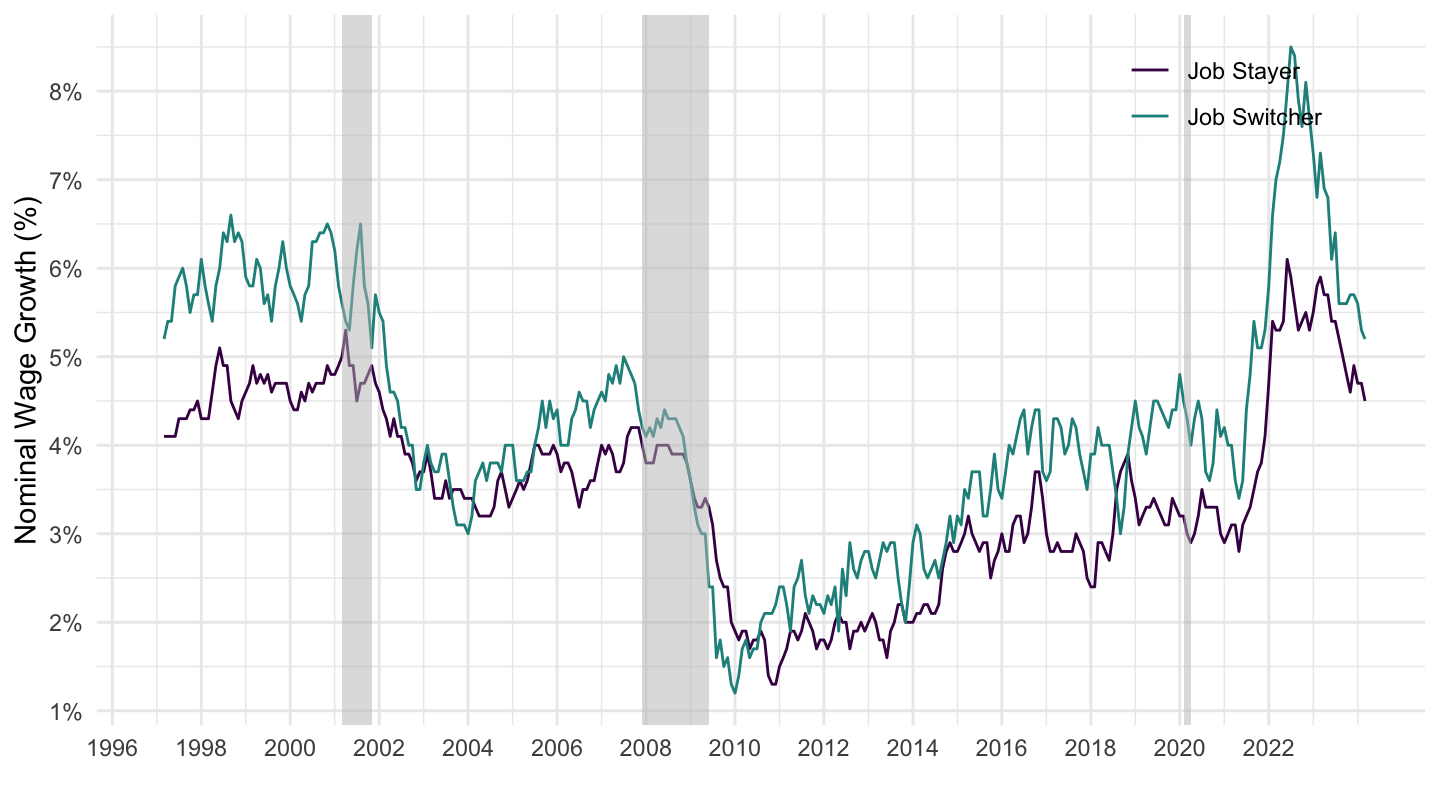
Real
Code
`wage-growth-data` %>%
  filter(variable %in% c("Job Stayer", "Job Switcher")) %>%
  left_join(inflation, by = "date") %>%
  mutate(value = value - inflation) %>%
  ggplot(.) + geom_line(aes(x = date, y = (value)/100, color = variable)) +
  theme_minimal() + ylab("Real Wage Growth (%)") + xlab("") +
  theme(legend.title = element_blank(),
        legend.position = c(0.2, 0.2)) +
  geom_rect(data = nber_recessions %>%
              filter(Peak > as.Date("1993-01-01")),
            aes(xmin = Peak, xmax = Trough, ymin = -Inf, ymax = +Inf),
            fill = 'grey', alpha = 0.5) +
  scale_color_manual(values = viridis(3)[1:2]) +
  scale_x_date(breaks = seq(1930, 2100, 2) %>% paste0("-01-01") %>% as.Date,
               labels = date_format("%Y")) +
  scale_y_continuous(breaks = 0.01*seq(-100, 700, 1),
                     labels = scales::percent_format(accuracy = 1)) +
  geom_hline(yintercept = 0, linetype = "dashed")
Full-time, Unweighted Overall
Code
`wage-growth-data` %>%
  filter(variable %in% c("Unweighted Overall", "Full-time")) %>%
  ggplot(.) + geom_line(aes(x = date, y = value/100, color = variable)) +
  theme_minimal() + ylab("Wage Growth (%)") + xlab("") +
  theme(legend.title = element_blank(),
        legend.position = c(0.85, 0.9)) +
  geom_rect(data = nber_recessions %>%
              filter(Peak > as.Date("1993-01-01")),
            aes(xmin = Peak, xmax = Trough, ymin = -Inf, ymax = +Inf),
            fill = 'grey', alpha = 0.5) +
  scale_color_manual(values = viridis(3)[1:2]) +
  scale_x_date(breaks = seq(1930, 2100, 2) %>% paste0("-01-01") %>% as.Date,
               labels = date_format("%Y")) +
  scale_y_continuous(breaks = 0.01*seq(-100, 700, 1),
                     labels = scales::percent_format(accuracy = 1))
Unweighted Overall
Code
`wage-growth-data` %>%
  filter(variable == "Unweighted Overall") %>%
  ggplot(.) + geom_line(aes(x = date, y = value/100)) +
  theme_minimal() + ylab("Unweighted Overall Wage Growth (%)") + xlab("") +
  geom_rect(data = nber_recessions %>%
              filter(Peak > as.Date("1993-01-01")),
            aes(xmin = Peak, xmax = Trough, ymin = -Inf, ymax = +Inf),
            fill = 'grey', alpha = 0.5) +
  scale_x_date(breaks = seq(1930, 2100, 2) %>% paste0("-01-01") %>% as.Date,
               labels = date_format("%Y")) +
  scale_y_continuous(breaks = 0.01*seq(-100, 700, 1),
                     labels = scales::percent_format(accuracy = 1))
Services, Unweighted Overall
Code
`wage-growth-data` %>%
  filter(variable == "Services") %>%
  ggplot(.) + geom_line(aes(x = date, y = value/100)) +
  theme_minimal() + ylab("Services Wage Growth (%)") + xlab("") +
  geom_rect(data = nber_recessions %>%
              filter(Peak > as.Date("1993-01-01")),
            aes(xmin = Peak, xmax = Trough, ymin = -Inf, ymax = +Inf),
            fill = 'grey', alpha = 0.5) +
  scale_x_date(breaks = seq(1930, 2100, 2) %>% paste0("-01-01") %>% as.Date,
               labels = date_format("%Y")) +
  scale_y_continuous(breaks = 0.01*seq(-100, 700, 1),
                     labels = scales::percent_format(accuracy = 1))
Full-time
Code
`wage-growth-data` %>%
  filter(variable == "Full-time") %>%
  ggplot(.) + geom_line(aes(x = date, y = value/100)) +
  theme_minimal() + ylab("Full-time Wage Growth (%)") + xlab("") +
  geom_rect(data = nber_recessions %>%
              filter(Peak > as.Date("1993-01-01")),
            aes(xmin = Peak, xmax = Trough, ymin = -Inf, ymax = +Inf),
            fill = 'grey', alpha = 0.5) +
  scale_x_date(breaks = seq(1930, 2100, 2) %>% paste0("-01-01") %>% as.Date,
               labels = date_format("%Y")) +
  scale_y_continuous(breaks = 0.01*seq(-100, 700, 1),
                     labels = scales::percent_format(accuracy = 1))