Last observation: 2025 (N = 30)
First observation: 1995 (N = 2)
Last data update: 04 oct. 2026, 22:52
Last compile: 05 oct. 2026, 00:12
tipsbp10 |>
  filter(geo %in% c("DE", "ES", "FR", "IT", "NL")) |>
  year_to_date() |>

  add_flag_color("Geo") |>
  mutate(values = values/100) |>
  ggplot() + geom_line(aes(x = date, y = values, color = color)) + theme_minimal() +
  scale_color_identity() + add_flags +
  scale_x_date(breaks = as.Date(paste0(seq(1960, 2100, 2), "-01-01")),
               labels = date_format("%Y")) +
  xlab("") + ylab("Current account balance - 3 year average") +
  scale_y_continuous(breaks = 0.01*seq(-100, 200, 2),
                     labels = scales::percent_format(accuracy = 1)) +
  geom_hline(yintercept = 0.06, linetype = "dashed") +
  geom_hline(yintercept = -0.04, linetype = "dashed")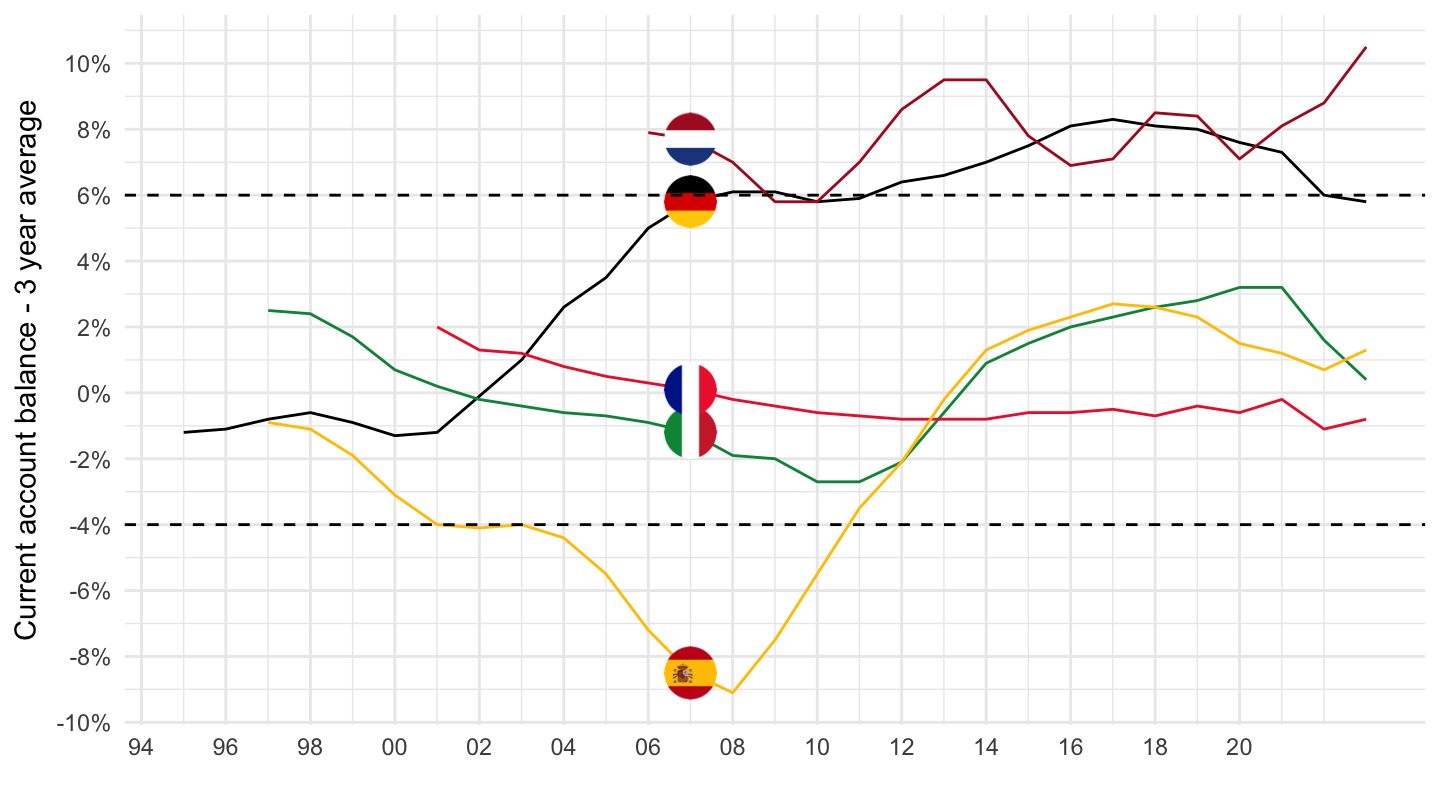
tipsbp10 |>
  filter(geo %in% c("FR", "DE", "PT", "ES", "IT")) |>
  year_to_date() |>

  add_flag_color("Geo") |>
  mutate(values = values/100) |>
  ggplot() + geom_line(aes(x = date, y = values, color = color)) + theme_minimal() +
  scale_color_identity() + add_flags +
  scale_x_date(breaks = as.Date(paste0(seq(1960, 2100, 2), "-01-01")),
               labels = date_format("%Y")) +
  xlab("") + ylab("Current account balance - 3 year average") +
  scale_y_continuous(breaks = 0.01*seq(-100, 200, 2),
                     labels = scales::percent_format(accuracy = 1))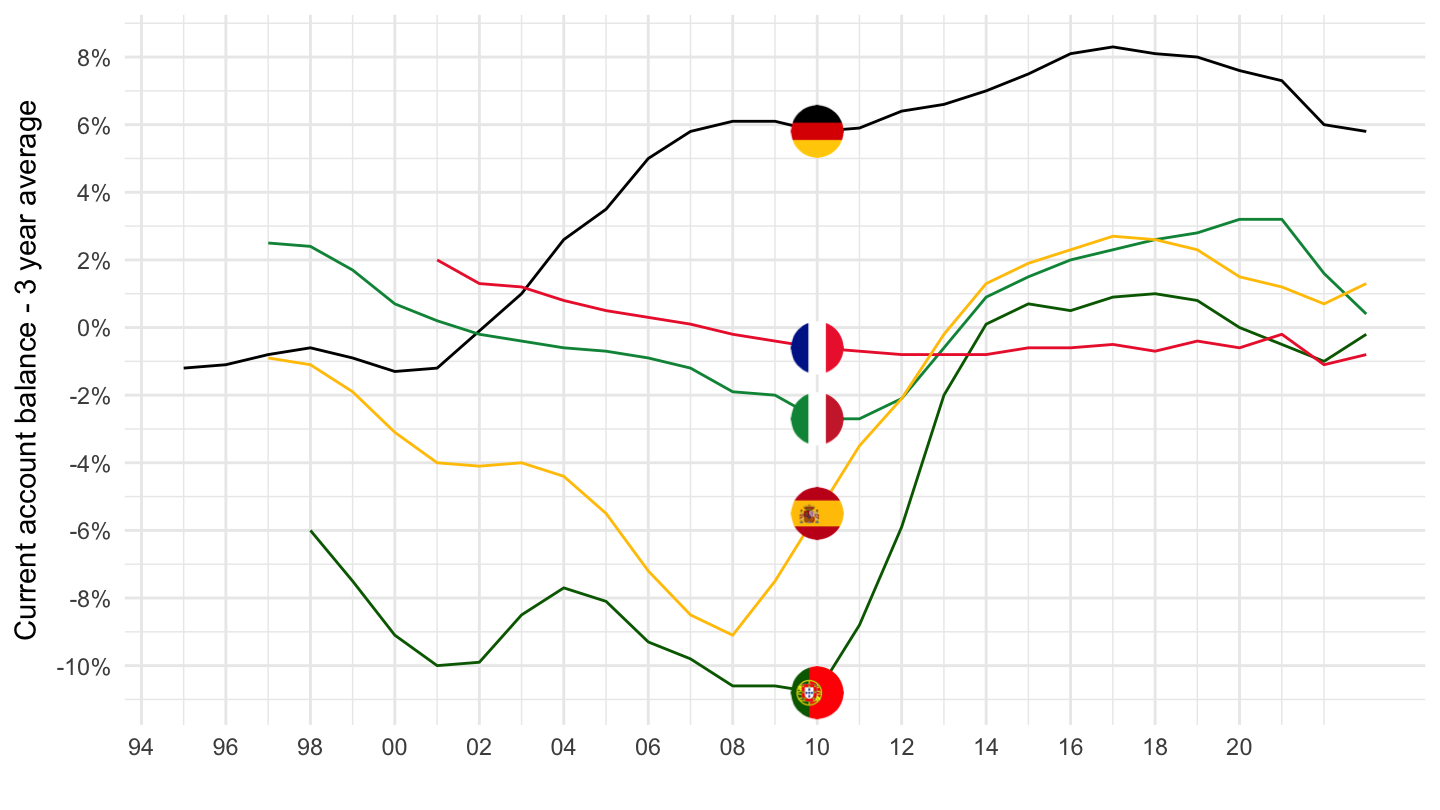
tipsbp10 |>
  filter(geo %in% c("FR", "DE", "PT")) |>
  year_to_date() |>

  add_flag_color("Geo") |>
  mutate(values = values/100) |>
  ggplot() + geom_line(aes(x = date, y = values, color = color)) + theme_minimal() +
  scale_color_identity() + add_flags +
  scale_x_date(breaks = as.Date(paste0(seq(1960, 2100, 2), "-01-01")),
               labels = date_format("%Y")) +
  xlab("") + ylab("Current account balance - 3 year average") +
  scale_y_continuous(breaks = 0.01*seq(-100, 200, 2),
                     labels = scales::percent_format(accuracy = 1))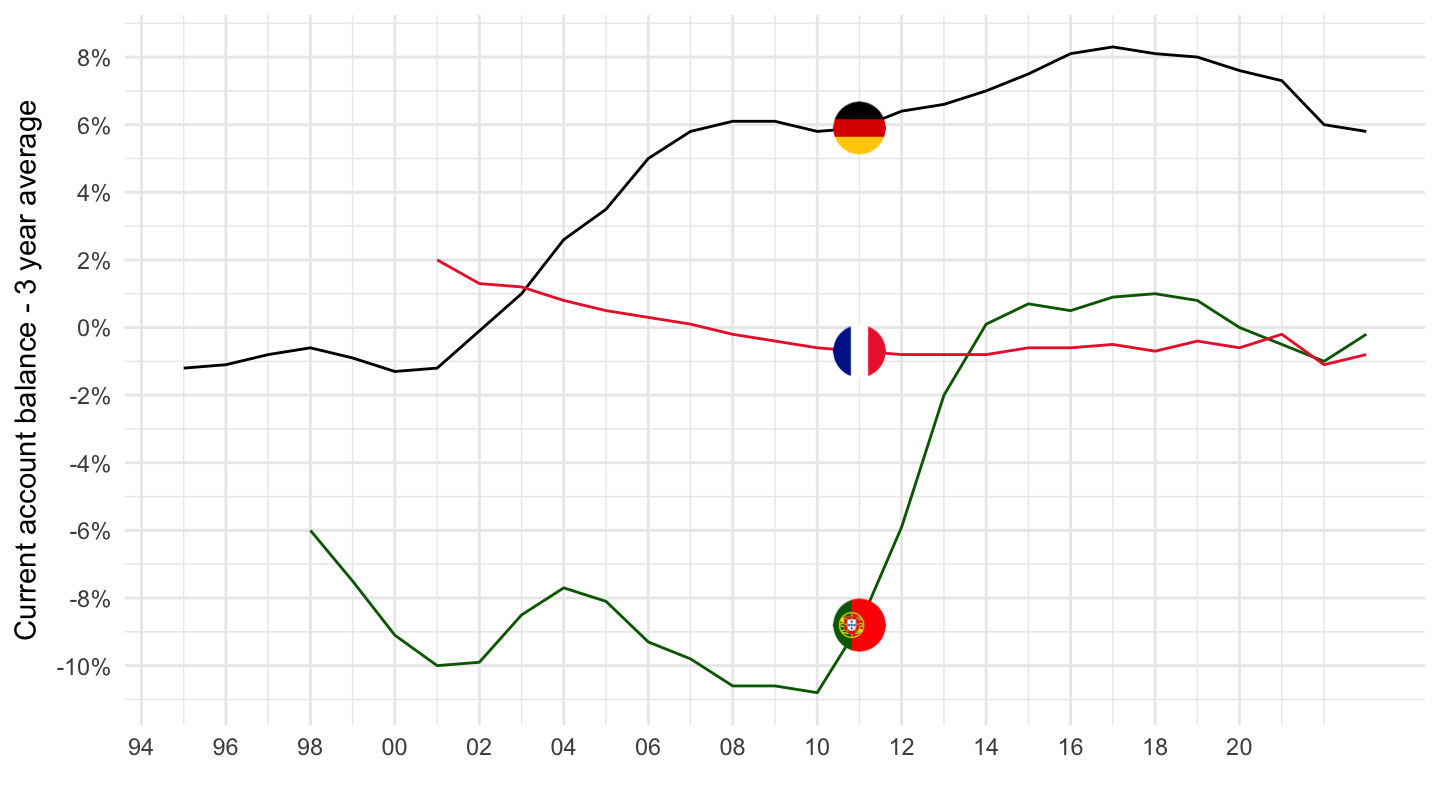
tipsbp10 |>
  filter(geo %in% c("PL", "HU", "SI")) |>
  year_to_date() |>

  add_flag_color("Geo") |>
  mutate(values = values/100) |>
  ggplot() + geom_line(aes(x = date, y = values, color = color)) + theme_minimal() +
  scale_color_identity() + add_flags +
  scale_x_date(breaks = as.Date(paste0(seq(1960, 2100, 2), "-01-01")),
               labels = date_format("%Y")) +
  xlab("") + ylab("Current account balance - 3 year average") +
  scale_y_continuous(breaks = 0.01*seq(-100, 200, 2),
                     labels = scales::percent_format(accuracy = 1))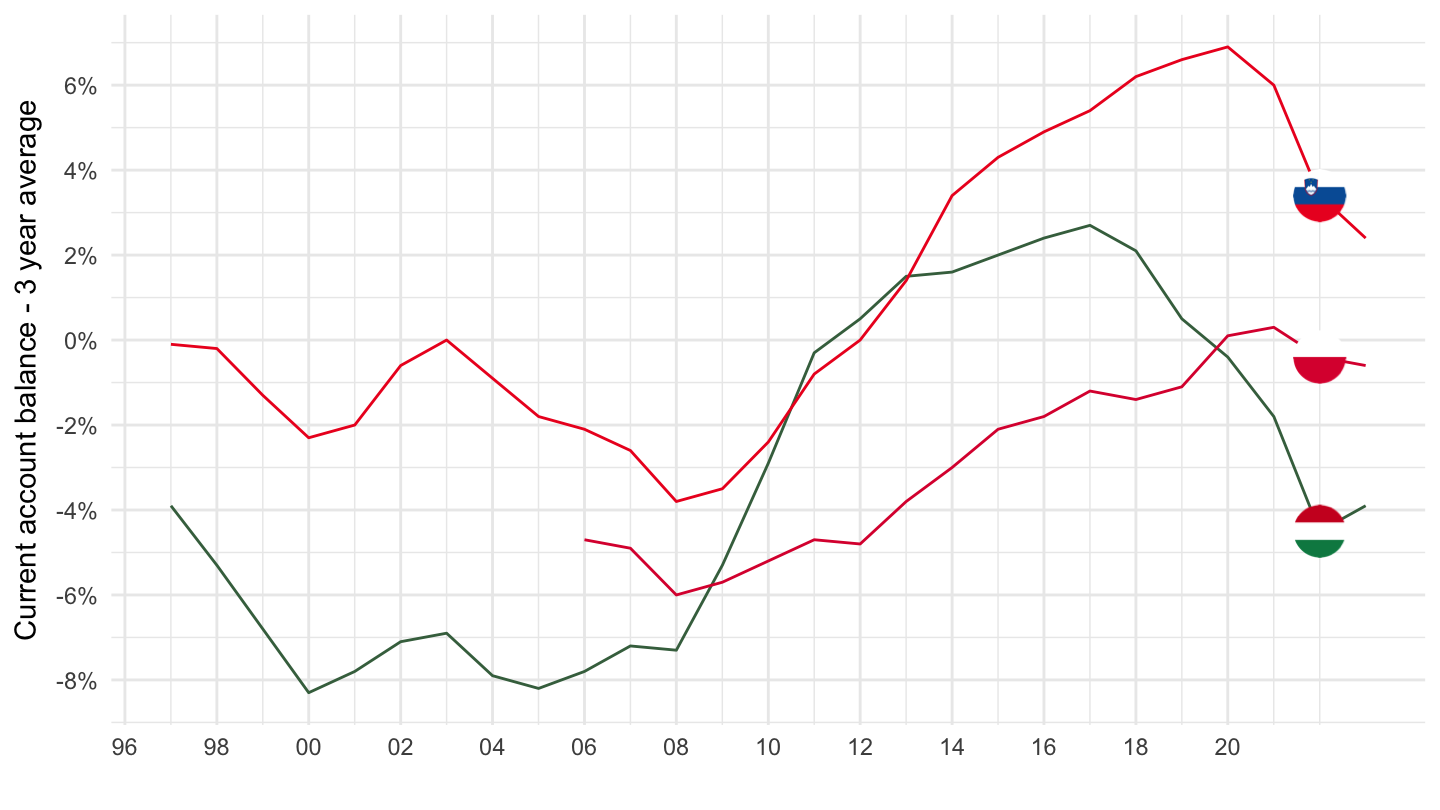
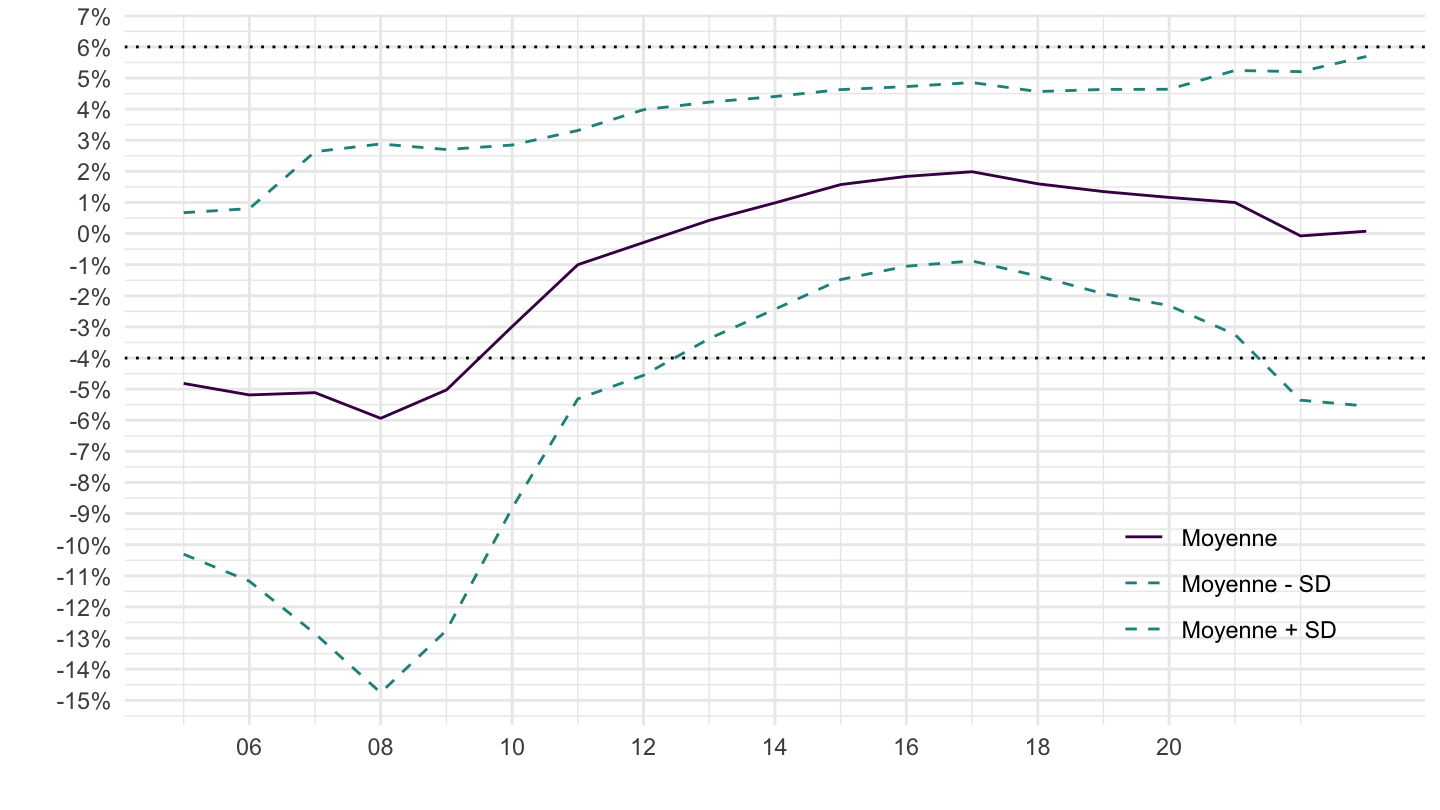
tipsbp10 |>
  year_to_date() |>
  filter(date >= as.Date("2005-01-01")) |>
  group_by(date) |>
  summarise(`Moyenne` = mean(values),
            `Ecart Type` = sd(values)) |>
  transmute(date, `Moyenne`,
            `Moyenne + SD` = `Moyenne` + `Ecart Type`,
            `Moyenne - SD` = `Moyenne` - `Ecart Type`) |>
  gather(variable, value, -date) |>
  mutate(value = value/100) |>
  ggplot() + geom_line(aes(x = date, y = value, color = variable, linetype = variable)) +
  theme_minimal() + xlab("") + ylab("") +
  scale_color_manual(values = c(viridis(3)[1], viridis(3)[2], viridis(3)[2])) +
  scale_linetype_manual(values = c("solid", "dashed", "dashed")) +
  scale_x_date(breaks = as.Date(paste0(seq(1960, 2100, 2), "-01-01")),
               labels = date_format("%Y")) +
  scale_y_continuous(breaks = 0.01*seq(-100, 200, 1),
                     labels = scales::percent_format(accuracy = 1)) +
  theme(legend.position = c(0.25, 0.9),
        legend.title = element_blank()) +
  geom_hline(yintercept = 0.06, linetype = "dotted") +
  geom_hline(yintercept = -0.04, linetype = "dotted")
tipsbp10 |>
  year_to_date() |>
  filter(date >= as.Date("2005-01-01")) |>
  group_by(date) |>
  summarise(`Moyenne` = mean(values),
            `Ecart Type` = sd(values)) |>
  transmute(date, `Moyenne`,
            `Moyenne + SD` = `Moyenne` + `Ecart Type`,
            `Moyenne - SD` = `Moyenne` - `Ecart Type`) |>
  gather(variable, value, -date) |>
  mutate(value = value/100) |>
  ggplot() + geom_line(aes(x = date, y = value, color = variable, linetype = variable)) +
  theme_minimal() + xlab("") + ylab("") +
  scale_color_manual(values = c("#003399", "#FFCC00", "#FFCC00")) +
  scale_linetype_manual(values = c("solid", "dashed", "dashed")) +
  scale_x_date(breaks = as.Date(paste0(seq(1960, 2100, 1), "-01-01")),
               labels = date_format("%Y")) +
  scale_y_continuous(breaks = 0.01*seq(-100, 200, 1),
                     labels = scales::percent_format(accuracy = 1)) +
  theme(legend.position = c(0.25, 0.9),
        legend.title = element_blank()) +
  geom_hline(yintercept = 0.06, linetype = "dotted") +
  geom_hline(yintercept = -0.04, linetype = "dotted")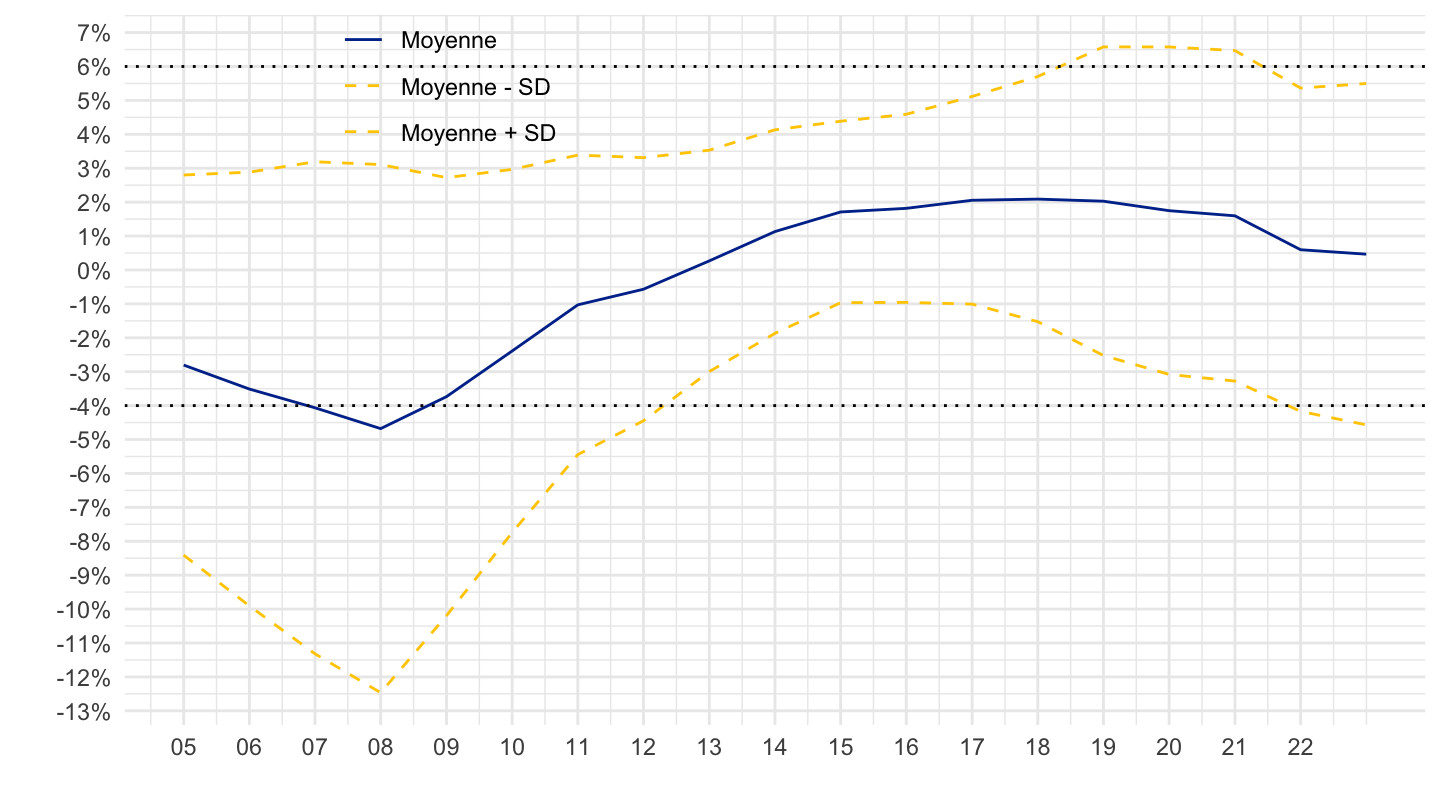
tipsbp10 |>
  year_to_date() |>
  filter(date >= as.Date("2005-01-01")) |>
  group_by(date) |>
  summarise(`Moyenne Europe` = mean(values),
            `Ecart Type` = sd(values),
            `France` = values[geo == "FR"]) |>
  transmute(date, `Moyenne Europe`,
            `Moyenne Europe + SD` = `Moyenne Europe` + `Ecart Type`,
            `Moyenne Europe - SD` = `Moyenne Europe` - `Ecart Type`,
             `France`) |>
  gather(variable, value, -date) |>
  mutate(values = value/100,
         Geo = ifelse(variable == "France", "France", "Europe")) |>
  ggplot() + geom_line(aes(x = date, y = values, color = variable, linetype = variable)) +
  theme_minimal() + xlab("") + ylab("") + add_flags +
  scale_color_manual(values = c("#ED2939", "#003399", "#FFCC00", "#FFCC00")) +
  scale_linetype_manual(values = c("solid", "solid", "dashed", "dashed")) +
  scale_x_date(breaks = as.Date(paste0(seq(1960, 2100, 1), "-01-01")),
               labels = date_format("%Y")) +
  scale_y_continuous(breaks = 0.01*seq(-100, 200, 1),
                     labels = scales::percent_format(accuracy = 1)) +
  theme(legend.position = c(0.75, 0.2),
        legend.title = element_blank()) +
  geom_hline(yintercept = 0.06, linetype = "dotted") +
  geom_hline(yintercept = -0.04, linetype = "dotted")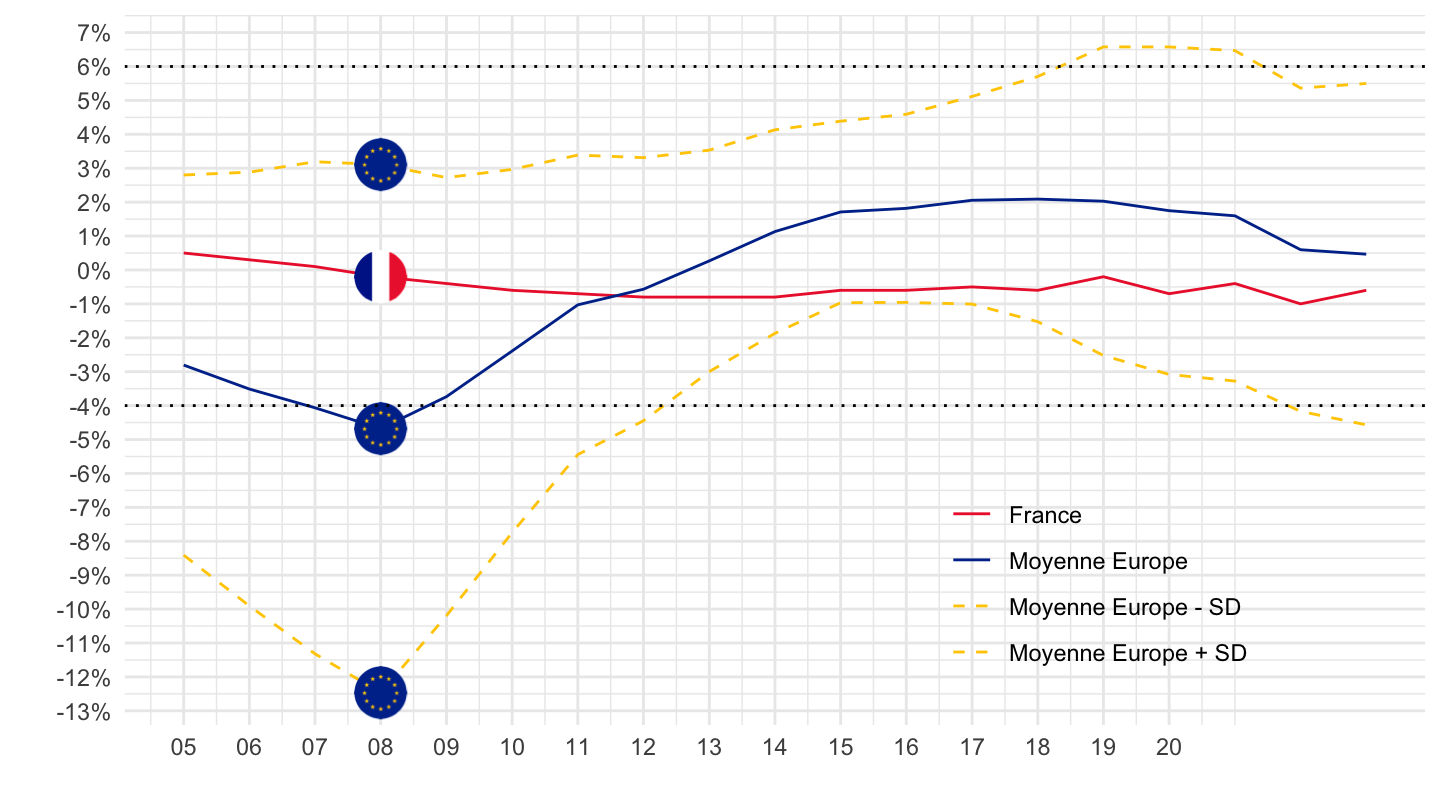
tipsbp10 |>
  year_to_date() |>
  filter(date >= as.Date("2005-01-01")) |>
  group_by(date) |>
  summarise(`Moyenne Europe` = mean(values),
            `Ecart Type` = sd(values),
            `France` = values[geo == "FR"],
            `Allemagne` = values[geo == "DE"]) |>
  transmute(date, `Moyenne Europe`,
            `Moyenne Europe + SD` = `Moyenne Europe` + `Ecart Type`,
            `Moyenne Europe - SD` = `Moyenne Europe` - `Ecart Type`,
             `France`,
             `Allemagne`) |>
  gather(variable, value, -date) |>
  mutate(values = value/100,
         Geo = ifelse(variable == "France", "France", "Europe"),
         Geo = ifelse(variable == "Allemagne", "Germany", Geo)) |>
  ggplot() + geom_line(aes(x = date, y = values, color = variable, linetype = variable)) +
  theme_minimal() + xlab("") + ylab("") + add_flags +
  scale_color_manual(values = c("#000000", "#ED2939", "#003399", "#FFCC00", "#FFCC00")) +
  scale_linetype_manual(values = c("solid", "solid", "solid", "dashed", "dashed")) +
  scale_x_date(breaks = as.Date(paste0(seq(1960, 2100, 1), "-01-01")),
               labels = date_format("%Y")) +
  scale_y_continuous(breaks = 0.01*seq(-100, 200, 1),
                     labels = scales::percent_format(accuracy = 1)) +
  theme(legend.position = c(0.75, 0.2),
        legend.title = element_blank()) +
  geom_hline(yintercept = 0.06, linetype = "dotted") +
  geom_hline(yintercept = -0.04, linetype = "dotted")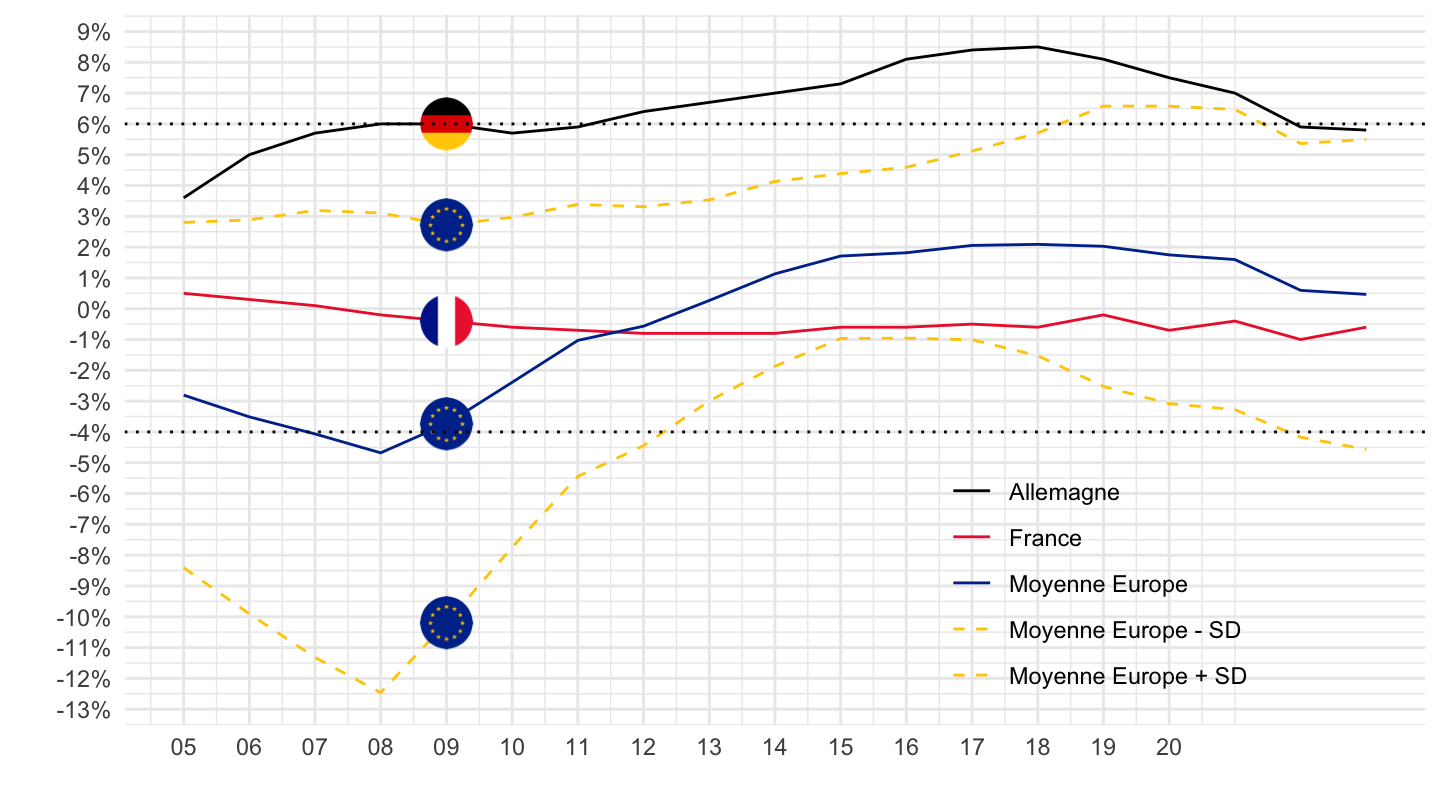
eurozone_countries <- c("Austria", "Belgium", "Cyprus", "Estonia", "Finland", "France",
                        "Germany", "Greece", "Ireland", "Italy", "Latvia", "Lithuania",
                        "Luxembourg", "Malta", "Netherlands", "Portugal", "Slovakia",
                        "Slovenia", "Spain")
non_eurozone_countries <- c("Bulgaria", "Croatia", "Czechia", "Denmark",
                            "Hungary", "Poland", "Romania", "Sweden")
tipsbp10 |>
  year_to_date() |>

  filter(date >= as.Date("2005-01-01"), Geo %in% eurozone_countries) |>
  group_by(date) |>
  summarise(`Moyenne` = mean(values),
            `Ecart Type` = sd(values)) |>
  transmute(date, `Moyenne`,
            `Moyenne + SD` = `Moyenne` + `Ecart Type`,
            `Moyenne - SD` = `Moyenne` - `Ecart Type`) |>
  gather(variable, value, -date) |>
  mutate(value = value/100) |>
  ggplot() + geom_line(aes(x = date, y = value, color = variable, linetype = variable)) +
  theme_minimal() + xlab("") + ylab("") +
  scale_color_manual(values = c(viridis(3)[1], viridis(3)[2], viridis(3)[2])) +
  scale_linetype_manual(values = c("solid", "dashed", "dashed")) +
  scale_x_date(breaks = as.Date(paste0(seq(1960, 2100, 2), "-01-01")),
               labels = date_format("%Y")) +
  scale_y_continuous(breaks = 0.01*seq(-100, 200, 1),
                     labels = scales::percent_format(accuracy = 1)) +
  theme(legend.position = c(0.85, 0.2),
        legend.title = element_blank()) +
  geom_hline(yintercept = 0.06, linetype = "dotted") +
  geom_hline(yintercept = -0.04, linetype = "dotted")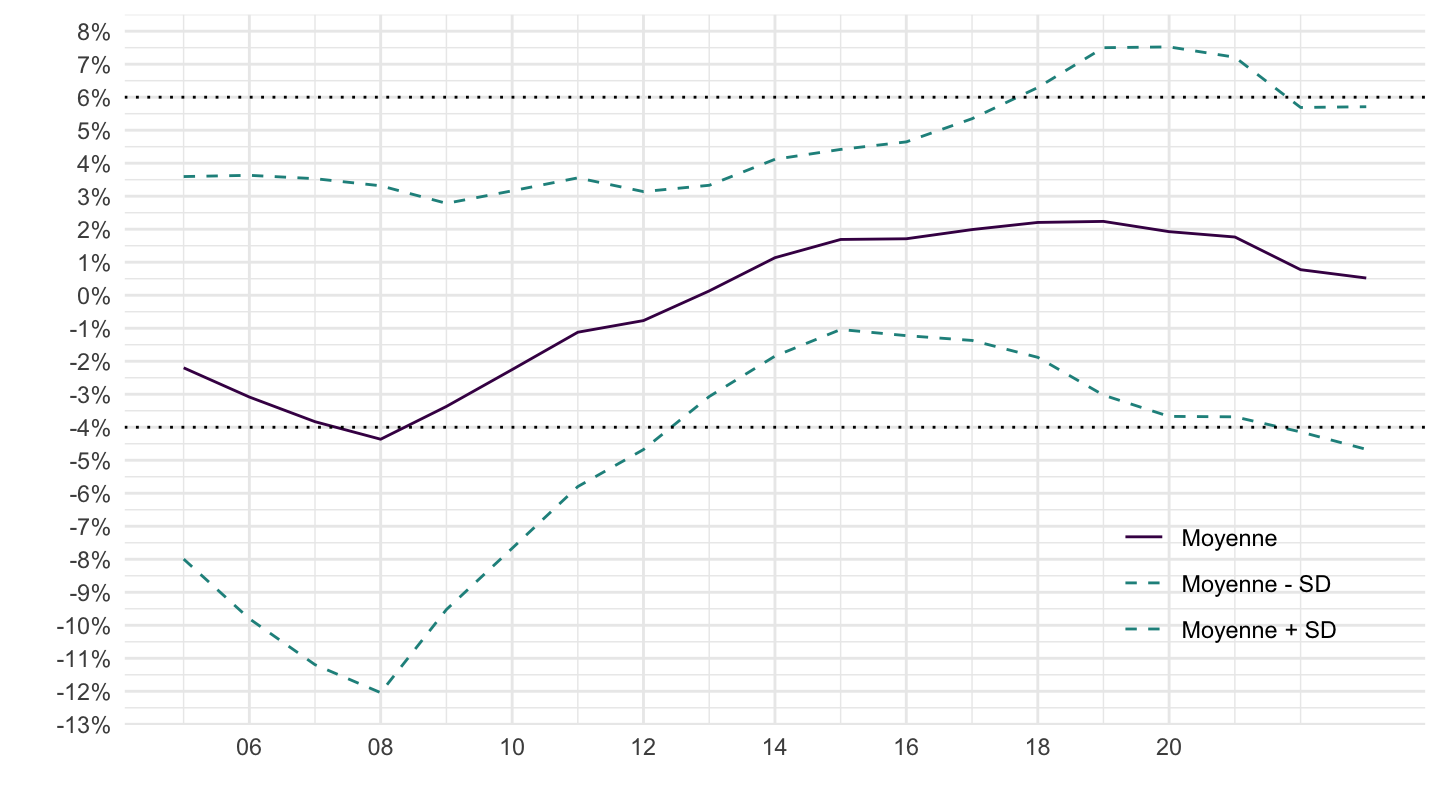
tipsbp10 |>
  year_to_date() |>

  filter(date >= as.Date("2005-01-01"), Geo %in% non_eurozone_countries) |>
  group_by(date) |>
  summarise(`Moyenne` = mean(values),
            `Ecart Type` = sd(values)) |>
  transmute(date, `Moyenne`,
            `Moyenne + SD` = `Moyenne` + `Ecart Type`,
            `Moyenne - SD` = `Moyenne` - `Ecart Type`) |>
  gather(variable, value, -date) |>
  mutate(value = value/100) |>
  ggplot() + geom_line(aes(x = date, y = value, color = variable, linetype = variable)) +
  theme_minimal() + xlab("") + ylab("") +
  scale_color_manual(values = c(viridis(3)[1], viridis(3)[2], viridis(3)[2])) +
  scale_linetype_manual(values = c("solid", "dashed", "dashed")) +
  scale_x_date(breaks = as.Date(paste0(seq(1960, 2100, 2), "-01-01")),
               labels = date_format("%Y")) +
  scale_y_continuous(breaks = 0.01*seq(-100, 200, 1),
                     labels = scales::percent_format(accuracy = 1)) +
  theme(legend.position = c(0.85, 0.2),
        legend.title = element_blank()) +
  geom_hline(yintercept = 0.06, linetype = "dotted") +
  geom_hline(yintercept = -0.04, linetype = "dotted")