Code
tec00104 %>%
  left_join(geo, by = "geo") %>%
  group_by(geo, Geo) %>%
  summarise(Nobs = n()) %>%
  arrange(-Nobs) %>%
{if (is_html_output()) datatable(., filter = 'top', rownames = F) else .}Data - Eurostat
tec00104 %>%
left_join(geo, by = "geo") %>%
group_by(geo, Geo) %>%
summarise(Nobs = n()) %>%
arrange(-Nobs) %>%
{if (is_html_output()) datatable(., filter = 'top', rownames = F) else .}tec00104 %>%
group_by(unit) %>%
summarise(Nobs = n()) %>%
arrange(-Nobs) %>%
{if (is_html_output()) print_table(.) else .}| unit | Nobs |
|---|---|
| PC | 373 |
tec00104 %>%
  group_by(sector) %>%
  summarise(Nobs = n()) %>%
  arrange(-Nobs) %>%
{if (is_html_output()) print_table(.) else .}| sector | Nobs |
|---|---|
| S14_S15 | 373 |
tec00104 %>%
  group_by(na_item) %>%
  summarise(Nobs = n()) %>%
  arrange(-Nobs) %>%
{if (is_html_output()) print_table(.) else .}| na_item | Nobs |
|---|---|
| DIR_S14_S15 | 373 |
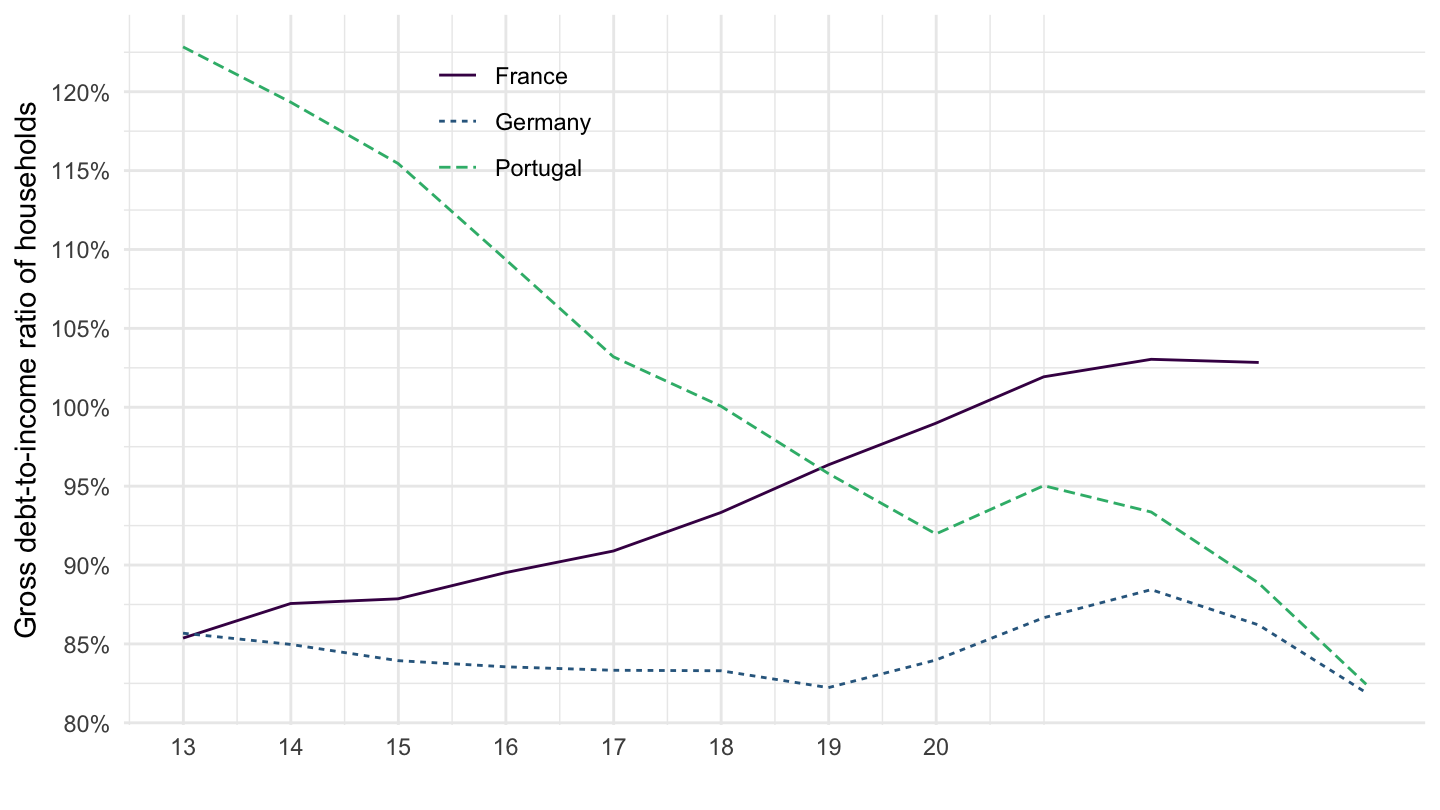
tec00104 %>%
  filter(geo %in% c("FR", "DE", "PT")) %>%
  year_to_enddate %>%
  left_join(geo, by = "geo") %>%
  ggplot + geom_line() + theme_minimal()  +
  aes(x = date, y = values/100, color = Geo, linetype = Geo) +
  scale_color_manual(values = viridis(4)[1:3]) +
  scale_x_date(breaks = as.Date(paste0(seq(1960, 2020, 1), "-01-01")),
               labels = date_format("%y")) +
  theme(legend.position = c(0.3, 0.85),
        legend.title = element_blank()) +
  xlab("") + ylab("Gross debt-to-income ratio of households") +
  scale_y_continuous(breaks = 0.01*seq(0, 200, 5),
                     labels = scales::percent_format(accuracy = 1))