Code
tec00010 %>%
  left_join(geo, by = "geo") %>%
  group_by(geo, Geo) %>%
  summarise(Nobs = n()) %>%
  arrange(-Nobs) %>%
{if (is_html_output()) datatable(., filter = 'top', rownames = F) else .}Data - Eurostat
tec00010 %>%
left_join(geo, by = "geo") %>%
group_by(geo, Geo) %>%
summarise(Nobs = n()) %>%
arrange(-Nobs) %>%
{if (is_html_output()) datatable(., filter = 'top', rownames = F) else .}tec00010 %>%
left_join(unit, by = "unit") %>%
group_by(unit, Unit) %>%
summarise(Nobs = n()) %>%
arrange(-Nobs) %>%
{if (is_html_output()) print_table(.) else .}| unit | Unit | Nobs |
|---|---|---|
| CP_MEUR | Current prices, million euro | 507 |
| PC_GDP | Percentage of gross domestic product (GDP) | 507 |
tec00010 %>%
  left_join(geo, by = "geo") %>%
  group_by(geo, Geo) %>%
  summarise(Nobs = n()) %>%
  arrange(-Nobs) %>%
{if (is_html_output()) print_table(.) else .}| geo | Geo | Nobs |
|---|---|---|
| AT | Austria | 24 |
| BE | Belgium | 24 |
| BG | Bulgaria | 24 |
| CH | Switzerland | 24 |
| CY | Cyprus | 24 |
| CZ | Czechia | 24 |
| DE | Germany | 24 |
| DK | Denmark | 24 |
| EA19 | Euro area - 19 countries (2015-2022) | 24 |
| EA20 | Euro area – 20 countries (2023-2025) | 24 |
| EA21 | Euro area – 21 countries (from 2026) | 24 |
| EE | Estonia | 24 |
| EL | Greece | 24 |
| ES | Spain | 24 |
| EU27_2020 | European Union - 27 countries (from 2020) | 24 |
| FI | Finland | 24 |
| FR | France | 24 |
| HR | Croatia | 24 |
| HU | Hungary | 24 |
| IE | Ireland | 24 |
| IS | Iceland | 24 |
| IT | Italy | 24 |
| LT | Lithuania | 24 |
| LU | Luxembourg | 24 |
| LV | Latvia | 24 |
| ME | Montenegro | 24 |
| MK | North Macedonia | 24 |
| MT | Malta | 24 |
| NL | Netherlands | 24 |
| NO | Norway | 24 |
| PL | Poland | 24 |
| PT | Portugal | 24 |
| RO | Romania | 24 |
| RS | Serbia | 24 |
| SE | Sweden | 24 |
| SI | Slovenia | 24 |
| SK | Slovakia | 24 |
| TR | Türkiye | 24 |
| XK | Kosovo* | 24 |
| AL | Albania | 22 |
| BA | Bosnia and Herzegovina | 22 |
| UA | Ukraine | 22 |
| UK | United Kingdom | 12 |
tec00010 %>%
  left_join(na_item, by = "na_item") %>%
  group_by(na_item, Na_item) %>%
  summarise(Nobs = n()) %>%
  arrange(-Nobs) %>%
{if (is_html_output()) print_table(.) else .}| na_item | Na_item | Nobs |
|---|---|---|
| P3_S13 | Final consumption expenditure of general government | 1014 |
tec00010 %>%
  group_by(time) %>%
  summarise(Nobs = n()) %>%
  arrange(-Nobs) %>%
{if (is_html_output()) print_table(.) else .}| time | Nobs |
|---|---|
| 2014 | 86 |
| 2015 | 86 |
| 2016 | 86 |
| 2017 | 86 |
| 2018 | 86 |
| 2019 | 86 |
| 2020 | 84 |
| 2021 | 84 |
| 2022 | 84 |
| 2023 | 84 |
| 2024 | 84 |
| 2025 | 78 |
tec00010 %>%
  filter(geo %in% c("FR", "DE", "PT"),
         unit == "PC_GDP") %>%
  year_to_enddate %>%
  left_join(geo, by = "geo") %>%
  ggplot + geom_line() + theme_minimal()  +
  aes(x = date, y = values/100, color = Geo, linetype = Geo) +
  scale_color_manual(values = viridis(4)[1:3]) +
  scale_x_date(breaks = as.Date(paste0(seq(1960, 2020, 1), "-01-01")),
               labels = date_format("%y")) +
  theme(legend.position = c(0.7, 0.55),
        legend.title = element_blank()) +
  xlab("") + ylab("Final consumption expenditure of general gvnt") +
  scale_y_continuous(breaks = 0.01*seq(0, 200, 1),
                     labels = scales::percent_format(accuracy = 1))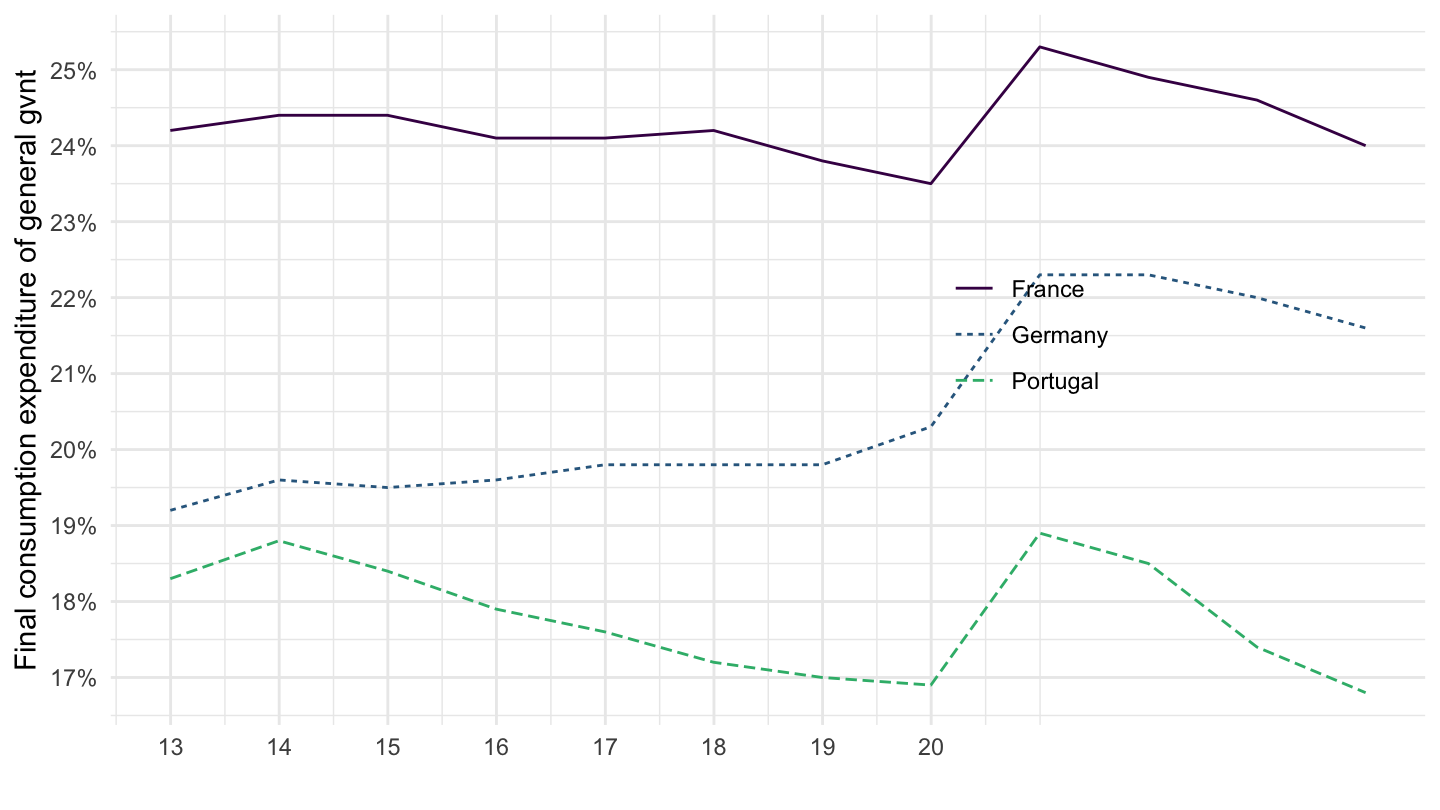
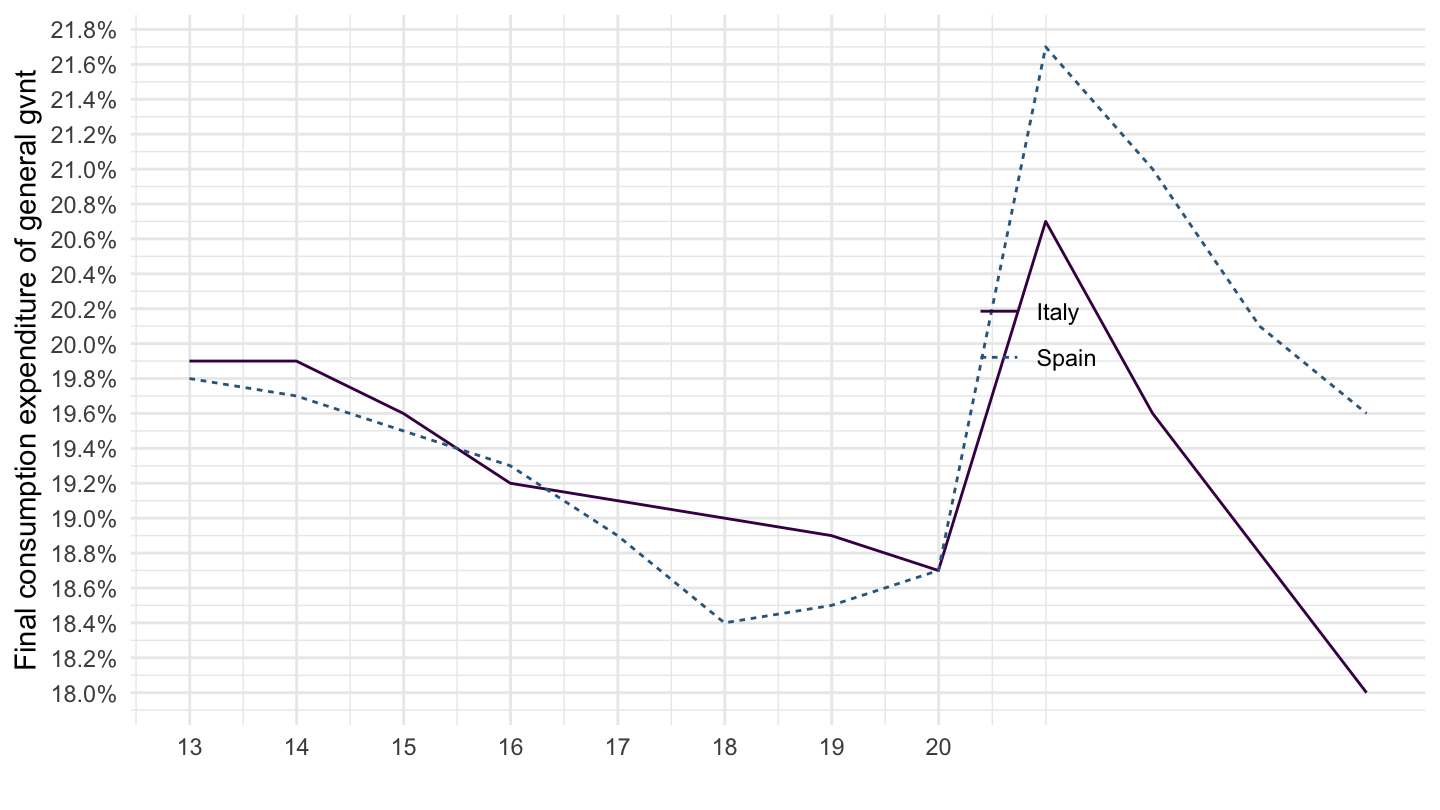
tec00010 %>%
  filter(geo %in% c("IT", "ES", "GR"),
         unit == "PC_GDP") %>%
  year_to_enddate %>%
  left_join(geo, by = "geo") %>%
  ggplot + geom_line() + theme_minimal()  +
  aes(x = date, y = values/100, color = Geo, linetype = Geo) +
  scale_color_manual(values = viridis(4)[1:3]) +
  scale_x_date(breaks = as.Date(paste0(seq(1960, 2020, 1), "-01-01")),
               labels = date_format("%y")) +
  theme(legend.position = c(0.7, 0.55),
        legend.title = element_blank()) +
  xlab("") + ylab("Final consumption expenditure of general gvnt") +
  scale_y_continuous(breaks = 0.01*seq(0, 200, 0.2),
                     labels = scales::percent_format(accuracy = 0.1))