Turnover and volume of sales in wholesale and retail trade - quarterly data - sts_trtu_q
Data - Eurostat
Info
Last observation: Quarterly: 2026Q1 (N = 8,119)
First observation: Quarterly: 1991Q1 (N = 345)
Last data update: 23 jul 2026, 23:06. Last compile: 24 jul 2026, 03:58
Structure
France: Retail Turnover vs. Volume of Sales
Value vs. Volume, Retail Trade (G47)
Code
sts_trtu_q %>%
  filter(geo == "FR",
         nace_r2 == "G47",
         s_adj == "SCA",
         unit == "I21") %>%
  quarter_to_date %>%

  ggplot + geom_line(aes(x = date, y = values, color = Indic_bt)) +
  theme_minimal() +
  scale_x_date(breaks = seq(1920, 2100, 2) %>% paste0("-01-01") %>% as.Date,
               labels = date_format("%Y")) +
  theme(legend.position = c(0.2, 0.85),
        legend.title = element_blank()) +
  xlab("") + ylab("Retail trade index (2021 = 100)")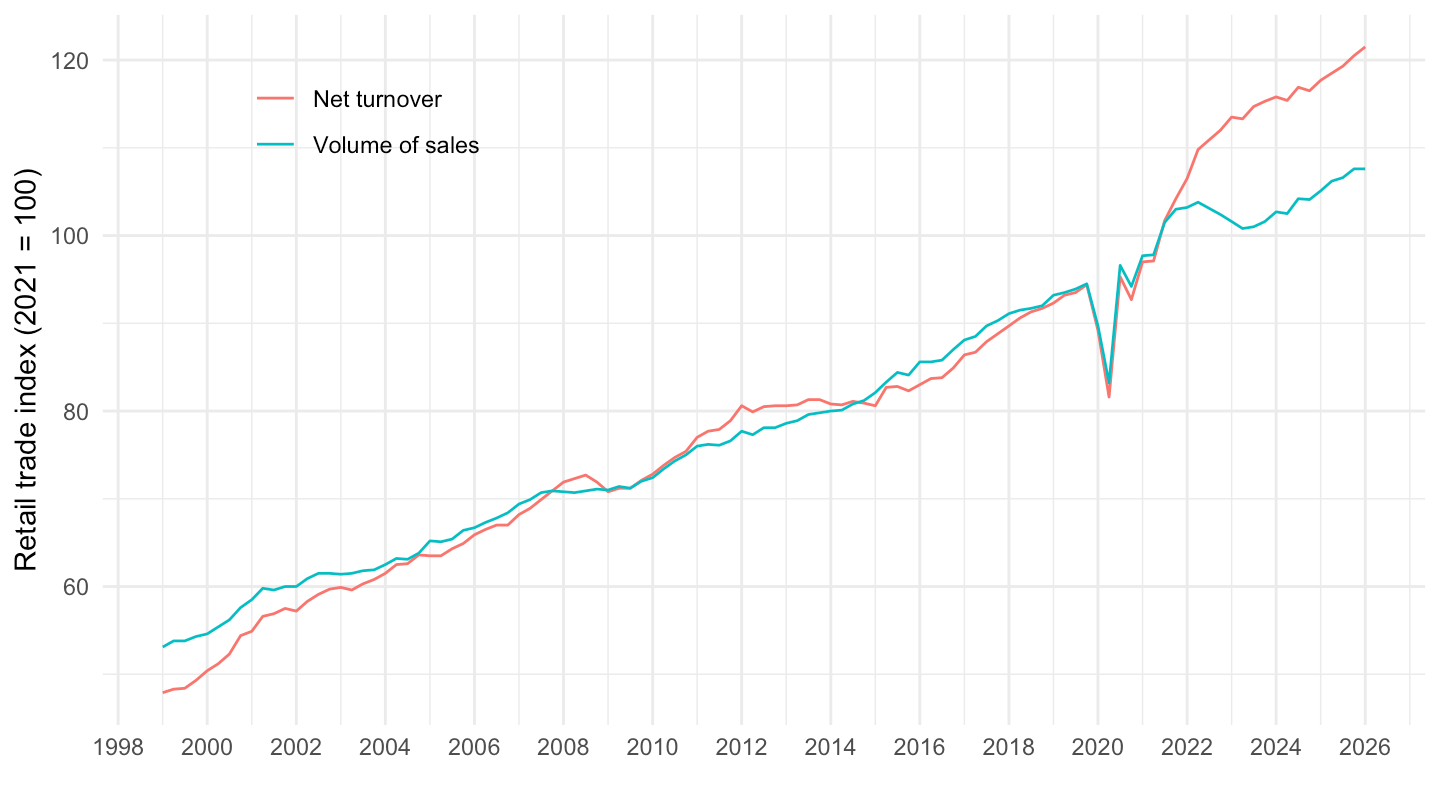
Germany: Wholesale vs. Retail Turnover
G46 (Wholesale) vs. G47 (Retail)
Code
sts_trtu_q %>%
  filter(geo == "DE",
         nace_r2 %in% c("G46", "G47"),
         s_adj == "SCA",
         unit == "I21",
         indic_bt == "NETTUR") %>%
  quarter_to_date %>%

  ggplot + geom_line(aes(x = date, y = values, color = Nace_r2)) +
  theme_minimal() +
  scale_x_date(breaks = seq(1920, 2100, 2) %>% paste0("-01-01") %>% as.Date,
               labels = date_format("%Y")) +
  theme(legend.position = c(0.3, 0.85),
        legend.title = element_blank()) +
  xlab("") + ylab("Net turnover (2021 = 100)")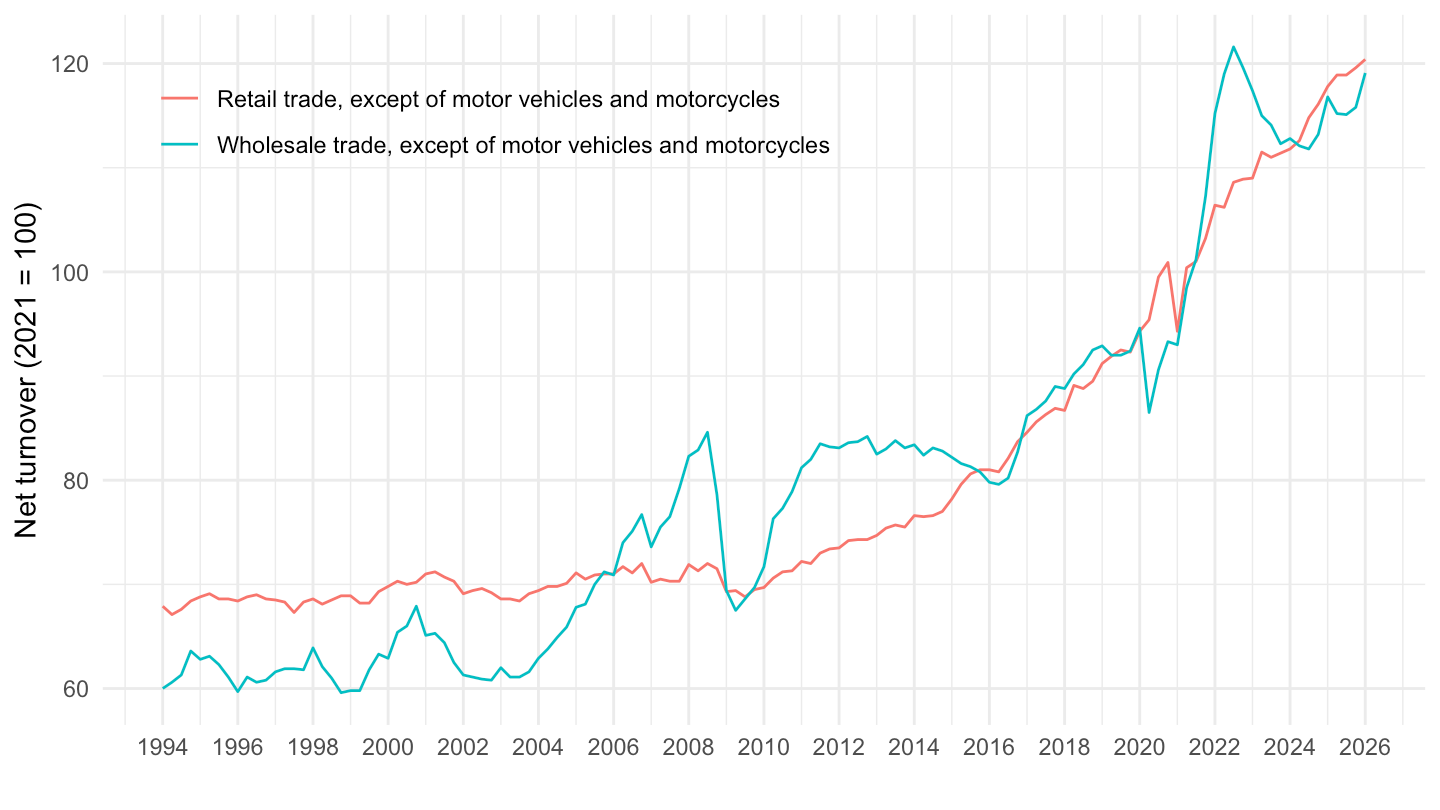
Latest Quarter: Retail Turnover Growth by Country
Code
latest_q <- sts_trtu_q %>%
  filter(geo == "FR",
         nace_r2 == "G47",
         s_adj == "CA",
         unit == "PCH_SM",
         indic_bt == "NETTUR",
         !is.na(values)) %>%
  summarise(m = max(time)) %>%
  pull(m)

sts_trtu_q %>%
  filter(geo %in% c("FR", "DE", "IT", "ES", "NL", "EU27_2020"),
         nace_r2 == "G47",
         s_adj == "CA",
         unit == "PCH_SM",
         indic_bt == "NETTUR",
         time == latest_q) %>%
  mutate(values = values/100) %>%
  select(Geo, values) %>%
  arrange(-values) %>%
print_table_conditional()| Geo | values |
|---|---|
| Spain | 0.056 |
| European Union - 27 countries (from 2020) | 0.034 |
| France | 0.033 |
| Italy | 0.025 |
| Germany | 0.022 |
| Netherlands | 0.017 |
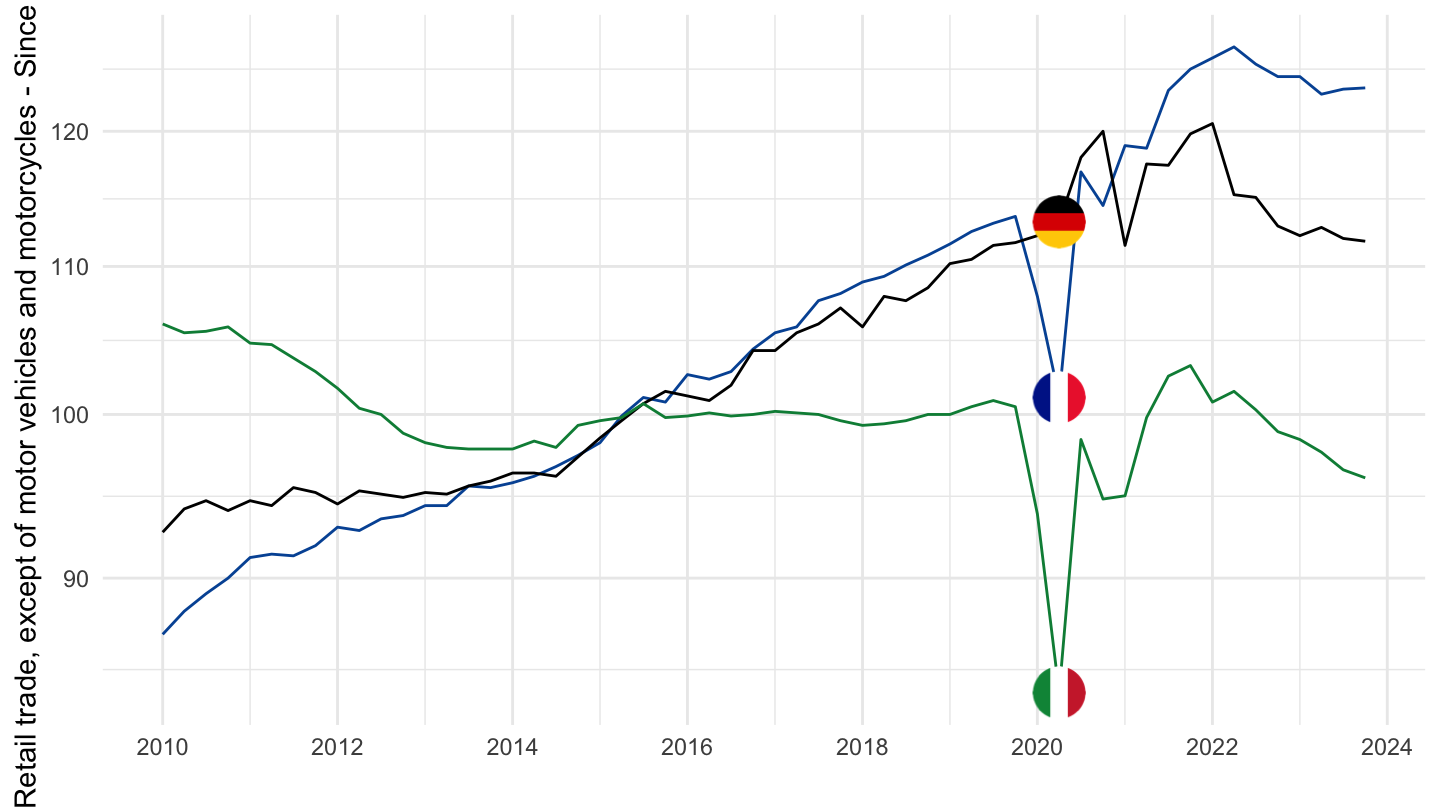
Turnover and volume of sales in wholesale and retail trade
France, Germany, Italy
All
Code
sts_trtu_q %>%
  filter(nace_r2 == "G47",
         unit == "I15",
         indic_bt == "NETTUR",
         geo %in% c("FR", "DE", "IT"),
         s_adj == "SCA") %>%
  select(geo, Geo, time, values) %>%
  group_by(geo) %>%

  mutate(Geo = ifelse(geo == "DE", "Germany", Geo)) %>%
  quarter_to_date %>%
  ggplot() + ylab("Retail trade, except of motor vehicles and motorcycles") + xlab("") + theme_minimal() +
  geom_line(aes(x = date, y = values, color = Geo)) +
  scale_color_manual(values = c("#0055a4", "#000000", "#008c45")) +
  scale_x_date(breaks = seq(1920, 2100, 2) %>% paste0("-01-01") %>% as.Date,
               labels = date_format("%Y")) +
  add_3flags +
  theme(legend.position = "none") +
  scale_y_log10(breaks = seq(-60, 300, 10))
2010-
Code
sts_trtu_q %>%
  filter(nace_r2 == "G47",
         unit == "I15",
         indic_bt == "NETTUR",
         geo %in% c("FR", "DE", "IT"),
         s_adj == "SCA") %>%
  select(geo, Geo, time, values) %>%
  group_by(geo) %>%

  mutate(Geo = ifelse(geo == "DE", "Germany", Geo)) %>%
  quarter_to_date %>%
  filter(date >= as.Date("2010-01-01")) %>%
  ggplot() + ylab("Retail trade, except of motor vehicles and motorcycles - Since 2010") + xlab("") + theme_minimal() +
  geom_line(aes(x = date, y = values, color = Geo)) +
  scale_color_manual(values = c("#0055a4", "#000000", "#008c45")) +
  scale_x_date(breaks = seq(1920, 2100, 2) %>% paste0("-01-01") %>% as.Date,
               labels = date_format("%Y")) +
  add_3flags +
  theme(legend.position = "none") +
  scale_y_log10(breaks = seq(-60, 300, 10))