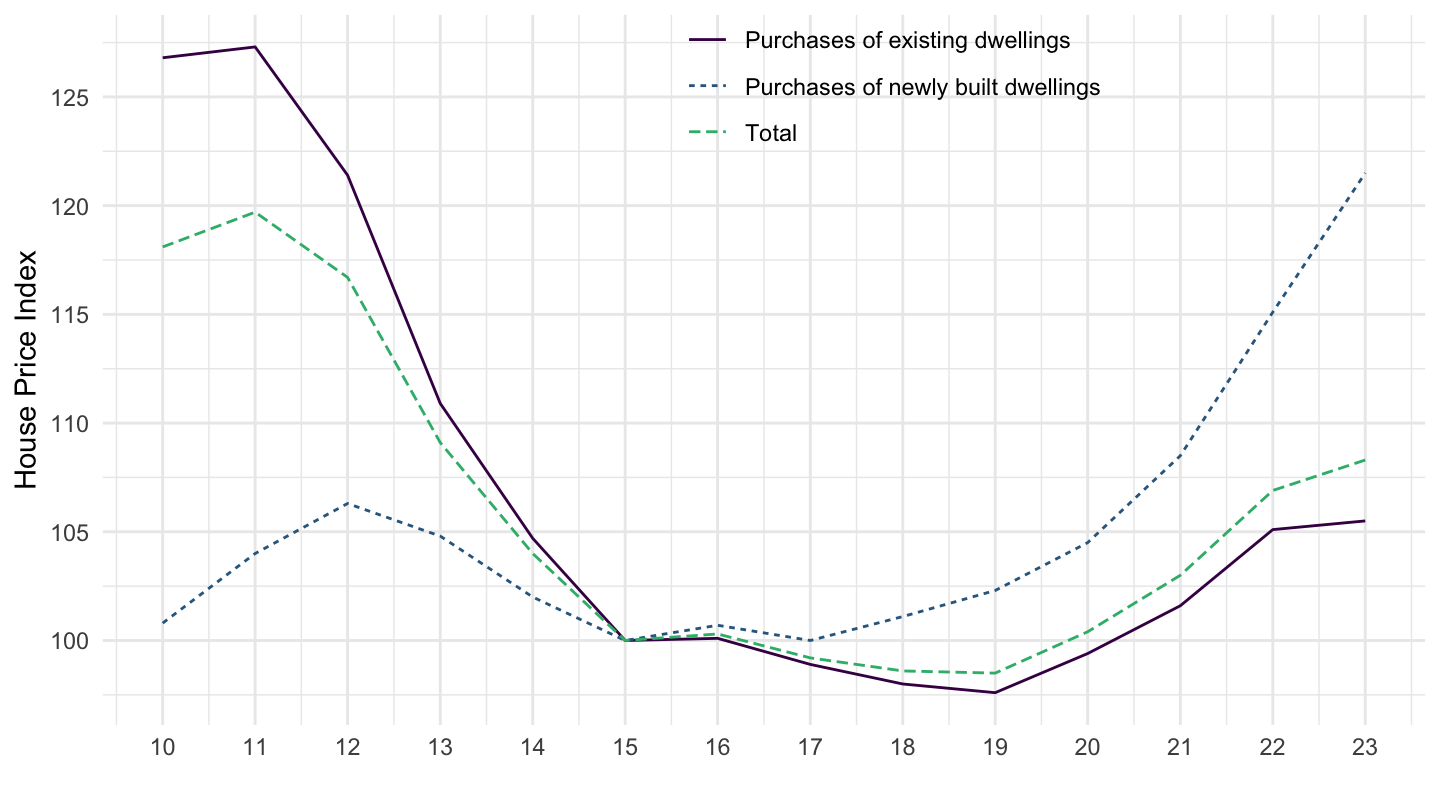
House price index (2015 = 100) - annual data - prc_hpi_a

Data - Eurostat

purchase

Code
prc_hpi_a %>%
  left_join(purchase, by = "purchase") %>%
  group_by(purchase, Purchase) %>%
  summarise(Nobs = n()) %>%
  arrange(-Nobs) %>%
  {if (is_html_output()) print_table(.) else .}
purchase Purchase Nobs
TOTAL Total 1869
DW_EXST Purchases of existing dwellings 1671
DW_NEW Purchases of newly built dwellings 1656

unit

Code
prc_hpi_a %>%
  left_join(unit, by = "unit") %>%
  group_by(unit, Unit) %>%
  summarise(Nobs = n()) %>%
  arrange(-Nobs) %>%
  {if (is_html_output()) print_table(.) else .}
unit Unit Nobs
I15_A_AVG Annual average index, 2015=100 1765
I10_A_AVG Annual average index, 2010=100 1757
RCH_A_AVG Annual average rate of change 1674

geo

Code
prc_hpi_a %>%
  left_join(geo, by = "geo") %>%
  group_by(geo, Geo) %>%
  summarise(Nobs = n()) %>%
  arrange(-Nobs) %>%
  {if (is_html_output()) datatable(., filter = 'top', rownames = F) else .}

time

Code
prc_hpi_a %>%
  group_by(time) %>%
  summarise(Nobs = n()) %>%
  {if (is_html_output()) datatable(., filter = 'top', rownames = F) else .}

Purchase Total

France, Italy, Germany

Code
prc_hpi_a %>%
  filter(purchase == "TOTAL",
         geo %in% c("FR", "IT", "DE"),
         unit == "I15_A_AVG") %>%
  time_to_date %>%
  left_join(geo, by = "geo") %>%
  ggplot() + geom_line() + theme_minimal() +
  aes(x = date, y = values, color = Geo, linetype = Geo) +
  scale_color_manual(values = viridis(4)[1:3]) +
  scale_x_date(breaks = seq(1920, 2025, 1) %>% paste0("-01-01") %>% as.Date,
               labels = date_format("%y")) +
  theme(legend.position = c(0.35, 0.9),
        legend.title = element_blank()) +
  scale_y_continuous(breaks = seq(-100, 300, 10)) +
  ylab("House Price Index") + xlab("")

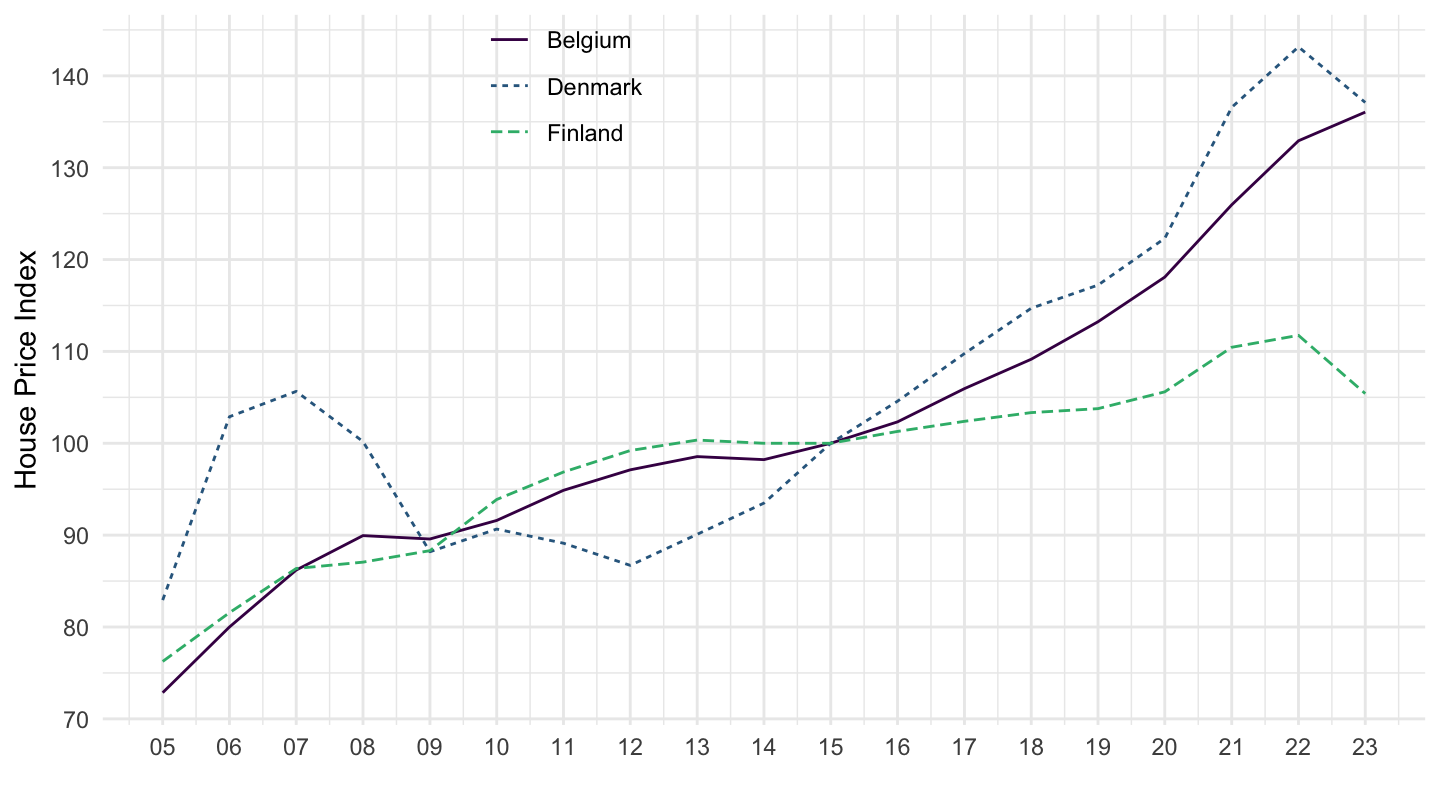
Belgium, Denmark, Finland

Code
prc_hpi_a %>%
  filter(purchase == "TOTAL",
         geo %in% c("BE", "DK", "FI"),
         unit == "I15_A_AVG") %>%
  time_to_date %>%
  left_join(geo, by = "geo") %>%
  ggplot() + geom_line() + theme_minimal() +
  aes(x = date, y = values, color = Geo, linetype = Geo) +
  scale_color_manual(values = viridis(4)[1:3]) +
  scale_x_date(breaks = seq(1920, 2025, 1) %>% paste0("-01-01") %>% as.Date,
               labels = date_format("%y")) +
  theme(legend.position = c(0.35, 0.9),
        legend.title = element_blank()) +
  scale_y_continuous(breaks = seq(-100, 300, 10)) +
  ylab("House Price Index") + xlab("")
All Series

France

Code
prc_hpi_a %>%
  filter(geo %in% c("FR"),
         unit == "I15_A_AVG") %>%
  time_to_date %>%
  left_join(geo, by = "geo") %>%
  left_join(purchase, by = "purchase") %>%
  ggplot() + geom_line() + theme_minimal() +
  aes(x = date, y = values, color = Purchase, linetype = Purchase) +
  scale_color_manual(values = viridis(4)[1:3]) +
  scale_x_date(breaks = seq(1920, 2025, 1) %>% paste0("-01-01") %>% as.Date,
               labels = date_format("%y")) +
  theme(legend.position = c(0.35, 0.9),
        legend.title = element_blank()) +
  scale_y_continuous(breaks = seq(-100, 300, 10)) +
  ylab("House Price Index") + xlab("")

Germany

Code
prc_hpi_a %>%
  filter(geo %in% c("DE"),
         unit == "I15_A_AVG") %>%
  time_to_date %>%
  left_join(geo, by = "geo") %>%
  left_join(purchase, by = "purchase") %>%
  ggplot() + geom_line() + theme_minimal() +
  aes(x = date, y = values, color = Purchase, linetype = Purchase) +
  scale_color_manual(values = viridis(4)[1:3]) +
  scale_x_date(breaks = seq(1920, 2025, 1) %>% paste0("-01-01") %>% as.Date,
               labels = date_format("%y")) +
  theme(legend.position = c(0.35, 0.9),
        legend.title = element_blank()) +
  scale_y_continuous(breaks = seq(-100, 300, 10)) +
  ylab("House Price Index") + xlab("")

Italy

Code
prc_hpi_a %>%
  filter(geo %in% c("IT"),
         unit == "I15_A_AVG") %>%
  time_to_date %>%
  left_join(geo, by = "geo") %>%
  left_join(purchase, by = "purchase") %>%
  ggplot() + geom_line() + theme_minimal() +
  aes(x = date, y = values, color = Purchase, linetype = Purchase) +
  scale_color_manual(values = viridis(4)[1:3]) +
  scale_x_date(breaks = seq(1920, 2025, 1) %>% paste0("-01-01") %>% as.Date,
               labels = date_format("%y")) +
  theme(legend.position = c(0.6, 0.9),
        legend.title = element_blank()) +
  scale_y_continuous(breaks = seq(-100, 300, 5)) +
  ylab("House Price Index") + xlab("")