Code
prc_hicp_cind %>%
  left_join(unit, by = "unit") %>%
  group_by(unit, Unit) %>%
  summarise(Nobs = n()) %>%
  arrange(-Nobs) %>%
{if (is_html_output()) print_table(.) else .}| unit | Unit | Nobs |
|---|---|---|
| I15 | Index, 2015=100 | 2431783 |
Data - Eurostat
prc_hicp_cind %>%
left_join(unit, by = "unit") %>%
group_by(unit, Unit) %>%
summarise(Nobs = n()) %>%
arrange(-Nobs) %>%
{if (is_html_output()) print_table(.) else .}| unit | Unit | Nobs |
|---|---|---|
| I15 | Index, 2015=100 | 2431783 |
prc_hicp_cind %>%
  left_join(coicop, by = "coicop") %>%
  group_by(coicop, Coicop) %>%
  summarise(Nobs = n()) %>%
  arrange(-Nobs) %>%
{if (is_html_output()) datatable(., filter = 'top', rownames = F) else .}prc_hicp_cind %>%
left_join(geo, by = "geo") %>%
group_by(geo, Geo) %>%
summarise(Nobs = n()) %>%
arrange(-Nobs) %>%
{if (is_html_output()) datatable(., filter = 'top', rownames = F) else .}prc_hicp_cind %>%
filter(unit == "I15",
coicop == "CP00",
geo %in% c("FR", "DE", "ES")) %>%
month_to_date %>%
left_join(geo, by = "geo") %>%
ggplot(.) + geom_line(aes(x = date, y = values, color = Geo)) +
theme_minimal() + xlab("") + ylab("") +
scale_x_date(breaks = seq(1960, 2020, 5) %>% paste0("-01-01") %>% as.Date,
labels = date_format("%y")) +
scale_y_log10(breaks = seq(0, 200, 10)) +
scale_color_manual(values = viridis(5)[1:4]) +
theme(legend.position = c(0.7, 0.30),
legend.title = element_blank())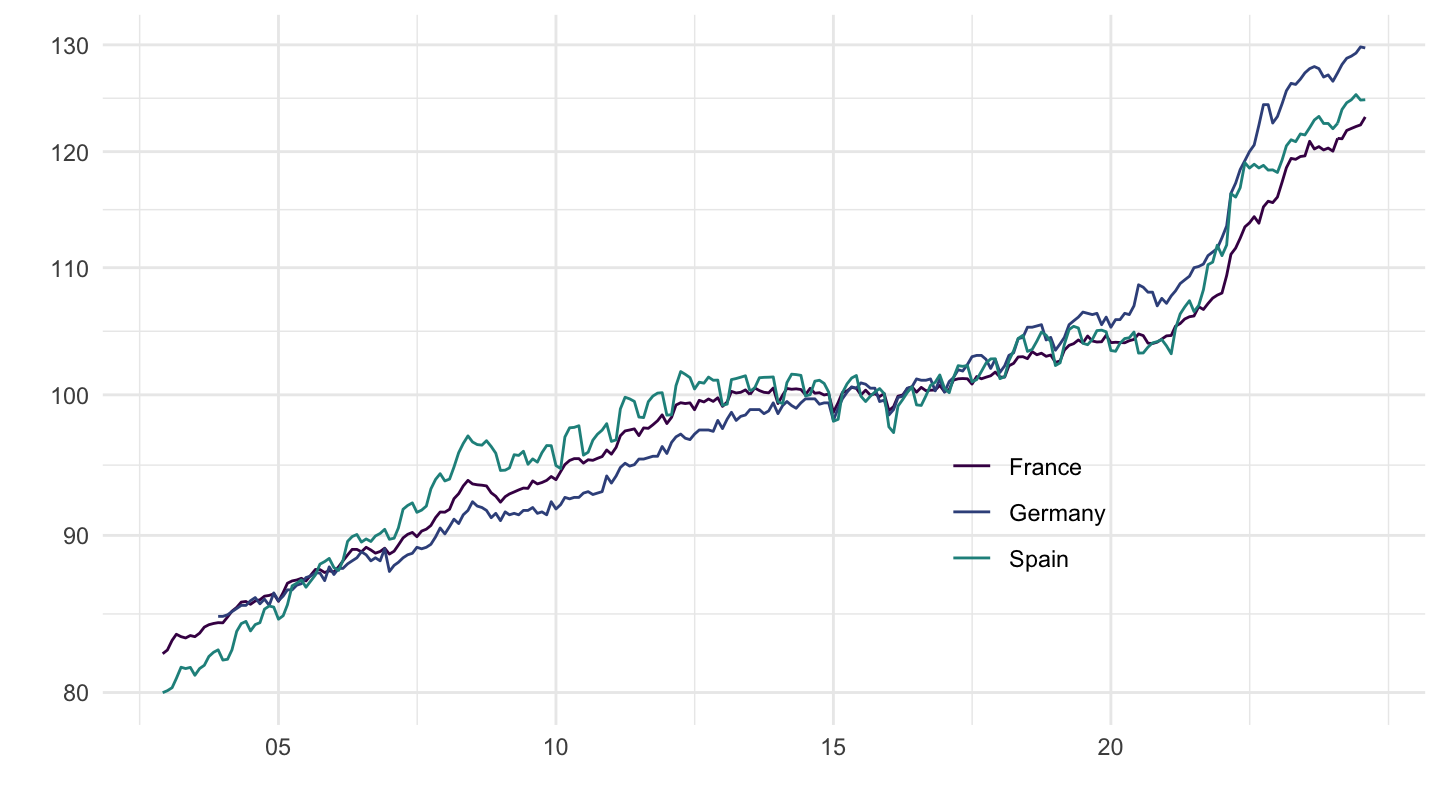
prc_hicp_cind %>%
  filter(unit == "I15",
         coicop %in% c("CP041"),
         time %in% c("2000M10", "2005M10", "2010M10", "2015M10", "2020M10")) %>%
  left_join(geo, by = "geo") %>%
  select(geo, Geo, time, values) %>%
  spread(time, values) %>%
{if (is_html_output()) datatable(., filter = 'top', rownames = F) else .}prc_hicp_cind %>%
filter(unit == "I15",
coicop %in% c("CP041"),
geo %in% c("FR", "DE", "IT", "EL")) %>%
month_to_date %>%
left_join(geo, by = "geo") %>%
ggplot(.) + geom_line(aes(x = date, y = values, color = Geo)) +
theme_minimal() + xlab("") + ylab("") +
scale_x_date(breaks = seq(1960, 2020, 5) %>% paste0("-01-01") %>% as.Date,
labels = date_format("%y")) +
scale_y_log10(breaks = seq(0, 200, 10)) +
scale_color_manual(values = viridis(5)[1:4]) +
theme(legend.position = c(0.7, 0.2),
legend.title = element_blank())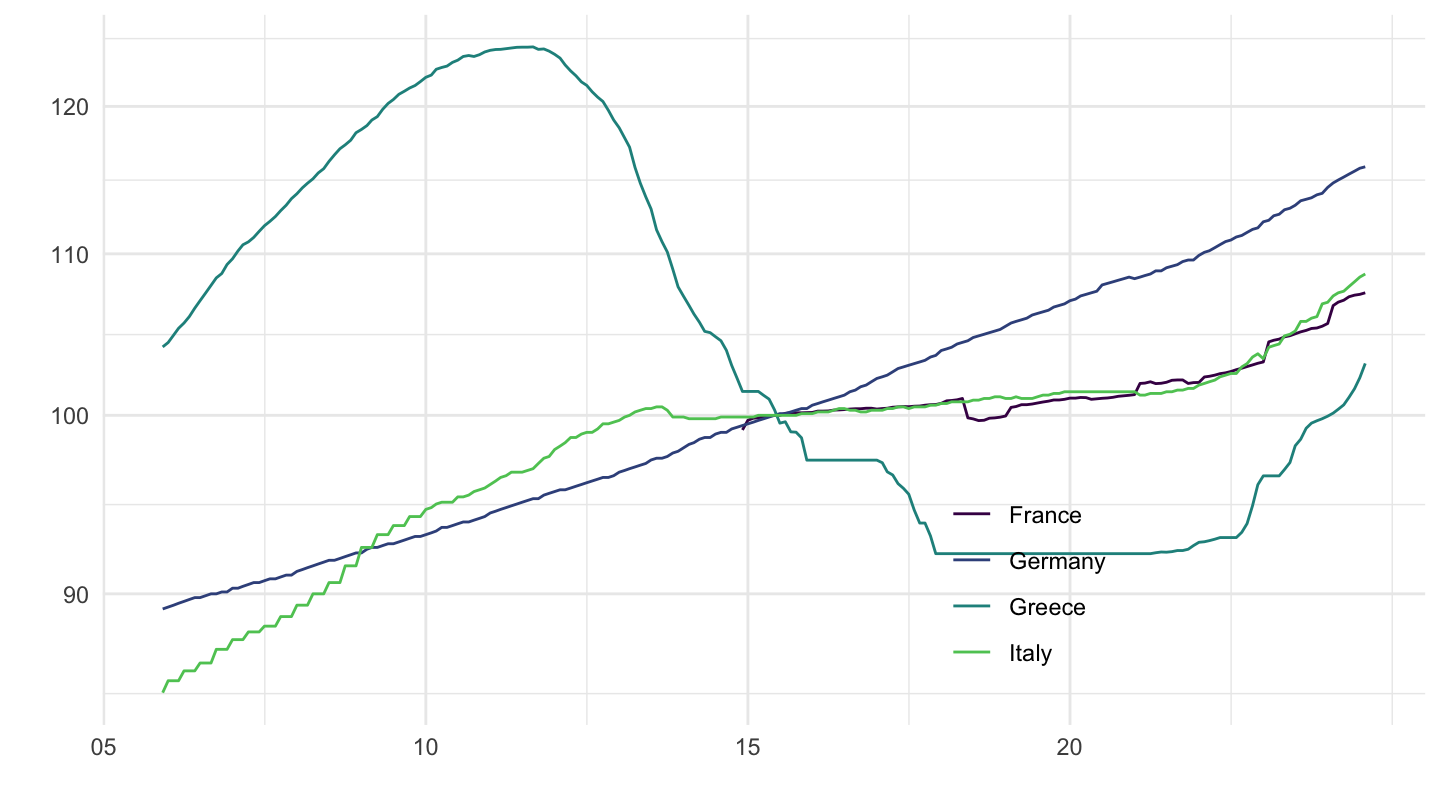
prc_hicp_cind %>%
  filter(unit == "I15",
         coicop %in% c("CP041"),
         geo %in% c("AT", "BE", "CY", "CH")) %>%
  month_to_date %>%
  left_join(geo, by = "geo") %>%
  ggplot(.) + geom_line(aes(x = date, y = values, color = Geo)) +
  theme_minimal() + xlab("") + ylab("") +
  scale_x_date(breaks = seq(1960, 2020, 5) %>% paste0("-01-01") %>% as.Date,
               labels = date_format("%y")) +
  scale_y_log10(breaks = seq(0, 200, 10)) +
  scale_color_manual(values = viridis(5)[1:4]) +
  theme(legend.position = c(0.7, 0.2),
        legend.title = element_blank())
prc_hicp_cind %>%
  filter(unit == "I15",
         coicop %in% c("CP041"),
         geo %in% c("CZ", "BG", "HU")) %>%
  month_to_date %>%
  left_join(geo, by = "geo") %>%
  ggplot(.) + geom_line(aes(x = date, y = values, color = Geo)) +
  theme_minimal() + xlab("") + ylab("") +
  scale_x_date(breaks = seq(1960, 2020, 5) %>% paste0("-01-01") %>% as.Date,
               labels = date_format("%y")) +
  scale_y_log10(breaks = seq(0, 200, 10)) +
  scale_color_manual(values = viridis(5)[1:4]) +
  theme(legend.position = c(0.7, 0.2),
        legend.title = element_blank())
prc_hicp_cind %>%
  filter(unit == "I15",
         coicop %in% c("CP041"),
         geo %in% c("DE", "EA", "EA18", "EA19")) %>%
  month_to_date %>%
  left_join(geo, by = "geo") %>%
  ggplot(.) + geom_line(aes(x = date, y = values, color = Geo)) +
  theme_minimal() + xlab("") + ylab("") +
  scale_x_date(breaks = seq(1960, 2020, 5) %>% paste0("-01-01") %>% as.Date,
               labels = date_format("%y")) +
  scale_y_log10(breaks = seq(0, 200, 10),
                limits = c(70, 125)) +
  scale_color_manual(values = viridis(5)[1:4]) +
  theme(legend.position = c(0.5, 0.85),
        legend.title = element_blank())
prc_hicp_cind %>%
  filter(unit == "I15",
         coicop %in% c("CP041"),
         geo %in% c("EE", "EL", "ES", "FI")) %>%
  month_to_date %>%
  left_join(geo, by = "geo") %>%
  ggplot(.) + geom_line(aes(x = date, y = values, color = Geo)) +
  theme_minimal() + xlab("") + ylab("") +
  scale_x_date(breaks = seq(1960, 2020, 5) %>% paste0("-01-01") %>% as.Date,
               labels = date_format("%y")) +
  scale_y_log10(breaks = seq(0, 200, 10)) +
  scale_color_manual(values = viridis(5)[1:4]) +
  theme(legend.position = c(0.8, 0.2),
        legend.title = element_blank())
prc_hicp_cind %>%
  filter(unit == "I15",
         coicop %in% c("CP041"),
         geo %in% c("HR", "IE", "IS", "LT")) %>%
  month_to_date %>%
  left_join(geo, by = "geo") %>%
  ggplot(.) + geom_line(aes(x = date, y = values, color = Geo)) +
  theme_minimal() + xlab("") + ylab("") +
  scale_x_date(breaks = seq(1960, 2020, 5) %>% paste0("-01-01") %>% as.Date,
               labels = date_format("%y")) +
  scale_y_log10(breaks = seq(0, 200, 10)) +
  scale_color_manual(values = viridis(5)[1:4]) +
  theme(legend.position = c(0.8, 0.2),
        legend.title = element_blank())
prc_hicp_cind %>%
  filter(unit == "I15",
         coicop %in% c("CP041"),
         geo %in% c("LU", "LV", "MK", "MT")) %>%
  month_to_date %>%
  left_join(geo, by = "geo") %>%
  ggplot(.) + geom_line(aes(x = date, y = values, color = Geo)) +
  theme_minimal() + xlab("") + ylab("") +
  scale_x_date(breaks = seq(1960, 2020, 5) %>% paste0("-01-01") %>% as.Date,
               labels = date_format("%y")) +
  scale_y_log10(breaks = seq(0, 200, 10)) +
  scale_color_manual(values = viridis(5)[1:4]) +
  theme(legend.position = c(0.8, 0.2),
        legend.title = element_blank())
prc_hicp_cind %>%
  filter(unit == "I15",
         coicop %in% c("CP041"),
         geo %in% c("NL", "NO", "PL", "PT")) %>%
  month_to_date %>%
  left_join(geo, by = "geo") %>%
  ggplot(.) + geom_line(aes(x = date, y = values, color = Geo)) +
  theme_minimal() + xlab("") + ylab("") +
  scale_x_date(breaks = seq(1960, 2020, 5) %>% paste0("-01-01") %>% as.Date,
               labels = date_format("%y")) +
  scale_y_log10(breaks = seq(0, 200, 10)) +
  scale_color_manual(values = viridis(5)[1:4]) +
  theme(legend.position = c(0.8, 0.2),
        legend.title = element_blank())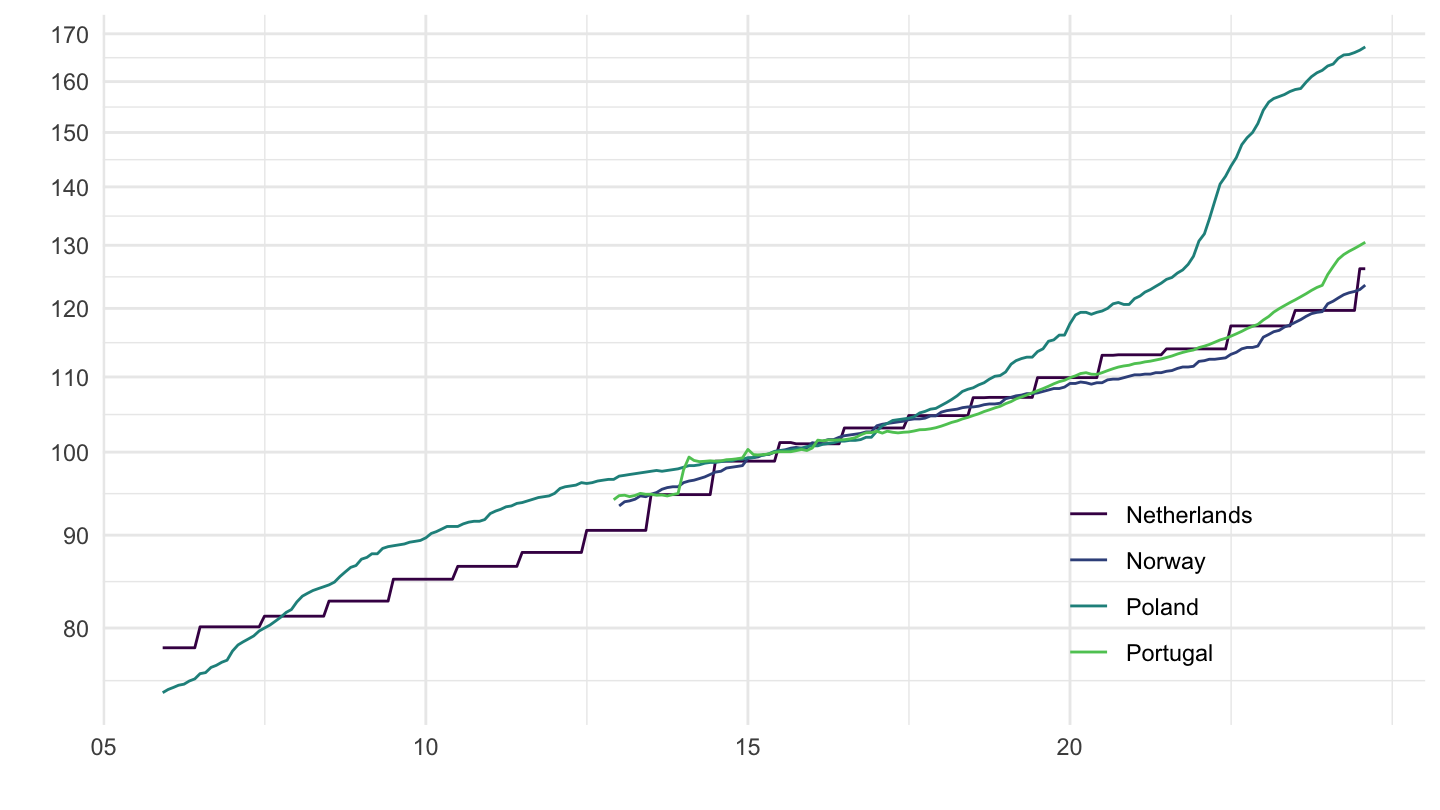
prc_hicp_cind %>%
  filter(unit == "I15",
         coicop %in% c("CP041"),
         geo %in% c("RO", "RS", "SE", "SI")) %>%
  month_to_date %>%
  left_join(geo, by = "geo") %>%
  ggplot(.) + geom_line(aes(x = date, y = values, color = Geo)) +
  theme_minimal() + xlab("") + ylab("") +
  scale_x_date(breaks = seq(1960, 2020, 5) %>% paste0("-01-01") %>% as.Date,
               labels = date_format("%y")) +
  scale_y_log10(breaks = seq(0, 200, 10)) +
  scale_color_manual(values = viridis(5)[1:4]) +
  theme(legend.position = c(0.8, 0.2),
        legend.title = element_blank())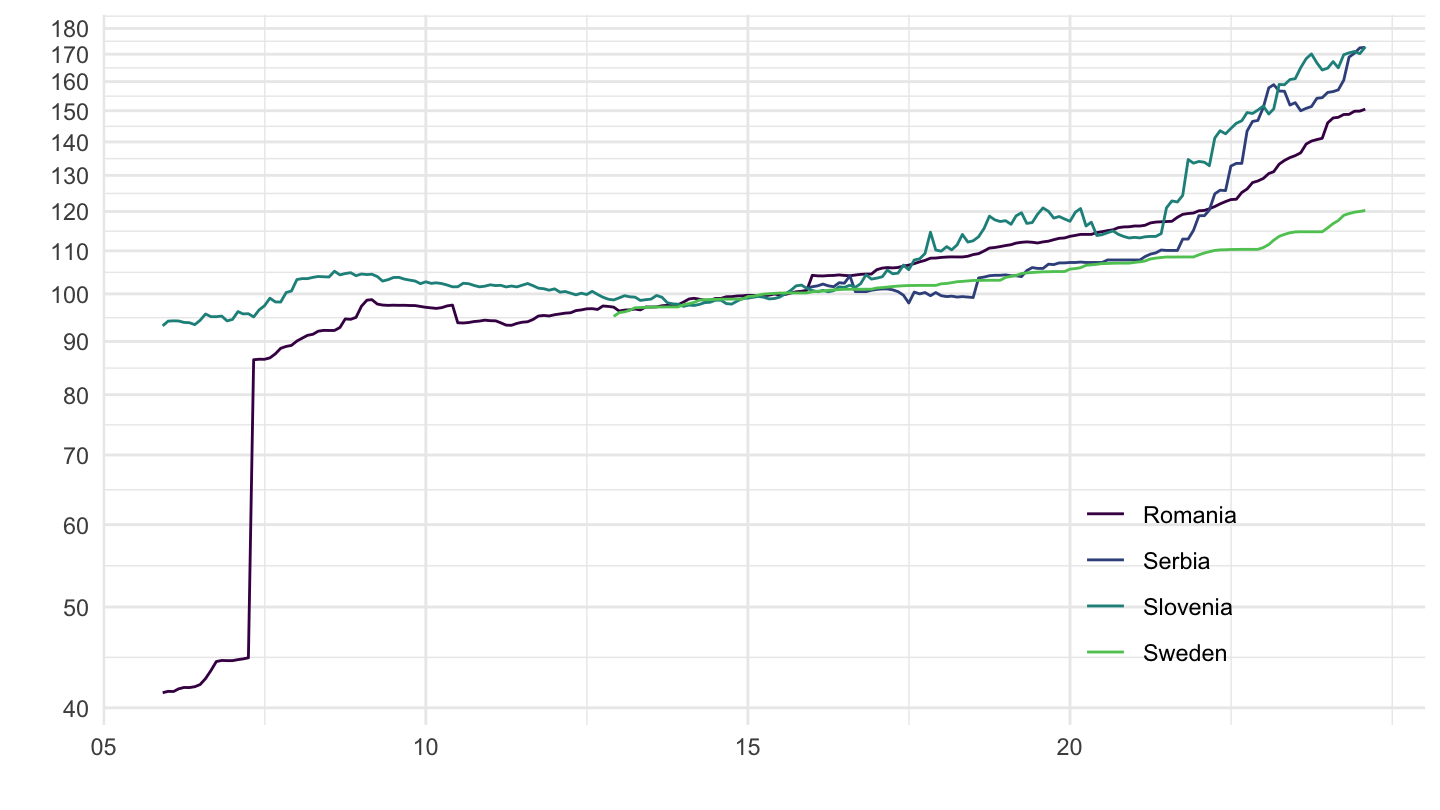
prc_hicp_cind %>%
  filter(unit == "I15",
         coicop %in% c("CP041"),
         geo %in% c("SK", "TR", "UK")) %>%
  month_to_date %>%
  left_join(geo, by = "geo") %>%
  ggplot(.) + geom_line(aes(x = date, y = values, color = Geo)) +
  theme_minimal() + xlab("") + ylab("") +
  scale_x_date(breaks = seq(1960, 2020, 5) %>% paste0("-01-01") %>% as.Date,
               labels = date_format("%y")) +
  scale_y_log10(breaks = seq(0, 200, 10)) +
  scale_color_manual(values = viridis(4)[1:3]) +
  theme(legend.position = c(0.8, 0.2),
        legend.title = element_blank())
prc_hicp_cind %>%
  filter(unit == "I15",
         coicop %in% c("CP04", "CP041", "CP043", "CP045"),
         geo %in% c("FR")) %>%
  month_to_date %>%
  left_join(coicop, by = "coicop") %>%
  ggplot(.) + geom_line(aes(x = date, y = values, color = Coicop)) +
  theme_minimal() + xlab("") + ylab("") +
  scale_x_date(breaks = seq(1960, 2020, 5) %>% paste0("-01-01") %>% as.Date,
               labels = date_format("%y")) +
  scale_y_log10(breaks = seq(0, 200, 10)) +
  scale_color_manual(values = viridis(5)[1:4]) +
  theme(legend.position = c(0.7, 0.2),
        legend.title = element_blank())
prc_hicp_cind %>%
  filter(unit == "I15",
         coicop %in% c("CP04", "CP041", "CP043", "CP045"),
         geo %in% c("DE")) %>%
  month_to_date %>%
  left_join(coicop, by = "coicop") %>%
  ggplot(.) + geom_line(aes(x = date, y = values, color = Coicop)) +
  theme_minimal() + xlab("") + ylab("") +
  scale_x_date(breaks = seq(1960, 2020, 5) %>% paste0("-01-01") %>% as.Date,
               labels = date_format("%y")) +
  scale_y_log10(breaks = seq(0, 200, 10)) +
  scale_color_manual(values = viridis(5)[1:4]) +
  theme(legend.position = c(0.7, 0.2),
        legend.title = element_blank())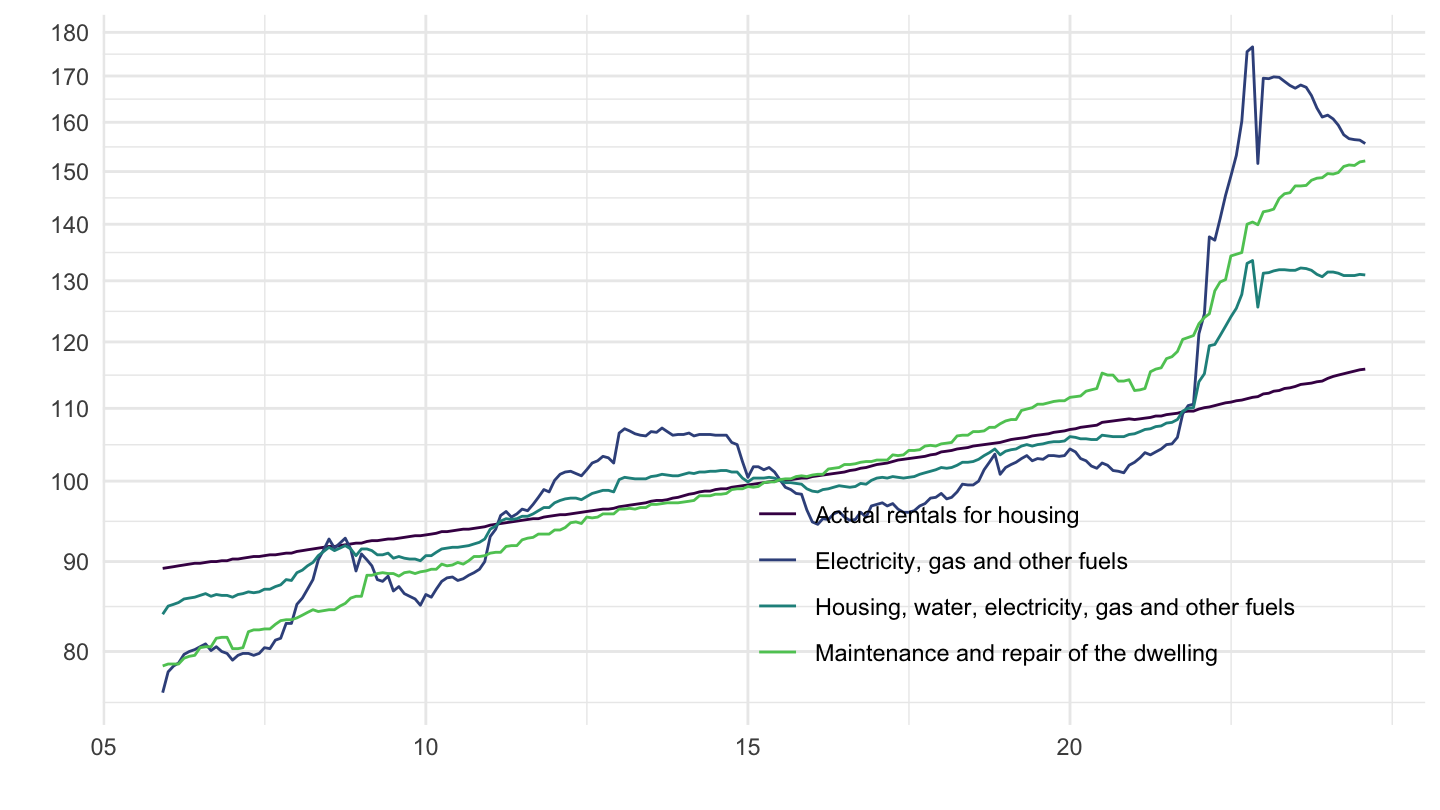
prc_hicp_cind %>%
  filter(unit == "I15",
         coicop %in% c("CP04", "CP041", "CP043", "CP045"),
         geo %in% c("IT")) %>%
  month_to_date %>%
  left_join(coicop, by = "coicop") %>%
  ggplot(.) + geom_line(aes(x = date, y = values, color = Coicop)) +
  theme_minimal() + xlab("") + ylab("") +
  scale_x_date(breaks = seq(1960, 2020, 5) %>% paste0("-01-01") %>% as.Date,
               labels = date_format("%y")) +
  scale_y_log10(breaks = seq(0, 200, 10)) +
  scale_color_manual(values = viridis(5)[1:4]) +
  theme(legend.position = c(0.7, 0.2),
        legend.title = element_blank())
prc_hicp_cind %>%
  filter(unit == "I15",
         coicop %in% c("CP04", "CP041", "CP043", "CP045"),
         geo %in% c("ES")) %>%
  month_to_date %>%
  left_join(coicop, by = "coicop") %>%
  ggplot(.) + geom_line(aes(x = date, y = values, color = Coicop)) +
  theme_minimal() + xlab("") + ylab("") +
  scale_x_date(breaks = seq(1960, 2020, 5) %>% paste0("-01-01") %>% as.Date,
               labels = date_format("%y")) +
  scale_y_log10(breaks = seq(0, 200, 10)) +
  scale_color_manual(values = viridis(5)[1:4]) +
  theme(legend.position = c(0.7, 0.2),
        legend.title = element_blank())
prc_hicp_cind %>%
  filter(unit == "I15",
         coicop %in% c("CP04", "CP041", "CP043", "CP045"),
         geo %in% c("EL")) %>%
  month_to_date %>%
  left_join(coicop, by = "coicop") %>%
  ggplot(.) + geom_line(aes(x = date, y = values, color = Coicop)) +
  theme_minimal() + xlab("") + ylab("") +
  scale_x_date(breaks = seq(1960, 2020, 5) %>% paste0("-01-01") %>% as.Date,
               labels = date_format("%y")) +
  scale_y_log10(breaks = seq(0, 200, 10)) +
  scale_color_manual(values = viridis(5)[1:4]) +
  theme(legend.position = c(0.7, 0.2),
        legend.title = element_blank())
prc_hicp_cind %>%
  filter(unit == "I15",
         coicop %in% c("CP041"),
         geo %in% c("FR", "DE", "EL", "PT")) %>%
  month_to_date %>%
  left_join(geo, by = "geo") %>%
  ggplot(.) + geom_line(aes(x = date, y = values, color = Geo)) +
  theme_minimal() + xlab("") + ylab("") +
  scale_x_date(breaks = seq(1960, 2020, 2) %>% paste0("-01-01") %>% as.Date,
               labels = date_format("%y")) +
  scale_y_log10(breaks = seq(0, 200, 10)) +
  scale_color_manual(values = viridis(5)[1:4]) +
  theme(legend.position = c(0.7, 0.2),
        legend.title = element_blank())
prc_hicp_cind %>%
  filter(unit == "I15",
         coicop %in% c("CP041"),
         geo %in% c("ES", "CH", "AT", "IE")) %>%
  month_to_date %>%
  left_join(geo, by = "geo") %>%
  ggplot(.) + geom_line(aes(x = date, y = values, color = Geo)) +
  theme_minimal() + xlab("") + ylab("") +
  scale_x_date(breaks = seq(1960, 2020, 5) %>% paste0("-01-01") %>% as.Date,
               labels = date_format("%y")) +
  scale_y_log10(breaks = seq(0, 200, 10)) +
  scale_color_manual(values = viridis(5)[1:4]) +
  theme(legend.position = c(0.7, 0.2),
        legend.title = element_blank())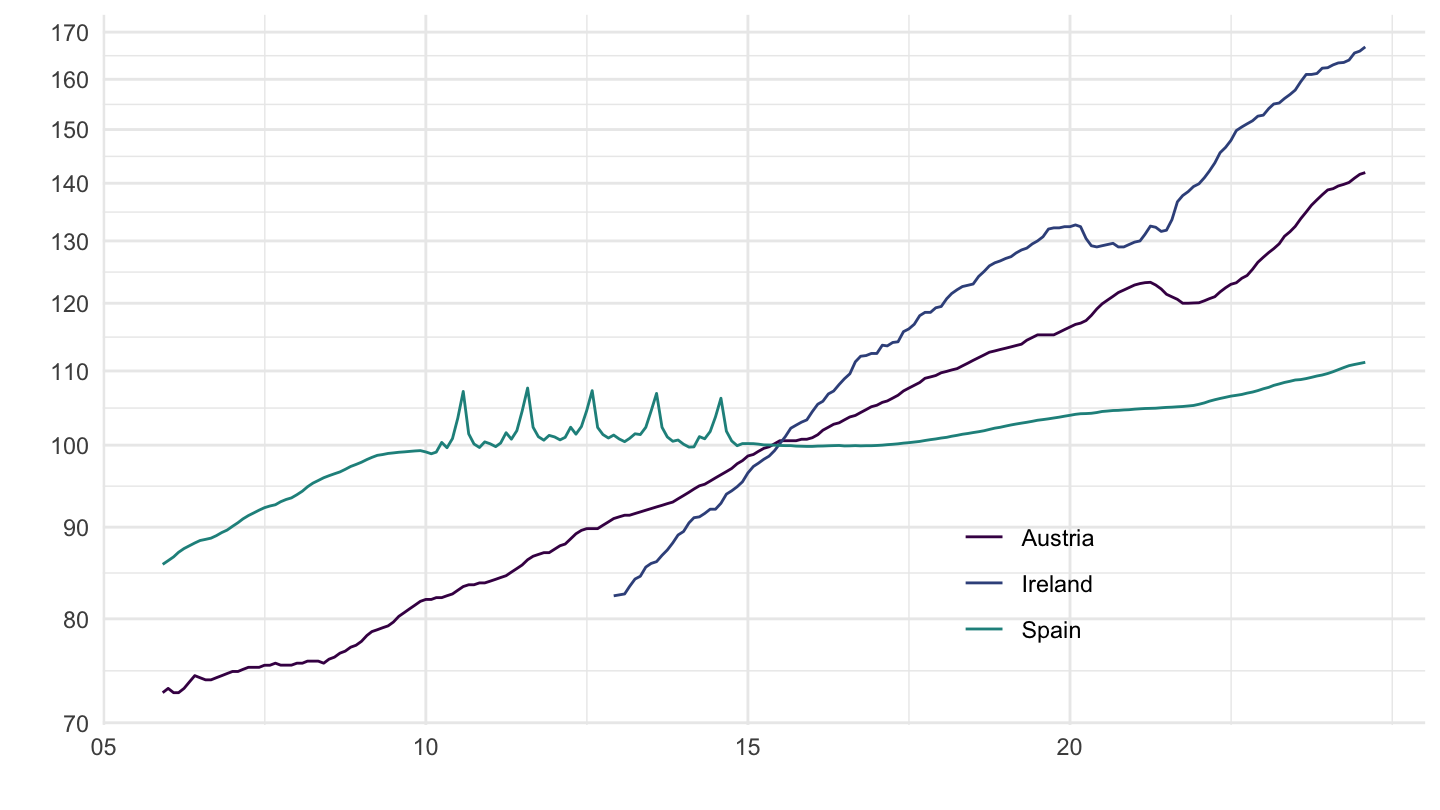
prc_hicp_cind %>%
  filter(unit == "I15",
         coicop %in% c("CP041"),
         geo %in% c("UK", "IS", "LU", "NO")) %>%
  month_to_date %>%
  left_join(geo, by = "geo") %>%
  ggplot(.) + geom_line(aes(x = date, y = values, color = Geo)) +
  theme_minimal() + xlab("") + ylab("") +
  scale_x_date(breaks = seq(1960, 2020, 5) %>% paste0("-01-01") %>% as.Date,
               labels = date_format("%y")) +
  scale_y_log10(breaks = seq(0, 200, 10)) +
  scale_color_manual(values = viridis(5)[1:4]) +
  theme(legend.position = c(0.7, 0.2),
        legend.title = element_blank())
prc_hicp_cind %>%
  filter(unit == "I15",
         coicop %in% c("CP01", "CP02", "CP03", "CP04"),
         geo %in% c("FR")) %>%
  month_to_date %>%
  left_join(coicop, by = "coicop") %>%
  ggplot(.) + geom_line(aes(x = date, y = values, color = Coicop)) +
  theme_minimal() + xlab("") + ylab("") +
  scale_x_date(breaks = seq(1960, 2020, 5) %>% paste0("-01-01") %>% as.Date,
               labels = date_format("%y")) +
  scale_y_log10(breaks = seq(0, 200, 10)) +
  scale_color_manual(values = viridis(5)[1:4]) +
  theme(legend.position = c(0.7, 0.2),
        legend.title = element_blank())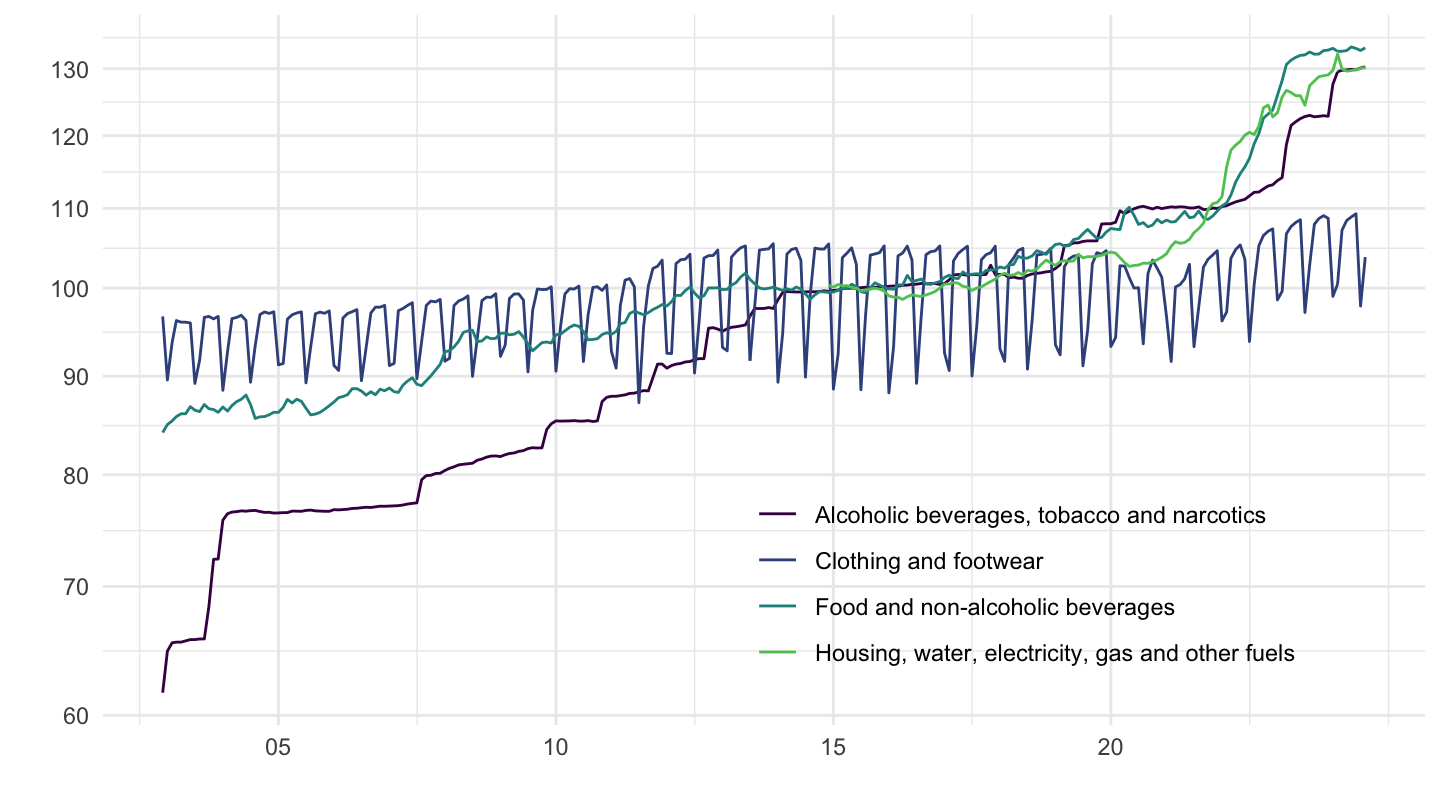
prc_hicp_cind %>%
  filter(unit == "I15",
         coicop %in% c("CP05", "CP06", "CP07", "CP08"),
         geo %in% c("FR")) %>%
  month_to_date %>%
  left_join(coicop, by = "coicop") %>%
  ggplot(.) + geom_line(aes(x = date, y = values, color = Coicop)) +
  theme_minimal() + xlab("") + ylab("") +
  scale_x_date(breaks = seq(1960, 2020, 5) %>% paste0("-01-01") %>% as.Date,
               labels = date_format("%y")) +
  scale_y_log10(breaks = seq(0, 200, 10)) +
  scale_color_manual(values = viridis(5)[1:4]) +
  theme(legend.position = c(0.7, 0.2),
        legend.title = element_blank())
prc_hicp_cind %>%
  filter(unit == "I15",
         coicop %in% c("CP09", "CP10", "CP11", "CP12"),
         geo %in% c("FR")) %>%
  month_to_date %>%
  left_join(coicop, by = "coicop") %>%
  ggplot(.) + geom_line(aes(x = date, y = values, color = Coicop)) +
  theme_minimal() + xlab("") + ylab("") +
  scale_x_date(breaks = seq(1960, 2020, 5) %>% paste0("-01-01") %>% as.Date,
               labels = date_format("%y")) +
  scale_y_log10(breaks = seq(0, 200, 10)) +
  scale_color_manual(values = viridis(5)[1:4]) +
  theme(legend.position = c(0.7, 0.2),
        legend.title = element_blank())
prc_hicp_cind %>%
  filter(unit == "I15",
         coicop %in% c("CP01", "CP02", "CP03", "CP04"),
         geo %in% c("DE")) %>%
  month_to_date %>%
  left_join(coicop, by = "coicop") %>%
  ggplot(.) + geom_line(aes(x = date, y = values, color = Coicop)) +
  theme_minimal() + xlab("") + ylab("") +
  scale_x_date(breaks = seq(1960, 2020, 5) %>% paste0("-01-01") %>% as.Date,
               labels = date_format("%y")) +
  scale_y_log10(breaks = seq(0, 200, 10)) +
  scale_color_manual(values = viridis(5)[1:4]) +
  theme(legend.position = c(0.7, 0.2),
        legend.title = element_blank())
prc_hicp_cind %>%
  filter(unit == "I15",
         coicop %in% c("CP05", "CP06", "CP07", "CP08"),
         geo %in% c("DE")) %>%
  month_to_date %>%
  left_join(coicop, by = "coicop") %>%
  ggplot(.) + geom_line(aes(x = date, y = values, color = Coicop)) +
  theme_minimal() + xlab("") + ylab("") +
  scale_x_date(breaks = seq(1960, 2020, 5) %>% paste0("-01-01") %>% as.Date,
               labels = date_format("%y")) +
  scale_y_log10(breaks = seq(0, 200, 10)) +
  scale_color_manual(values = viridis(5)[1:4]) +
  theme(legend.position = c(0.7, 0.8),
        legend.title = element_blank())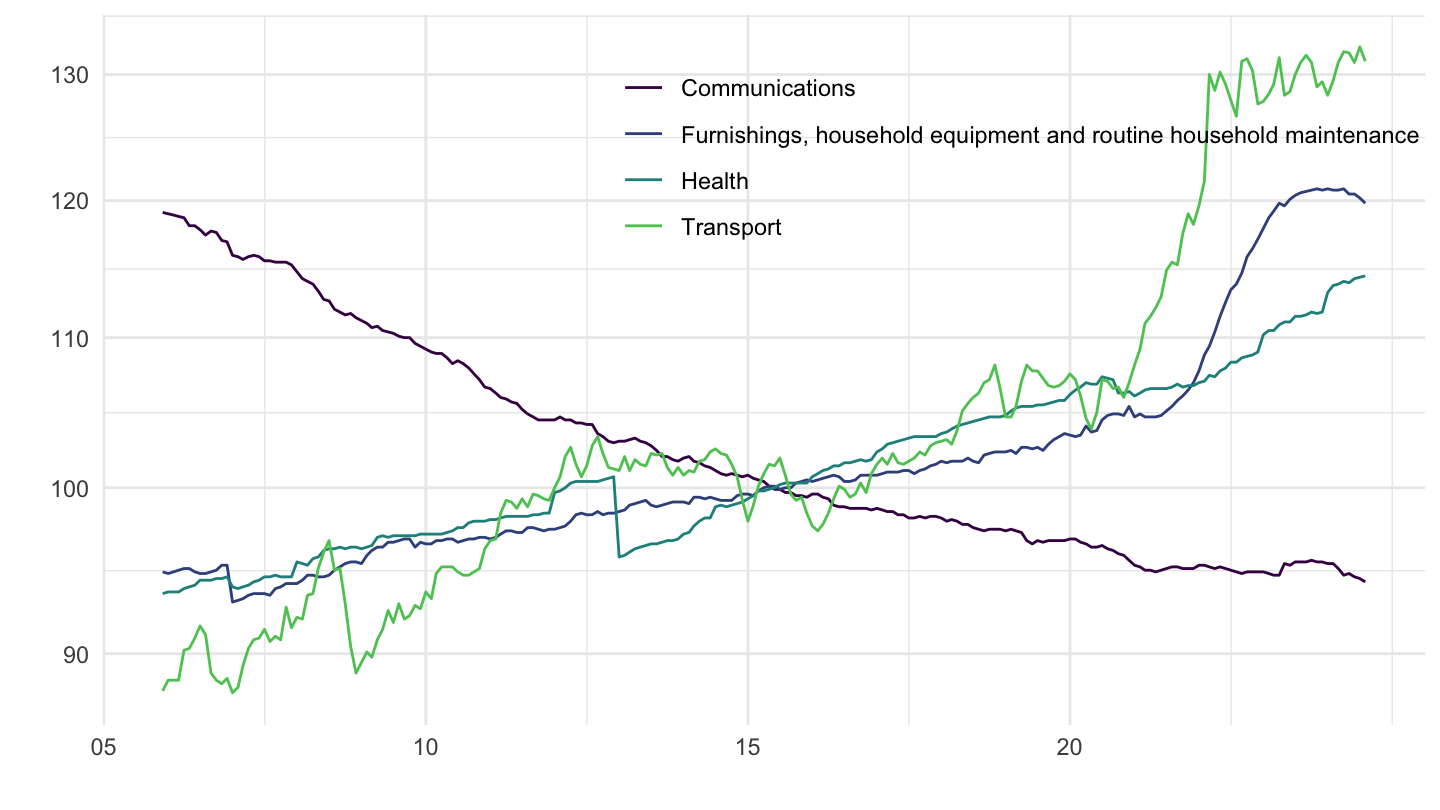
prc_hicp_cind %>%
  filter(unit == "I15",
         coicop %in% c("CP09", "CP10", "CP11", "CP12"),
         geo %in% c("DE")) %>%
  month_to_date %>%
  left_join(coicop, by = "coicop") %>%
  ggplot(.) + geom_line(aes(x = date, y = values, color = Coicop)) +
  theme_minimal() + xlab("") + ylab("") +
  scale_x_date(breaks = seq(1960, 2020, 5) %>% paste0("-01-01") %>% as.Date,
               labels = date_format("%y")) +
  scale_y_log10(breaks = seq(0, 200, 10)) +
  scale_color_manual(values = viridis(5)[1:4]) +
  theme(legend.position = c(0.7, 0.2),
        legend.title = element_blank())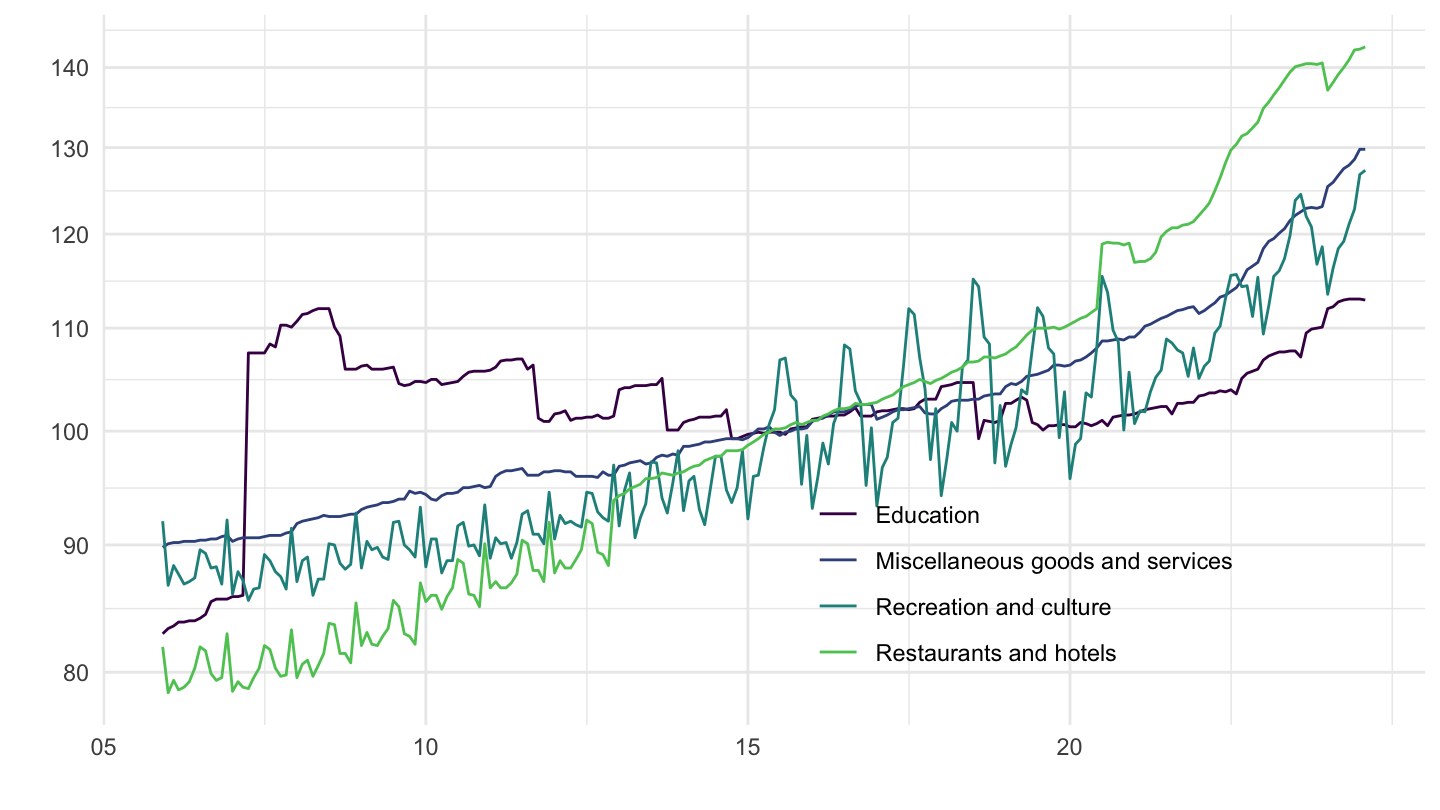
prc_hicp_cind %>%
  filter(unit == "I15",
         coicop %in% c("CP01", "CP02", "CP03", "CP04"),
         geo %in% c("IT")) %>%
  month_to_date %>%
  left_join(coicop, by = "coicop") %>%
  ggplot(.) + geom_line(aes(x = date, y = values, color = Coicop)) +
  theme_minimal() + xlab("") + ylab("") +
  scale_x_date(breaks = seq(1960, 2020, 5) %>% paste0("-01-01") %>% as.Date,
               labels = date_format("%y")) +
  scale_y_log10(breaks = seq(0, 200, 10)) +
  scale_color_manual(values = viridis(5)[1:4]) +
  theme(legend.position = c(0.7, 0.2),
        legend.title = element_blank())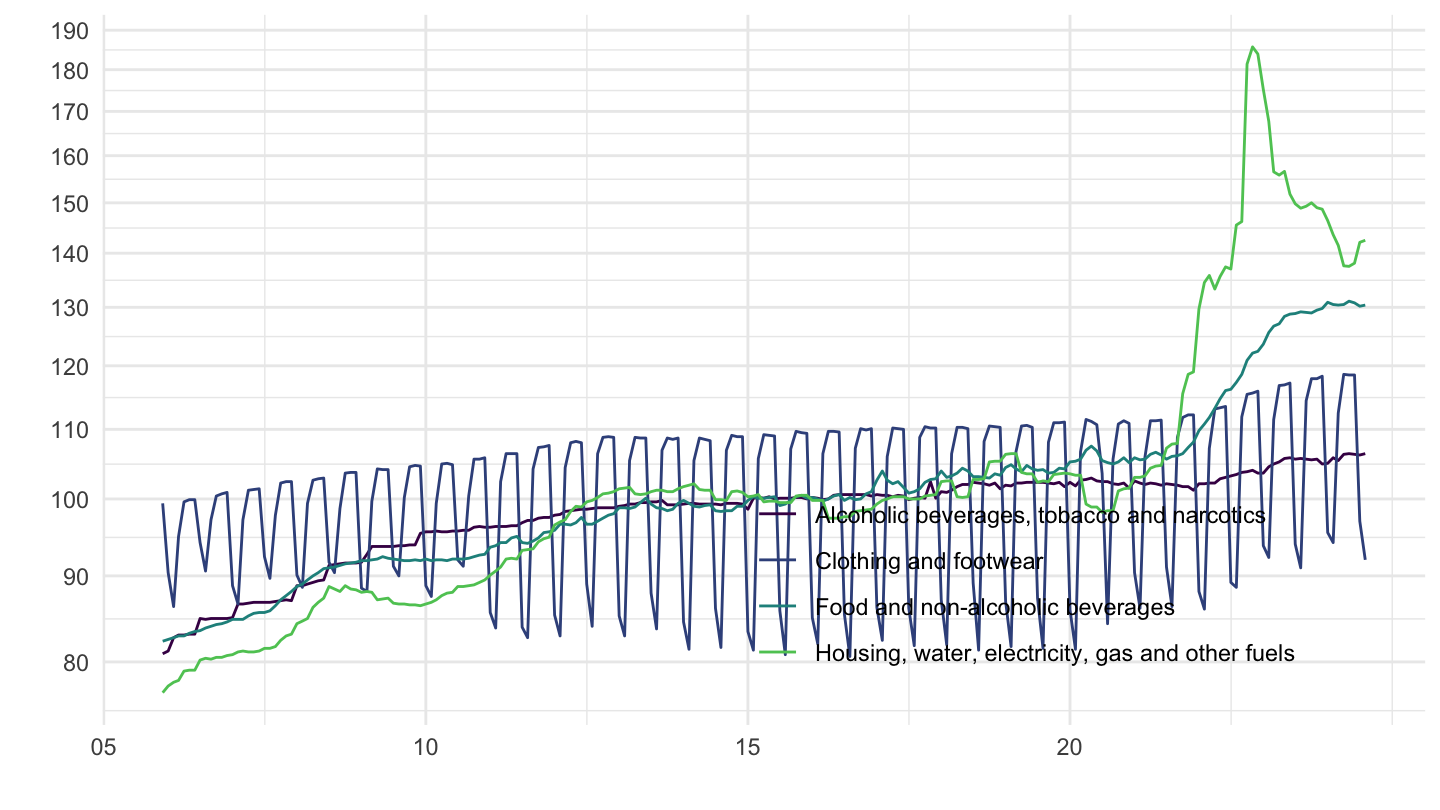
prc_hicp_cind %>%
  filter(unit == "I15",
         coicop %in% c("CP05", "CP06", "CP07", "CP08"),
         geo %in% c("IT")) %>%
  month_to_date %>%
  left_join(coicop, by = "coicop") %>%
  ggplot(.) + geom_line(aes(x = date, y = values, color = Coicop)) +
  theme_minimal() + xlab("") + ylab("") +
  scale_x_date(breaks = seq(1960, 2020, 5) %>% paste0("-01-01") %>% as.Date,
               labels = date_format("%y")) +
  scale_y_log10(breaks = seq(0, 200, 10)) +
  scale_color_manual(values = viridis(5)[1:4]) +
  theme(legend.position = c(0.7, 0.8),
        legend.title = element_blank())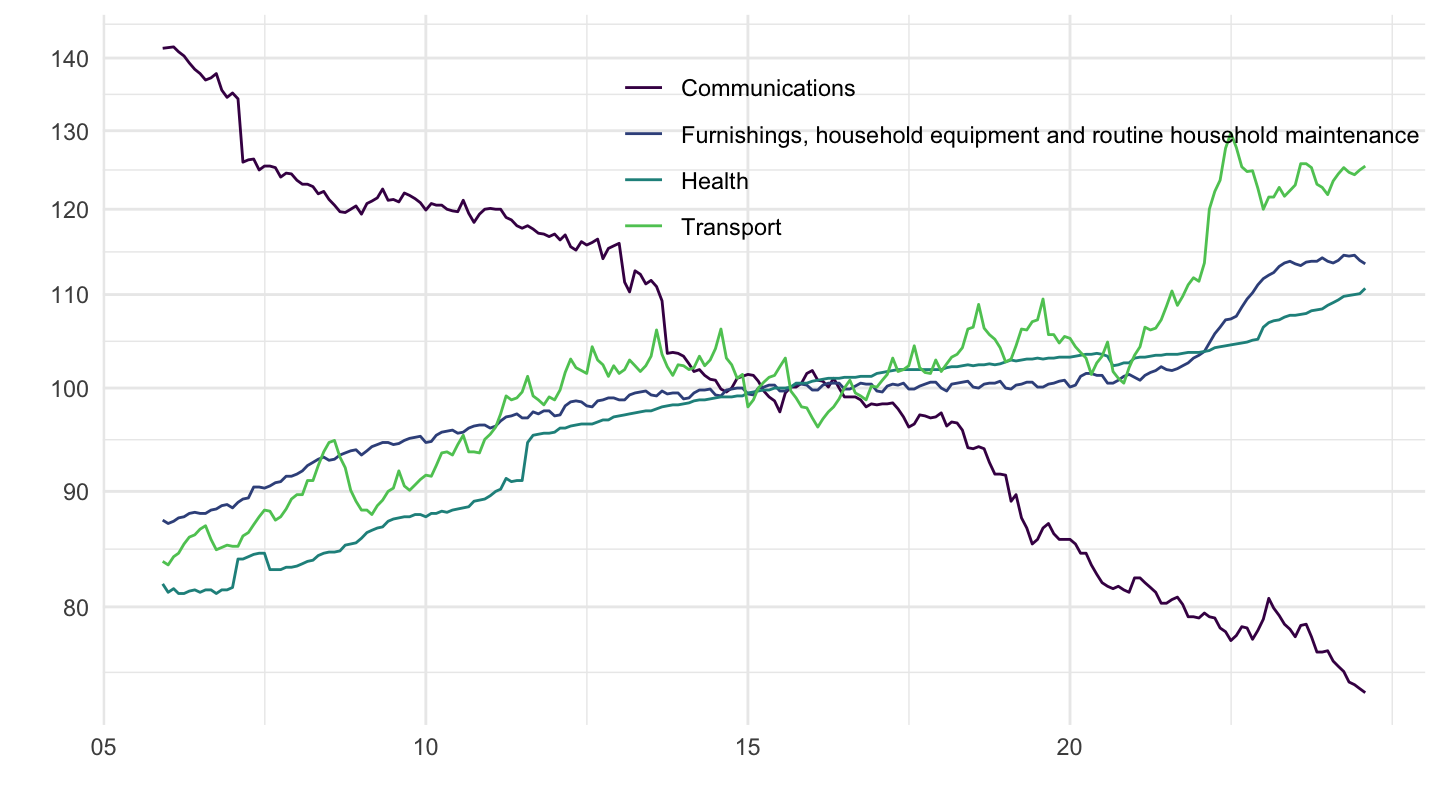
prc_hicp_cind %>%
  filter(unit == "I15",
         coicop %in% c("CP09", "CP10", "CP11", "CP12"),
         geo %in% c("IT")) %>%
  month_to_date %>%
  left_join(coicop, by = "coicop") %>%
  ggplot(.) + geom_line(aes(x = date, y = values, color = Coicop)) +
  theme_minimal() + xlab("") + ylab("") +
  scale_x_date(breaks = seq(1960, 2020, 5) %>% paste0("-01-01") %>% as.Date,
               labels = date_format("%y")) +
  scale_y_log10(breaks = seq(0, 200, 10)) +
  scale_color_manual(values = viridis(5)[1:4]) +
  theme(legend.position = c(0.7, 0.2),
        legend.title = element_blank())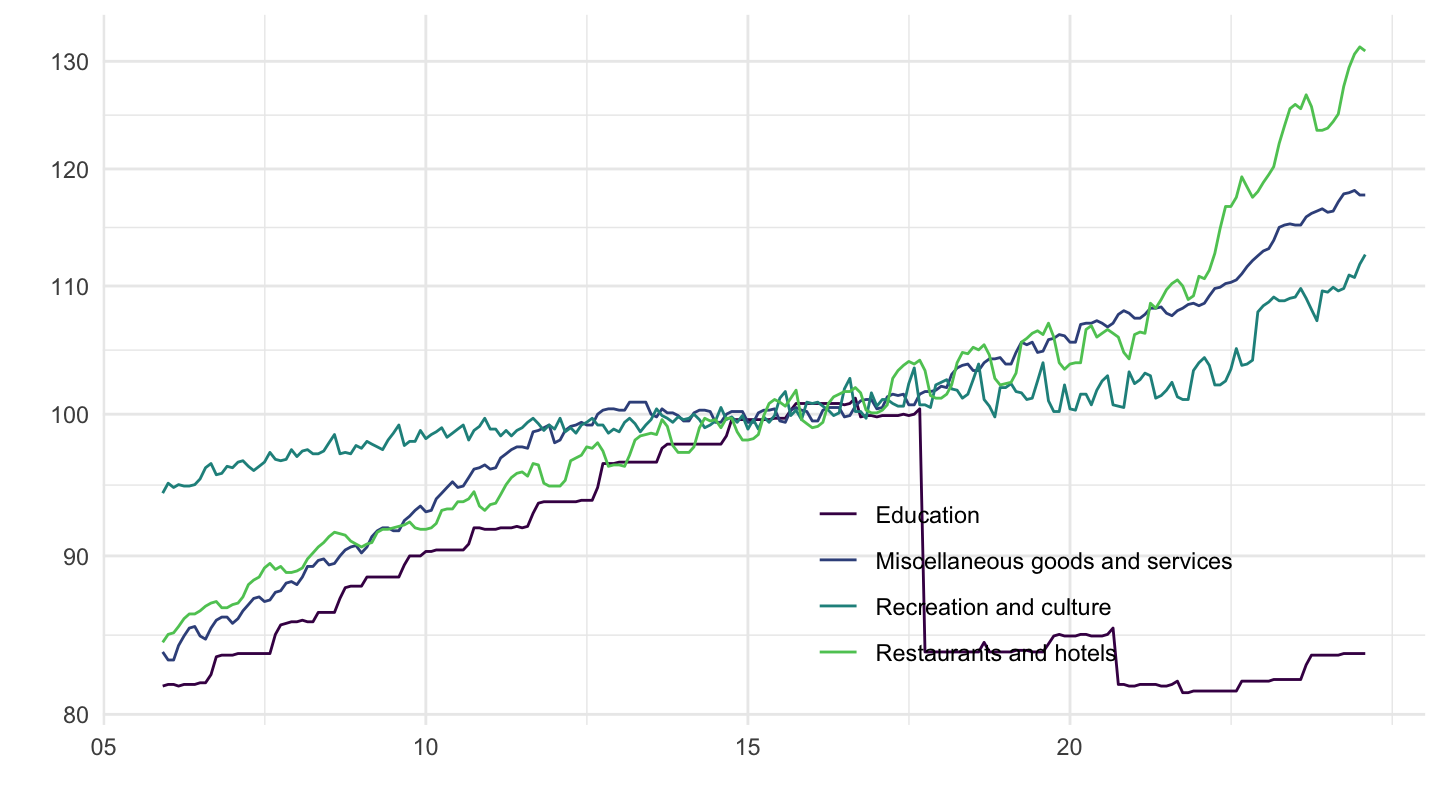
prc_hicp_cind %>%
  filter(unit == "I15",
         coicop %in% c("CP01", "CP02", "CP03", "CP04"),
         geo %in% c("ES")) %>%
  month_to_date %>%
  left_join(coicop, by = "coicop") %>%
  ggplot(.) + geom_line(aes(x = date, y = values, color = Coicop)) +
  theme_minimal() + xlab("") + ylab("") +
  scale_x_date(breaks = seq(1960, 2020, 5) %>% paste0("-01-01") %>% as.Date,
               labels = date_format("%y")) +
  scale_y_log10(breaks = seq(0, 200, 10)) +
  scale_color_manual(values = viridis(5)[1:4]) +
  theme(legend.position = c(0.7, 0.2),
        legend.title = element_blank())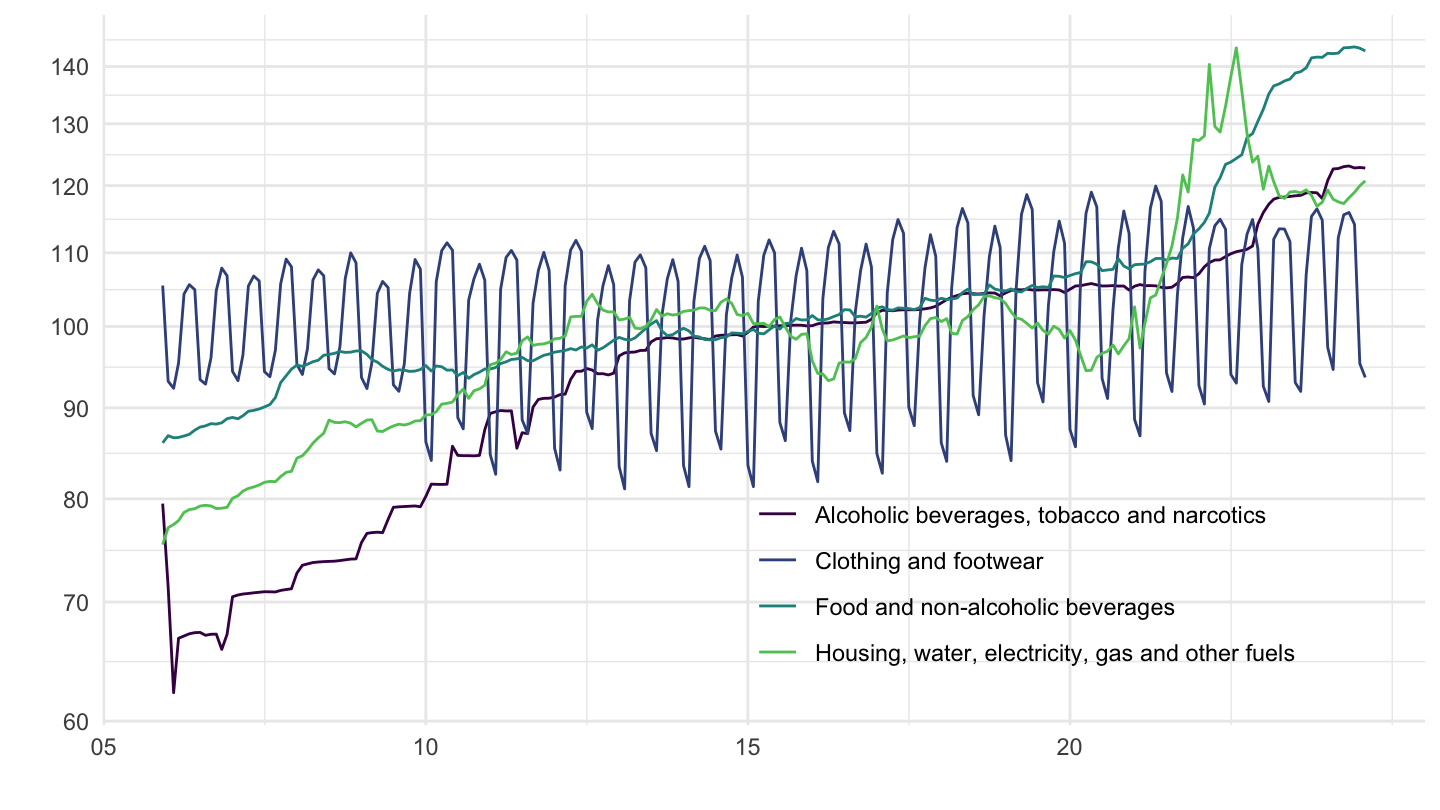
prc_hicp_cind %>%
  filter(unit == "I15",
         coicop %in% c("CP05", "CP06", "CP07", "CP08"),
         geo %in% c("ES")) %>%
  month_to_date %>%
  left_join(coicop, by = "coicop") %>%
  ggplot(.) + geom_line(aes(x = date, y = values, color = Coicop)) +
  theme_minimal() + xlab("") + ylab("") +
  scale_x_date(breaks = seq(1960, 2020, 5) %>% paste0("-01-01") %>% as.Date,
               labels = date_format("%y")) +
  scale_y_log10(breaks = seq(0, 200, 10)) +
  scale_color_manual(values = viridis(5)[1:4]) +
  theme(legend.position = c(0.7, 0.8),
        legend.title = element_blank())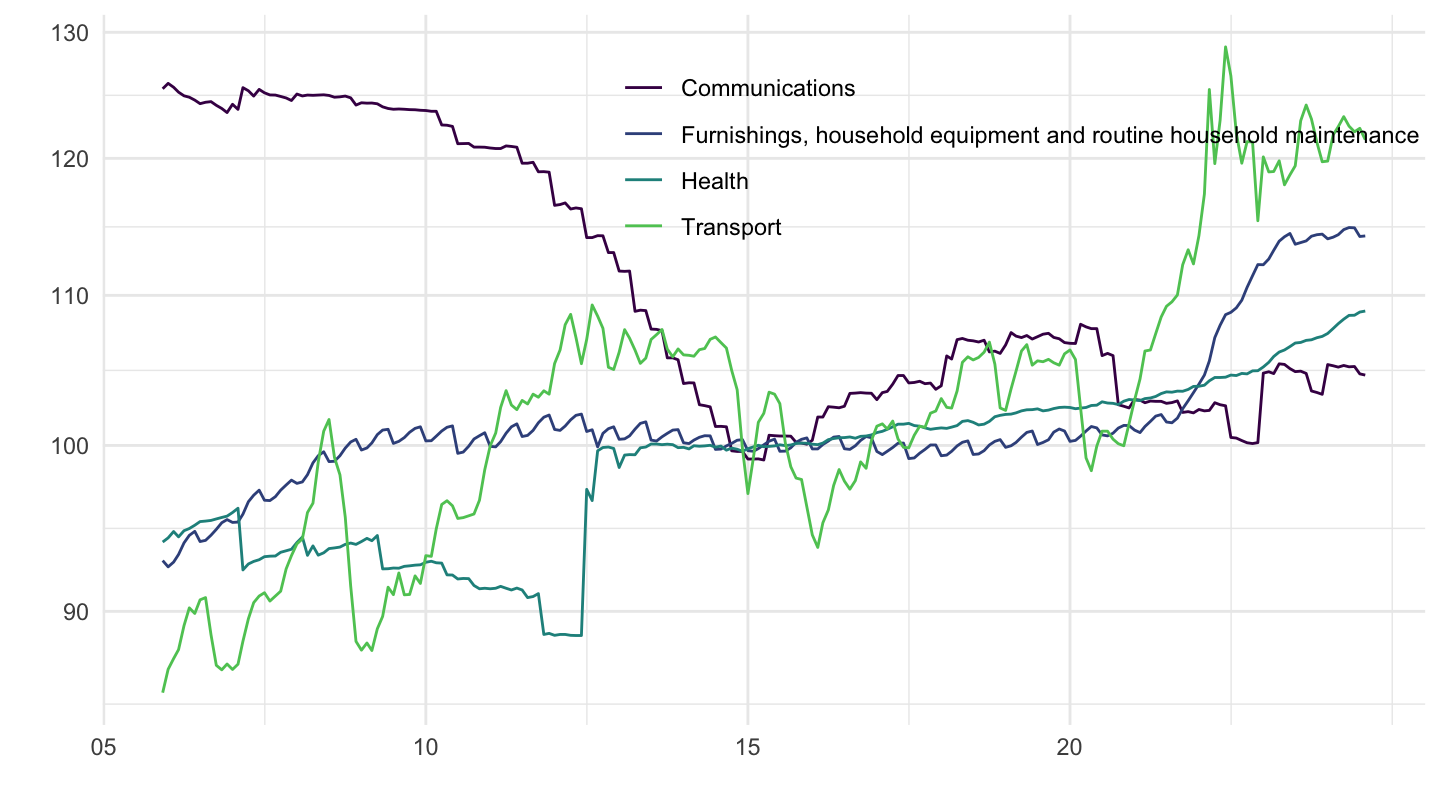
prc_hicp_cind %>%
  filter(unit == "I15",
         coicop %in% c("CP09", "CP10", "CP11", "CP12"),
         geo %in% c("ES")) %>%
  month_to_date %>%
  left_join(coicop, by = "coicop") %>%
  ggplot(.) + geom_line(aes(x = date, y = values, color = Coicop)) +
  theme_minimal() + xlab("") + ylab("") +
  scale_x_date(breaks = seq(1960, 2020, 5) %>% paste0("-01-01") %>% as.Date,
               labels = date_format("%y")) +
  scale_y_log10(breaks = seq(0, 200, 10)) +
  scale_color_manual(values = viridis(5)[1:4]) +
  theme(legend.position = c(0.7, 0.2),
        legend.title = element_blank())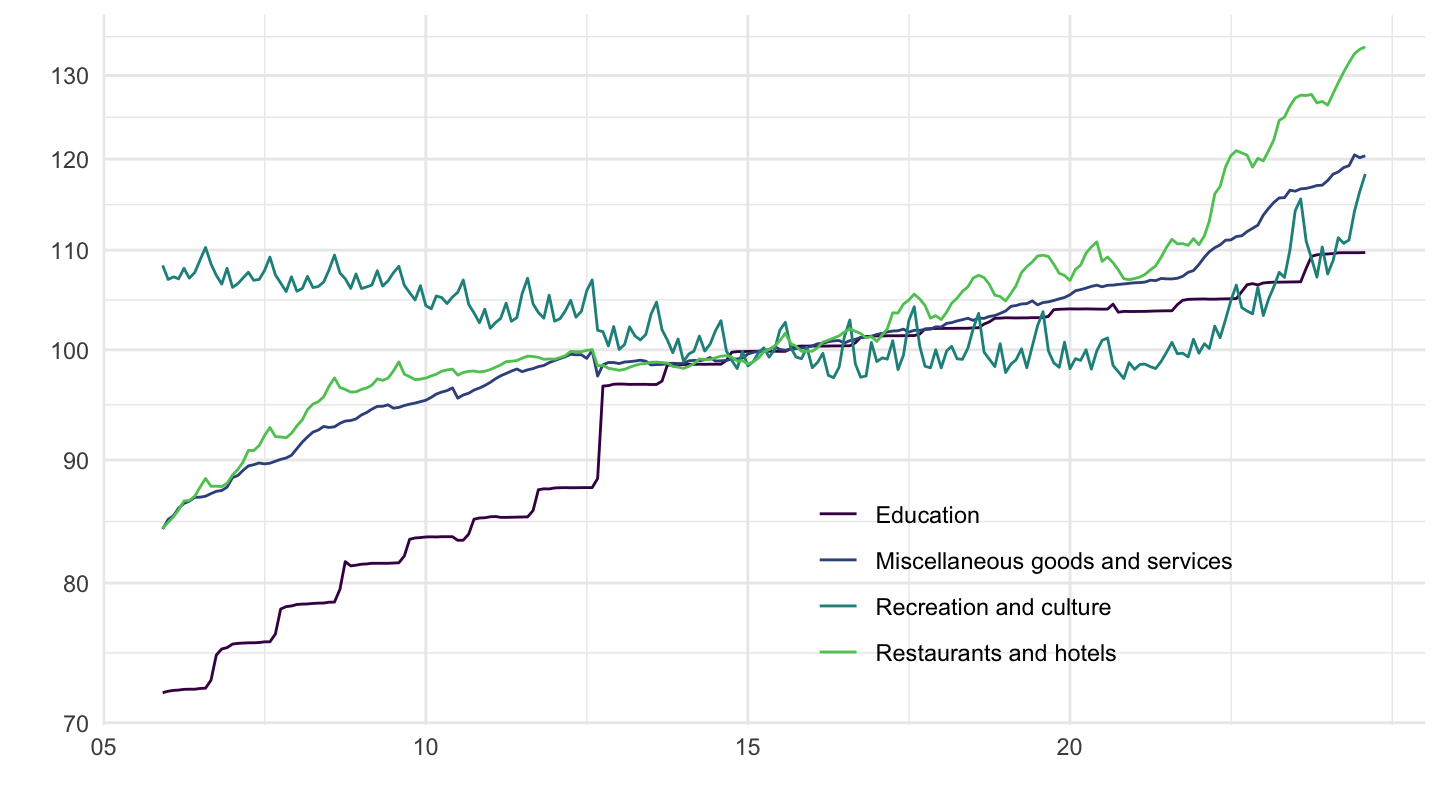
prc_hicp_cind %>%
  filter(unit == "I15",
         coicop %in% c("CP01", "CP02", "CP03", "CP04"),
         geo %in% c("EL")) %>%
  month_to_date %>%
  left_join(coicop, by = "coicop") %>%
  ggplot(.) + geom_line(aes(x = date, y = values, color = Coicop)) +
  theme_minimal() + xlab("") + ylab("") +
  scale_x_date(breaks = seq(1960, 2020, 5) %>% paste0("-01-01") %>% as.Date,
               labels = date_format("%y")) +
  scale_y_log10(breaks = seq(0, 200, 10)) +
  scale_color_manual(values = viridis(5)[1:4]) +
  theme(legend.position = c(0.7, 0.2),
        legend.title = element_blank())
prc_hicp_cind %>%
  filter(unit == "I15",
         coicop %in% c("CP05", "CP06", "CP07", "CP08"),
         geo %in% c("EL")) %>%
  month_to_date %>%
  left_join(coicop, by = "coicop") %>%
  ggplot(.) + geom_line(aes(x = date, y = values, color = Coicop)) +
  theme_minimal() + xlab("") + ylab("") +
  scale_x_date(breaks = seq(1960, 2020, 5) %>% paste0("-01-01") %>% as.Date,
               labels = date_format("%y")) +
  scale_y_log10(breaks = seq(0, 200, 10)) +
  scale_color_manual(values = viridis(5)[1:4]) +
  theme(legend.position = c(0.7, 0.8),
        legend.title = element_blank())
prc_hicp_cind %>%
  filter(unit == "I15",
         coicop %in% c("CP09", "CP10", "CP11", "CP12"),
         geo %in% c("EL")) %>%
  month_to_date %>%
  left_join(coicop, by = "coicop") %>%
  ggplot(.) + geom_line(aes(x = date, y = values, color = Coicop)) +
  theme_minimal() + xlab("") + ylab("") +
  scale_x_date(breaks = seq(1960, 2020, 5) %>% paste0("-01-01") %>% as.Date,
               labels = date_format("%y")) +
  scale_y_log10(breaks = seq(0, 200, 10)) +
  scale_color_manual(values = viridis(5)[1:4]) +
  theme(legend.position = c(0.7, 0.2),
        legend.title = element_blank())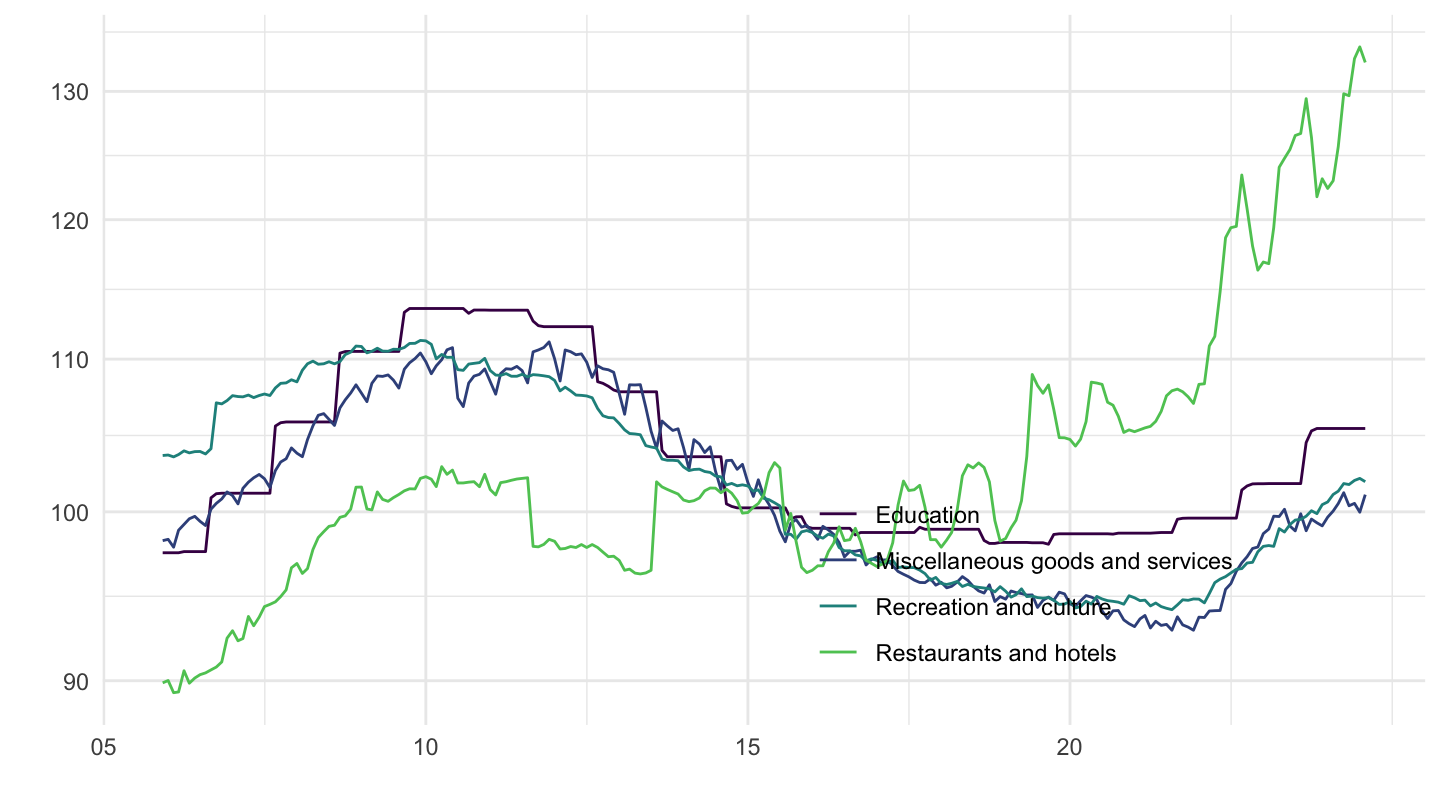
prc_hicp_cind %>%
  filter(unit == "I15",
         coicop %in% c("CP00", "CP041", "CP11", "CP01"),
         geo %in% c("FR")) %>%
  month_to_date %>%
  left_join(coicop, by = "coicop") %>%
  ggplot(.) + geom_line(aes(x = date, y = values, color = Coicop)) +
  theme_minimal() + xlab("") + ylab("") +
  scale_x_date(breaks = seq(1960, 2020, 5) %>% paste0("-01-01") %>% as.Date,
               labels = date_format("%y")) +
  scale_y_log10(breaks = seq(0, 200, 10)) +
  scale_color_manual(values = viridis(5)[1:4]) +
  theme(legend.position = c(0.7, 0.2),
        legend.title = element_blank())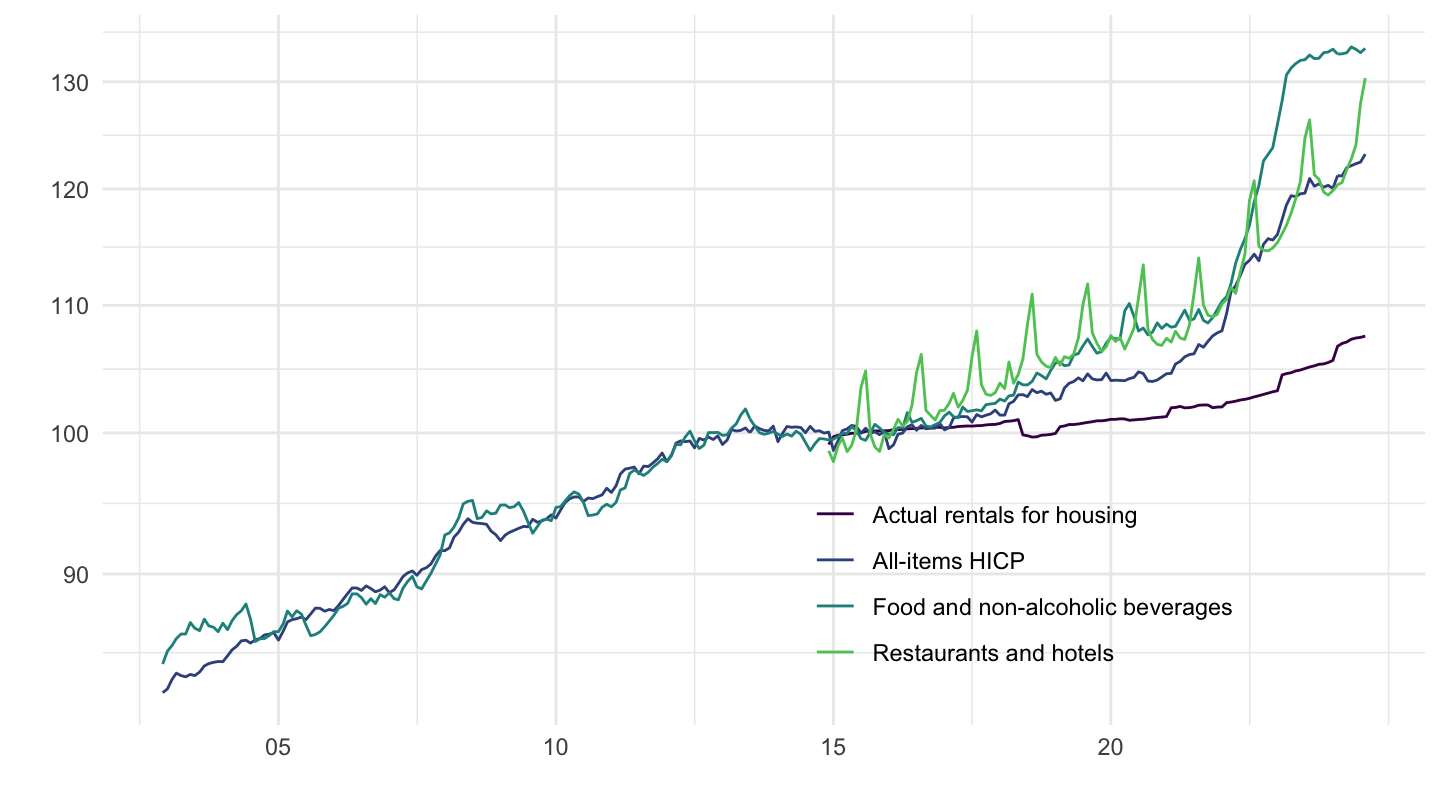
prc_hicp_cind %>%
  filter(unit == "I15",
         coicop %in% c("CP00", "CP041", "CP11", "CP01"),
         geo %in% c("DE")) %>%
  month_to_date %>%
  left_join(coicop, by = "coicop") %>%
  ggplot(.) + geom_line(aes(x = date, y = values, color = Coicop)) +
  theme_minimal() + xlab("") + ylab("") +
  scale_x_date(breaks = seq(1960, 2020, 5) %>% paste0("-01-01") %>% as.Date,
               labels = date_format("%y")) +
  scale_y_log10(breaks = seq(0, 200, 10)) +
  scale_color_manual(values = viridis(5)[1:4]) +
  theme(legend.position = c(0.7, 0.2),
        legend.title = element_blank())
prc_hicp_cind %>%
  filter(unit == "I15",
         coicop %in% c("CP00", "CP041", "CP11", "CP01"),
         geo %in% c("ES")) %>%
  month_to_date %>%
  left_join(coicop, by = "coicop") %>%
  ggplot(.) + geom_line(aes(x = date, y = values, color = Coicop)) +
  theme_minimal() + xlab("") + ylab("") +
  scale_x_date(breaks = seq(1960, 2020, 5) %>% paste0("-01-01") %>% as.Date,
               labels = date_format("%y")) +
  scale_y_log10(breaks = seq(0, 200, 10)) +
  scale_color_manual(values = viridis(5)[1:4]) +
  theme(legend.position = c(0.7, 0.2),
        legend.title = element_blank())
prc_hicp_cind %>%
  filter(unit == "I15",
         coicop %in% c("CP00", "CP041", "CP11", "CP01"),
         geo %in% c("EL")) %>%
  month_to_date %>%
  left_join(coicop, by = "coicop") %>%
  ggplot(.) + geom_line(aes(x = date, y = values, color = Coicop)) +
  theme_minimal() + xlab("") + ylab("") +
  scale_x_date(breaks = seq(1960, 2020, 5) %>% paste0("-01-01") %>% as.Date,
               labels = date_format("%y")) +
  scale_y_log10(breaks = seq(0, 200, 10)) +
  scale_color_manual(values = viridis(5)[1:4]) +
  theme(legend.position = c(0.7, 0.2),
        legend.title = element_blank())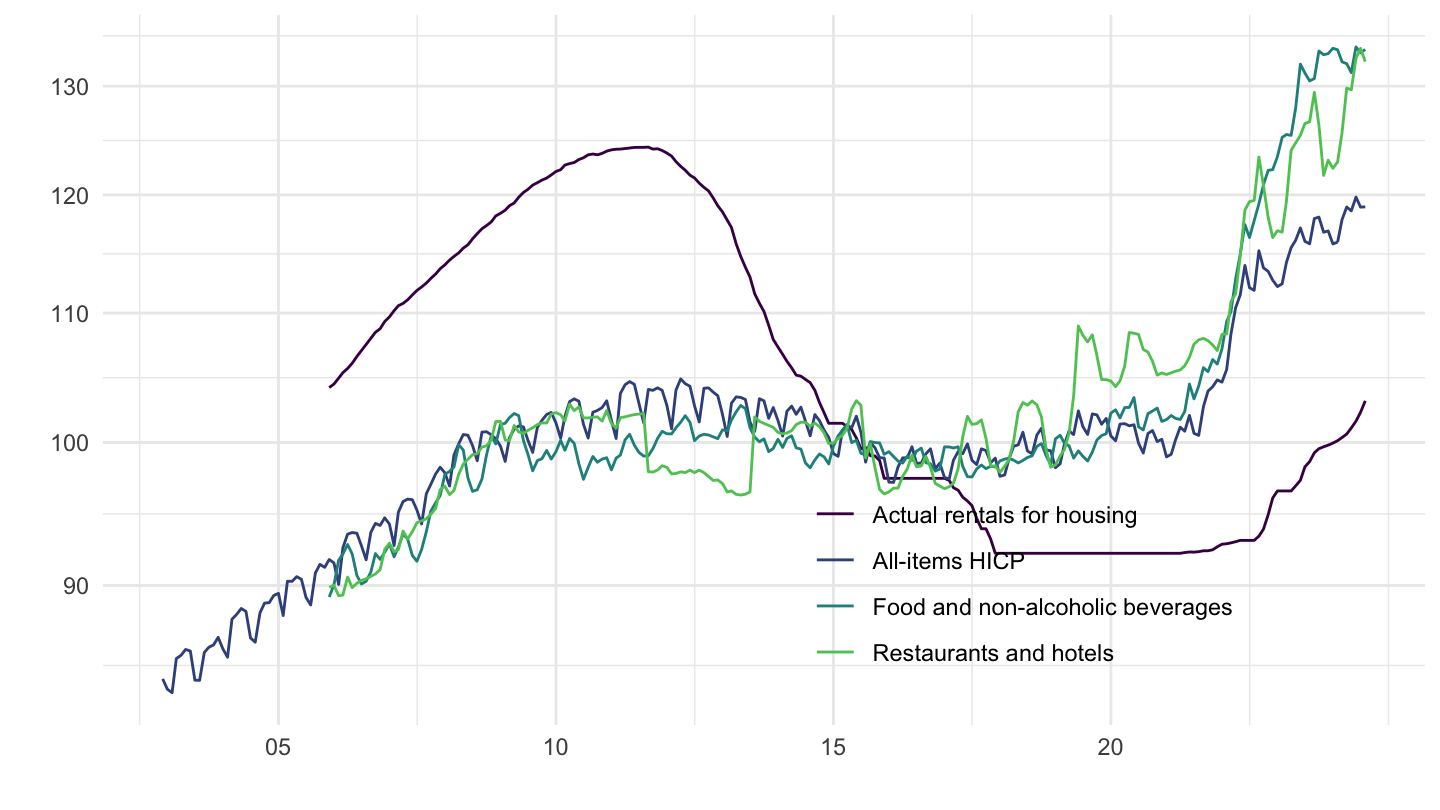
prc_hicp_cind %>%
  filter(unit == "I15",
         coicop %in% c("CP00", "CP041", "CP11", "CP01"),
         geo %in% c("BE")) %>%
  month_to_date %>%
  left_join(coicop, by = "coicop") %>%
  ggplot(.) + geom_line(aes(x = date, y = values, color = Coicop)) +
  theme_minimal() + xlab("") + ylab("") +
  scale_x_date(breaks = seq(1960, 2020, 5) %>% paste0("-01-01") %>% as.Date,
               labels = date_format("%y")) +
  scale_y_log10(breaks = seq(0, 200, 10)) +
  scale_color_manual(values = viridis(5)[1:4]) +
  theme(legend.position = c(0.7, 0.2),
        legend.title = element_blank())