Info
LAST_DOWNLOAD
Code
tibble(LAST_DOWNLOAD = as.Date(file.info("~/iCloud/website/data/eurostat/nrg_cb_gasm.RData")$mtime)) %>%
  print_table_conditional()
Last
Code
nrg_cb_gasm %>%
  group_by(time) %>%
  summarise(Nobs = n()) %>%
  arrange(desc(time)) %>%
  head(1) %>%
  print_table_conditional()
nrg_bal
Code
nrg_cb_gasm %>%
  left_join(nrg_bal, by = "nrg_bal") %>%
  group_by(nrg_bal, Nrg_bal) %>%
  summarise(Nobs = n()) %>%
  arrange(-Nobs) %>%
  print_table_conditional()
| IC_CAL_MG |
Inland consumption - calculated as defined in MOS GAS |
12309 |
| IMP |
Imports |
12246 |
| STK_CHG_MG |
Stock changes - as defined in MOS GAS |
12004 |
| EXP |
Exports |
11838 |
| IPRD |
Indigenous production |
11756 |
| DL |
Distribution losses |
11546 |
| TI_EHG_MAP |
Transformation input - electricity and heat generation - main activity producers |
10735 |
| IC_OBS |
Inland consumption - observed |
10388 |
| STATDIFF |
Statistical differences |
4949 |
| TOS |
Transfer from other sources |
4583 |
| INTMARB |
International maritime bunkers |
4402 |
| FLARE |
Flared |
3934 |
| VENT |
Vented |
3934 |
| STK_CHG_CG |
Change in stock - cushion gas |
2352 |
| FC_OTH |
Final consumption - other sectors |
1317 |
| FC_IND |
Final consumption - industry sector |
1198 |
unit
List
Code
nrg_cb_gasm %>%
  left_join(unit, by = "unit") %>%
  group_by(unit, Unit) %>%
  summarise(Nobs = n()) %>%
  arrange(-Nobs) %>%
  print_table_conditional()
| TJ_GCV |
Terajoule (gross calorific value - GCV) |
67070 |
| MIO_M3 |
Million cubic metres |
52421 |
geo
Code
nrg_cb_gasm %>%
  left_join(geo, by = "geo") %>%
  group_by(geo, Geo) %>%
  summarise(Nobs = n()) %>%
  arrange(-Nobs) %>%
  mutate(Geo = ifelse(geo == "DE", "Germany", Geo)) %>%
  mutate(Flag = gsub(" ", "-", str_to_lower(Geo)),
         Flag = paste0('<img src="../../bib/flags/vsmall/', Flag, '.png" alt="Flag">')) %>%
  select(Flag, everything()) %>%
  {if (is_html_output()) datatable(., filter = 'top', rownames = F, escape = F) else .}
time
Code
nrg_cb_gasm %>%
  group_by(time) %>%
  summarise(Nobs = n()) %>%
  arrange(desc(time)) %>%
  print_table_conditional()
Examples
https://ec.europa.eu/eurostat/en/web/products-eurostat-news/w/DDN-20230419-1
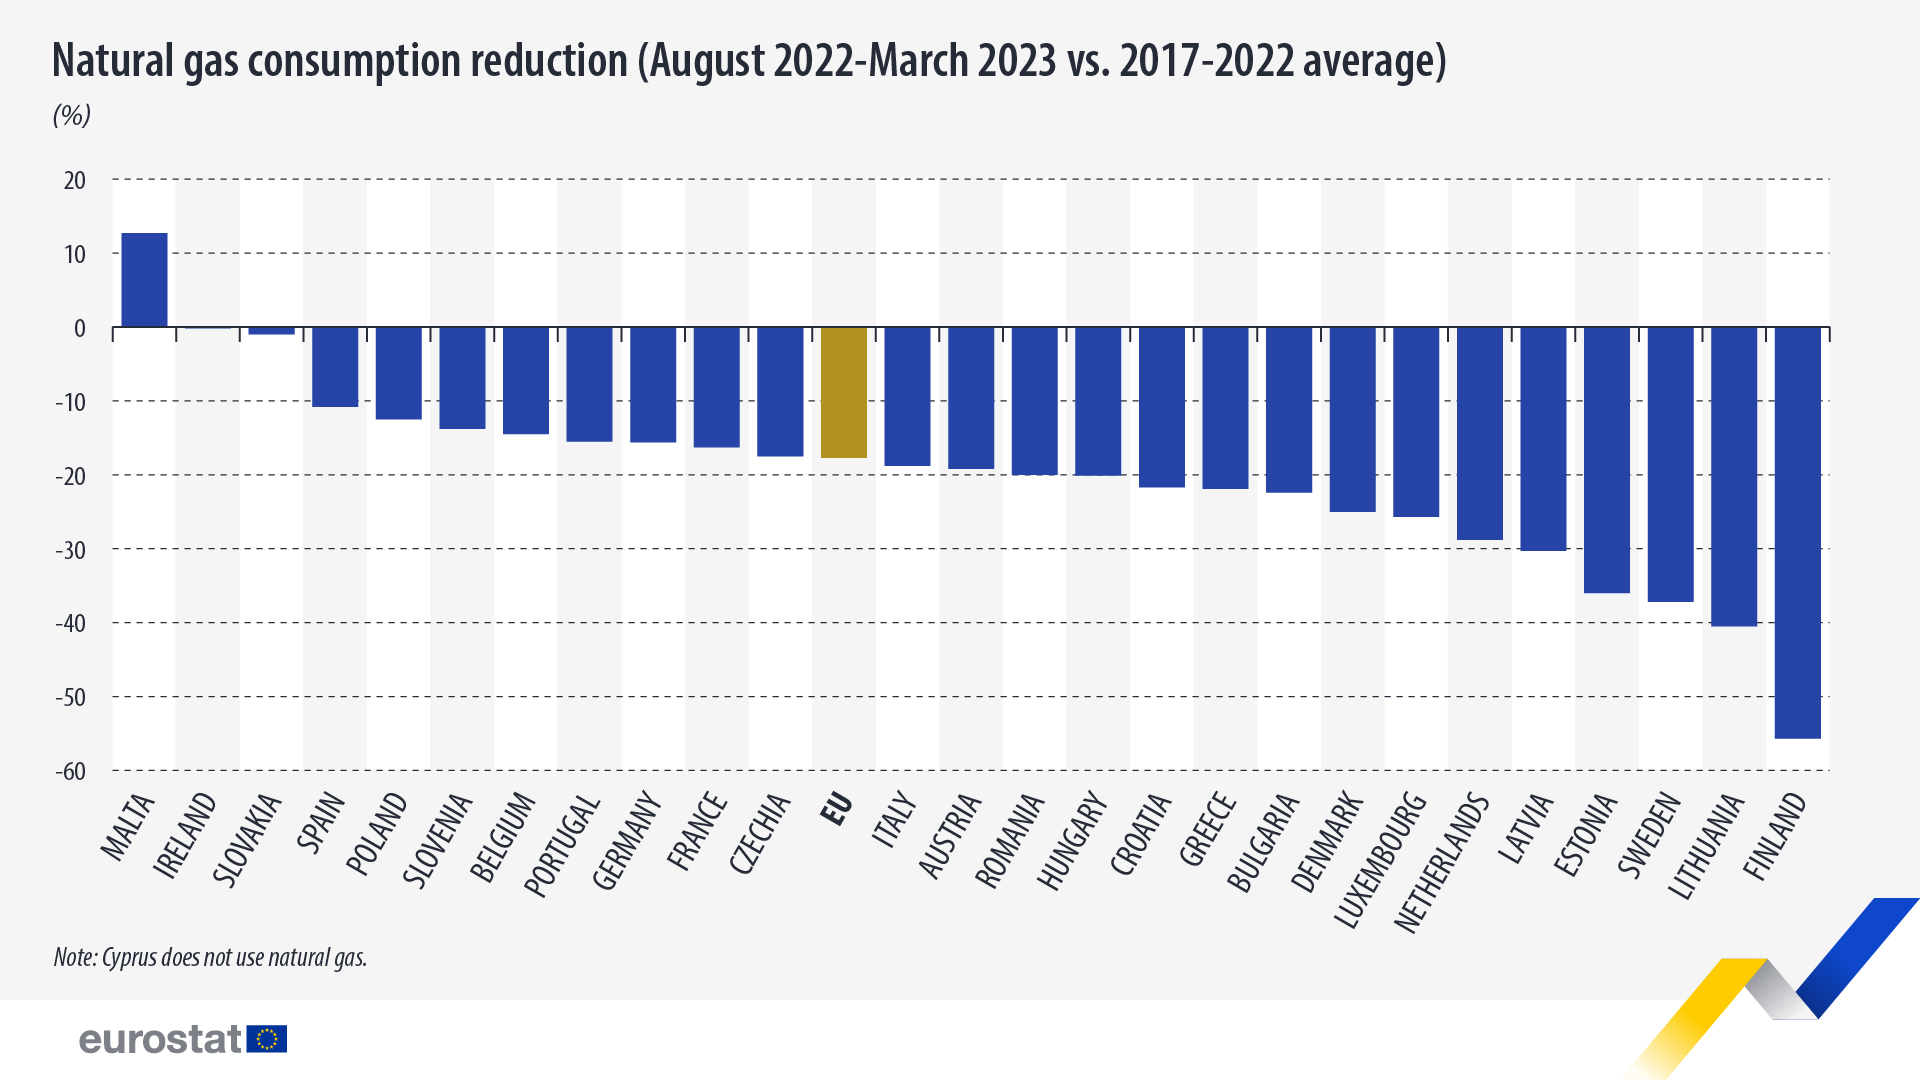
Natural gas consumption reduction (August 2022-March 2023 vs. 2017-2022 average)
Code
include_graphics("https://ec.europa.eu/eurostat/documents/4187653/16179929/Natural_Gas_Consumption_Reduction.png")
Replicate
Average August 2022
Code
nrg_cb_gasm %>%
  month_to_date %>%
  filter(unit == "TJ_GCV",
         nrg_bal == "IC_CAL_MG") %>%
  mutate(period = case_when(date >= as.Date("2022-08-01") ~ "August 2022 - March 2023",
                            (date >= as.Date("2021-08-01") & date <= as.Date("2022-03-01")) |
                             (date >= as.Date("2020-08-01") & date <= as.Date("2021-03-01")) |
                             (date >= as.Date("2019-08-01") & date <= as.Date("2020-03-01")) |
                             (date >= as.Date("2018-08-01") & date <= as.Date("2019-03-01")) |
                             (date >= as.Date("2017-08-01") & date <= as.Date("2018-03-01")) ~ "2017-2022",
                            TRUE ~ NA)) %>%
  filter(!is.na(period)) %>%
  group_by(geo, period) %>%
  summarise(mean = mean(values)) %>%
  spread(period, mean) %>%
  mutate(change = `August 2022 - March 2023`/`2017-2022`-1) %>%
  arrange(change)
# # A tibble: 39 × 4
# # Groups:   geo [39]
#    geo   `2017-2022` `August 2022 - March 2023` change
#    <chr>       <dbl>                      <dbl>  <dbl>
#  1 MD          4304.                      2289. -0.468
#  2 LV          4664.                      2615. -0.439
#  3 EE          1757.                      1033. -0.412
#  4 FI          8532.                      5028. -0.411
#  5 SE          4212.                      2709. -0.357
#  6 FR        167551.                    109133. -0.349
#  7 NL        132631.                     87294. -0.342
#  8 LU          2913.                      1971. -0.323
#  9 LT          7879.                      5347. -0.321
# 10 HU         40090.                     27756. -0.308
# # ℹ 29 more rows
2017-2022
Code
nrg_cb_gasm %>%
  month_to_date %>%
  filter(date >= as.Date("2017-01-01"),
         date <= as.Date("2022-12-31"),
         unit == "TJ_GCV",
         nrg_bal == "IC_CAL_MG") %>%
  group_by(geo) %>%
  summarise(energy = mean(values))
# # A tibble: 39 × 2
#    geo    energy
#    <chr>   <dbl>
#  1 AL       188.
#  2 AT     28594.
#  3 BE     56622.
#  4 BG      9823.
#  5 CY         0
#  6 CZ     27524.
#  7 DE    286278.
#  8 DK      9525.
#  9 EE      1445.
# 10 EL     17878.
# # ℹ 29 more rows
EU natural gas consumption (calculated), 2017-2023
Code
include_graphics("https://ec.europa.eu/eurostat/documents/4187653/16179929/Natural_Gas_Consumption_Calculated_2017-2023.png")

