
Last observation: 2024 (N = 1125)
First observation: 2000 (N = 1711)
Last data update: 09 sept. 2026, 07:35
Last compile: 04 oct. 2026, 23:36
nama_10r_3popgdp |>
  filter(geo %in% c("FR", "DE", "IT", "ES", "NL")) |>
  year_to_date() |>

  mutate(values = values/1000) |>
  add_flag_color("Geo") |>
  ggplot() + geom_line(aes(x = date, y = values, color = color)) +
  theme_minimal() + scale_color_identity() + add_flags +
  scale_x_date(breaks = as.Date(paste0(seq(1960, 2100, 2), "-01-01")),
               labels = date_format("%Y")) +
  xlab("") + ylab("Population (millions)")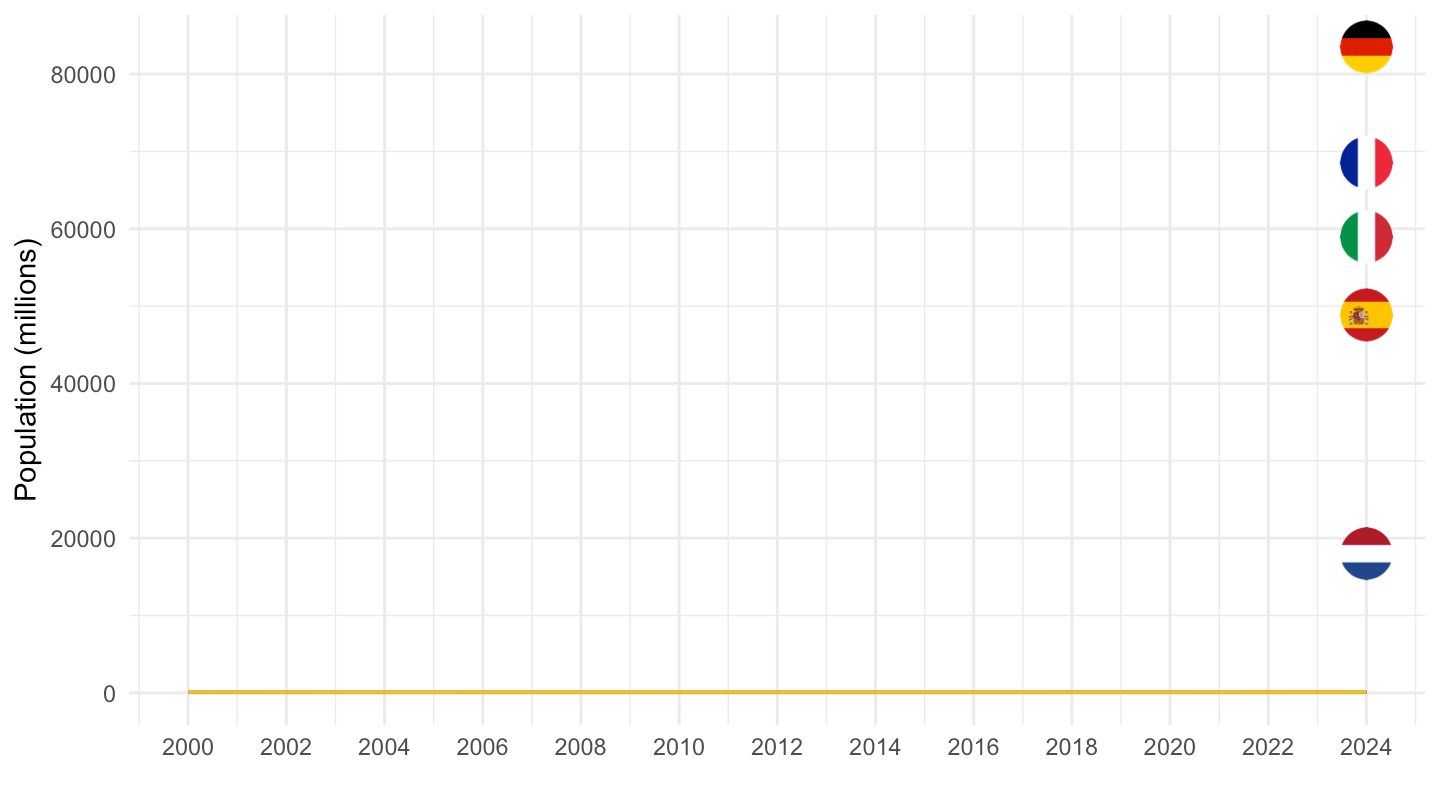
latest_y <- nama_10r_3popgdp |>
  filter(nchar(geo) == 5, grepl("^FR", geo), !is.na(values)) |>
  summarise(m = max(time)) |>
  pull(m)

nama_10r_3popgdp |>
  filter(nchar(geo) == 5, grepl("^FR", geo), time == latest_y) |>
  select(geo, Geo, `Population (thousand)` = values) |>
  arrange(desc(`Population (thousand)`)) |>
  head(15) |>
print_table_conditional()| geo | Geo | Population (thousand) |
|---|---|---|
| FRE11 | Nord | 2621.21 |
| FR101 | Paris | 2093.11 |
| FRL04 | Bouches-du-Rhône | 2083.91 |
| FRK26 | Rhône | 1932.11 |
| FRI12 | Gironde | 1712.31 |
| FR106 | Seine-Saint-Denis | 1705.61 |
| FR105 | Hauts-de-Seine | 1655.81 |
| FRG01 | Loire-Atlantique | 1507.91 |
| FRJ23 | Haute-Garonne | 1491.81 |
| FR103 | Yvelines | 1477.61 |
| FR102 | Seine-et-Marne | 1468.71 |
| FRE12 | Pas-de-Calais | 1459.41 |
| FR107 | Val-de-Marne | 1437.71 |
| FR104 | Essonne | 1335.41 |
| FRK24 | Isère | 1310.61 |