Employment (thousand persons) by NUTS 3 regions - nama_10r_3empers

Data - Eurostat

Info

  • Much missing data. For example, no NUTS3 / NUTS2 sectoral employment in France.

wstatus

Code
nama_10r_3empers %>%
  left_join(wstatus, by = "wstatus") %>%
  group_by(wstatus, Wstatus) %>%
  summarise(Nobs = n()) %>%
  arrange(-Nobs) %>%
  {if (is_html_output()) print_table(.) else .}
wstatus Wstatus Nobs
EMP Employed persons 461267
SAL Employees 454790

nace_r2

Code
nama_10r_3empers %>%
  left_join(nace_r2, by = "nace_r2") %>%
  group_by(nace_r2, Nace_r2) %>%
  summarise(Nobs = n()) %>%
  arrange(-Nobs) %>%
  {if (is_html_output()) datatable(., filter = 'top', rownames = F) else .}

geo

Code
nama_10r_3empers %>%
  left_join(geo, by = "geo") %>%
  group_by(geo, Geo) %>%
  summarise(Nobs = n()) %>%
  arrange(-Nobs) %>%
  {if (is_html_output()) datatable(., filter = 'top', rownames = F) else .}

Employment

NUTS 2

Code
nama_10r_3empers %>%
  filter(time == "2015", 
         nchar(geo) == 4,
         wstatus == "EMP",
         nace_r2 %in% c("TOTAL", "B-E")) %>%
  left_join(geo, by = "geo") %>%
  spread(nace_r2, values) %>%
  mutate(`Share (%)` = round(100* `B-E` / TOTAL, 1)) %>%
  arrange(- `Share (%)`) %>%
  select(geo, Geo, `Share (%)`) %>%
  {if (is_html_output()) datatable(., filter = 'top', rownames = F) else .}

NUTS 3

Code
nama_10r_3empers %>%
  filter(time == "2015", 
         nchar(geo) == 5,
         wstatus == "EMP",
         nace_r2 %in% c("TOTAL", "B-E")) %>%
  left_join(geo, by = "geo") %>%
  spread(nace_r2, values) %>%
  mutate(`Share (%)` = round(100* `B-E` / TOTAL, 1)) %>%
  arrange(- `Share (%)`) %>%
  select(geo, Geo, `Share (%)`) %>%
  {if (is_html_output()) datatable(., filter = 'top', rownames = F) else .}

NUTS 1

Code
nama_10r_3empers %>%
  filter(time == "2015", 
         nchar(geo) == 3,
         wstatus == "EMP",
         nace_r2 %in% c("TOTAL", "B-E")) %>%
  left_join(geo, by = "geo") %>%
  spread(nace_r2, values) %>%
  mutate(`Share (%)` = round(100* `B-E` / TOTAL, 1)) %>%
  arrange(- `Share (%)`) %>%
  select(geo, Geo, `Share (%)`) %>%
  {if (is_html_output()) datatable(., filter = 'top', rownames = F) else .}

NUTS 0

Code
nama_10r_3empers %>%
  filter(time == "2015", 
         nchar(geo) == 2,
         wstatus == "EMP",
         nace_r2 %in% c("TOTAL", "B-E")) %>%
  left_join(geo, by = "geo") %>%
  spread(nace_r2, values) %>%
  mutate(`Share (%)` = round(100* `B-E` / TOTAL, 1)) %>%
  arrange(- `Share (%)`) %>%
  select(geo, Geo, `Share (%)`) %>%
  {if (is_html_output()) datatable(., filter = 'top', rownames = F) else .}

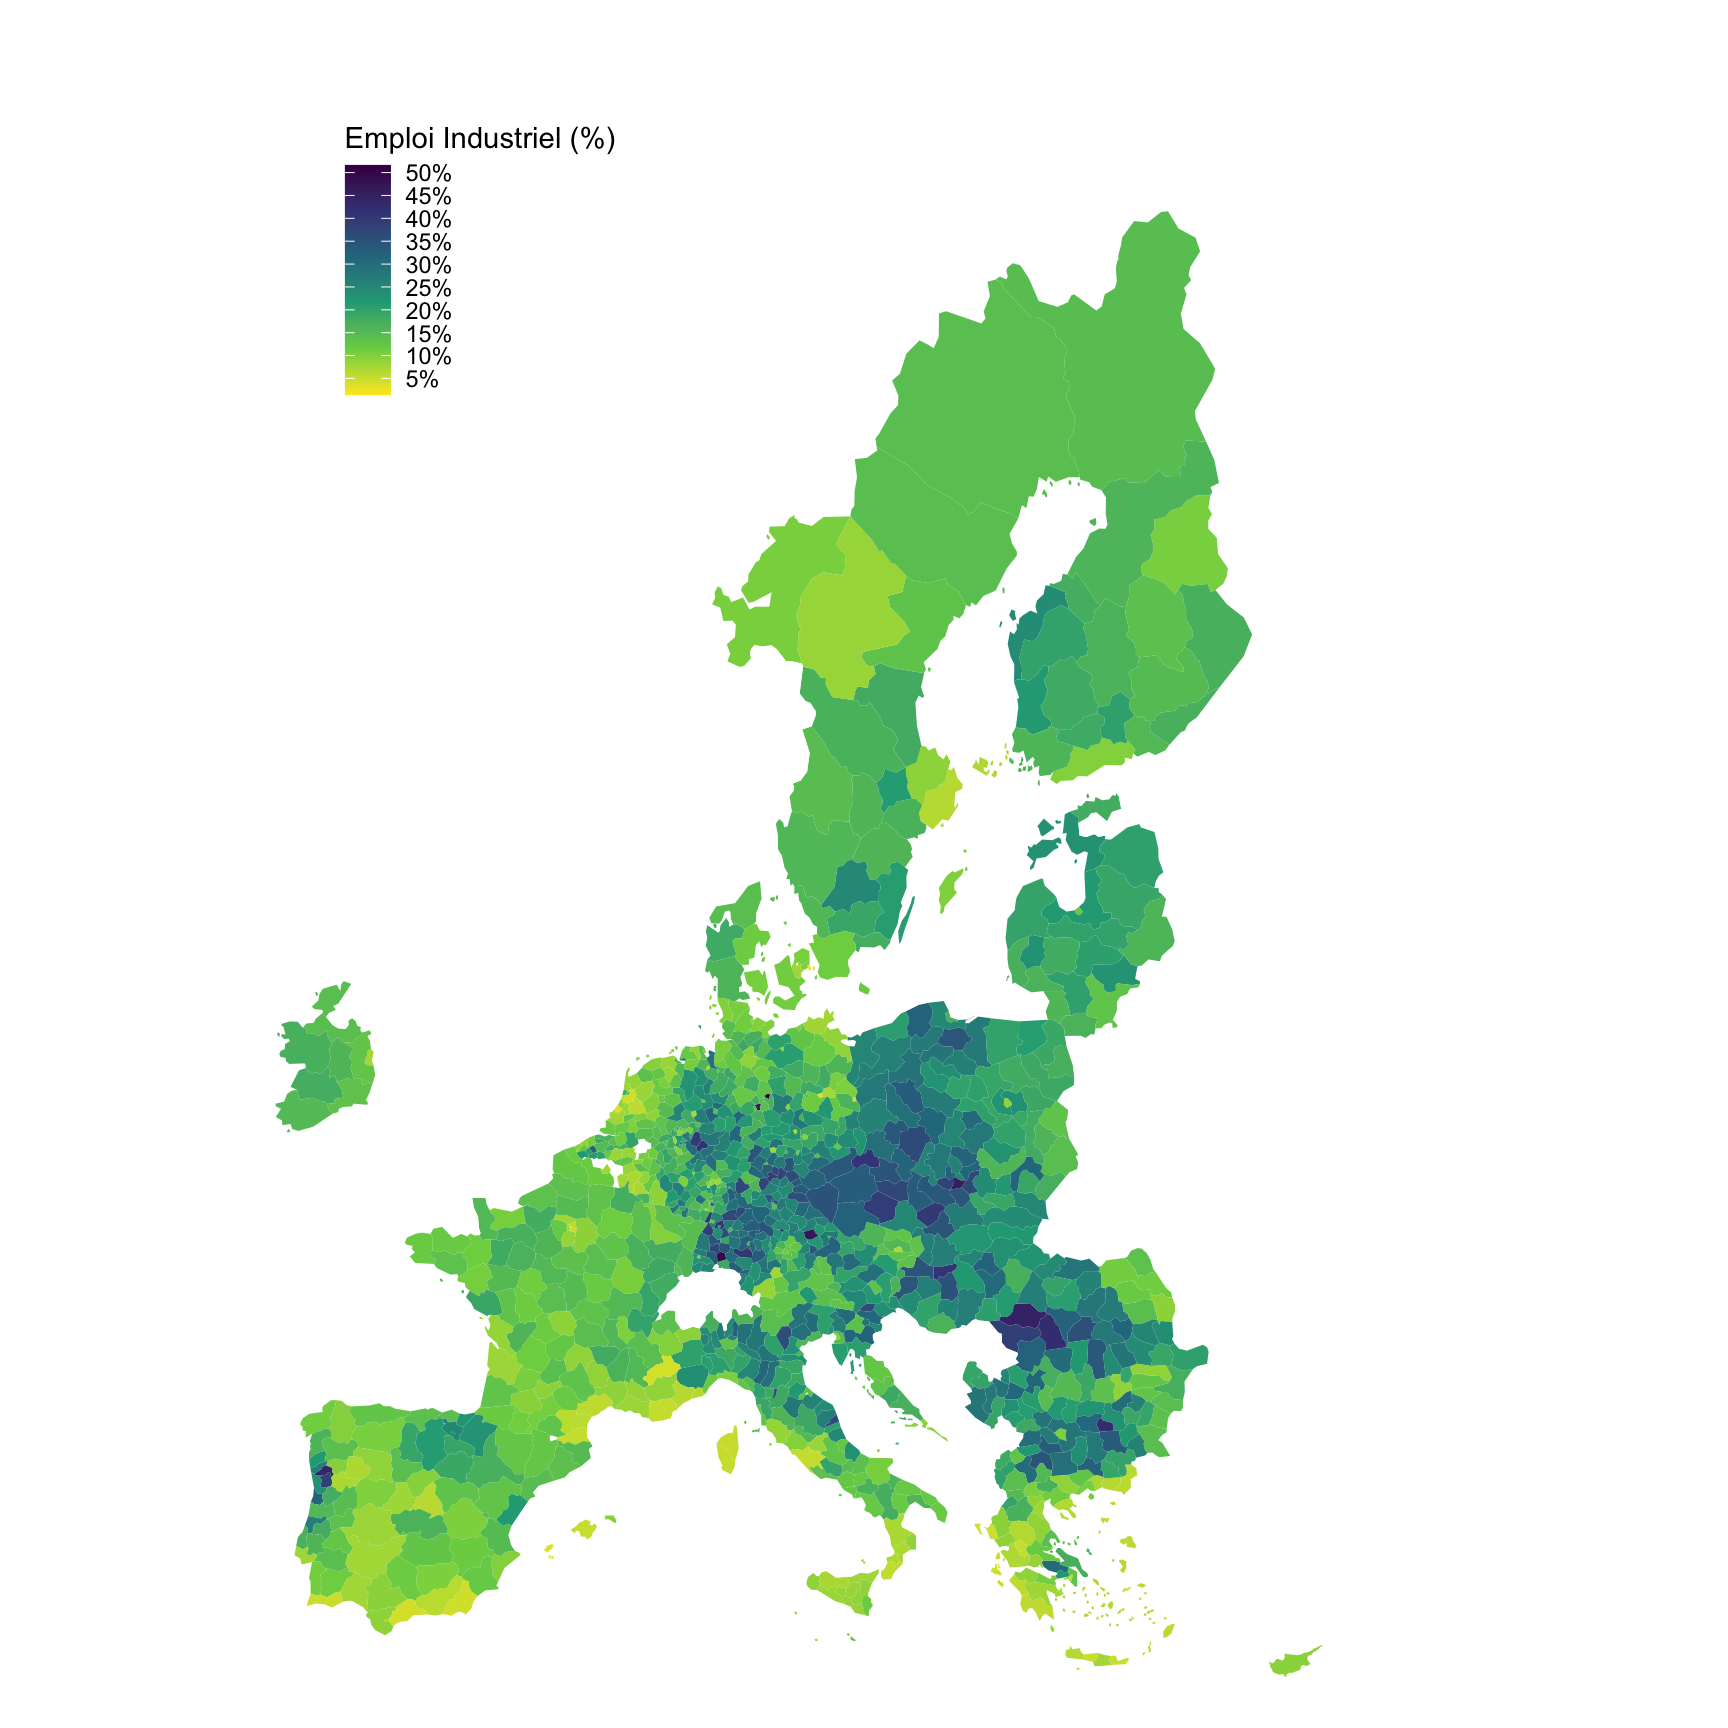
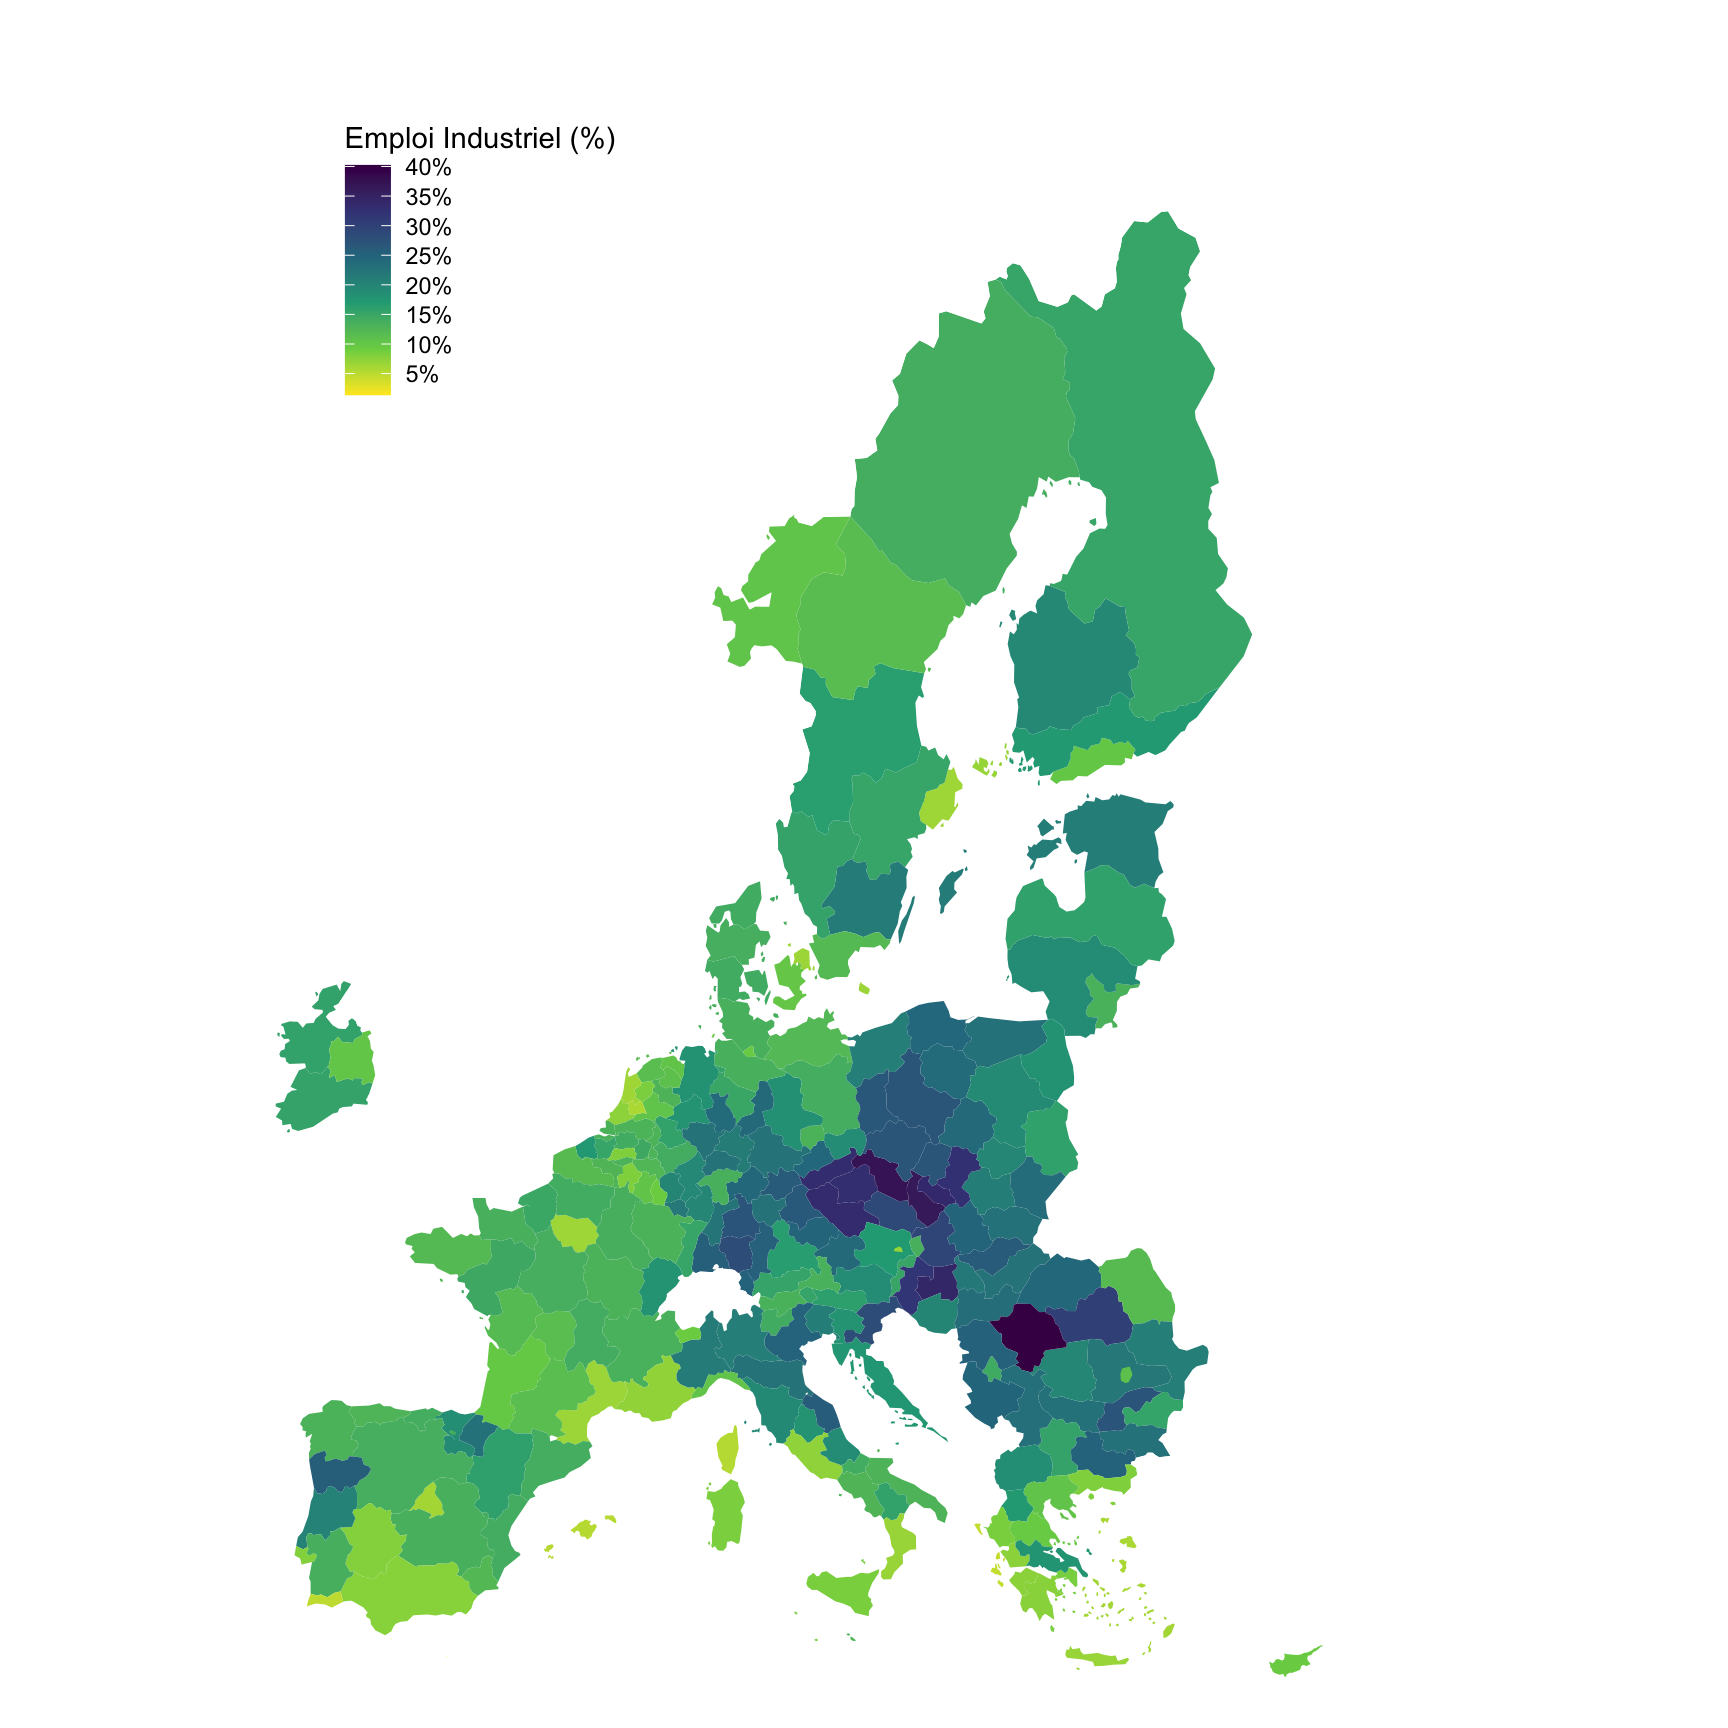
2015 Share of Employment (% Industry)

NUTS 2

Code
nama_10r_3empers %>%
  filter(time == "2015", 
         nchar(geo) == 4,
         wstatus == "EMP",
         nace_r2 %in% c("TOTAL", "B-E")) %>%
  left_join(geo, by = "geo") %>%
  spread(nace_r2, values) %>%
  mutate(`Share (%)` = round(100* `B-E` / TOTAL, 1)) %>%
  arrange(- `Share (%)`) %>%
  right_join(europe_NUTS2, by = "geo") %>%
  filter(long >= -15, lat >= 33) %>%
  ggplot(., aes(x = long, y = lat, group = group, fill = `Share (%)`/100)) +
  geom_polygon() + coord_map() +
  scale_fill_viridis_c(na.value = "white",
                       labels = scales::percent_format(accuracy = 1),
                       breaks = 0.01*seq(0, 50, 5),
                       direction = -1) +
  theme_void() + theme(legend.position = c(0.25, 0.85)) + 
  labs(fill = "Emploi Industriel (%)")

NUTS 3

Code
nama_10r_3empers %>%
  filter(time == "2015", 
         nchar(geo) == 5,
         wstatus == "EMP",
         nace_r2 %in% c("TOTAL", "B-E")) %>%
  left_join(geo, by = "geo") %>%
  spread(nace_r2, values) %>%
  mutate(`Share (%)` = round(100* `B-E` / TOTAL, 1)) %>%
  arrange(- `Share (%)`) %>%
  right_join(europe_NUTS3, by = "geo") %>%
  filter(long >= -15, lat >= 33) %>%
  ggplot(., aes(x = long, y = lat, group = group, fill = `Share (%)`/100)) +
  geom_polygon() + coord_map() +
  scale_fill_viridis_c(na.value = "white",
                       labels = scales::percent_format(accuracy = 1),
                       breaks = 0.01*seq(0, 50, 5),
                       direction = -1) +
  theme_void() + theme(legend.position = c(0.25, 0.85)) + 
  labs(fill = "Emploi Industriel (%)")

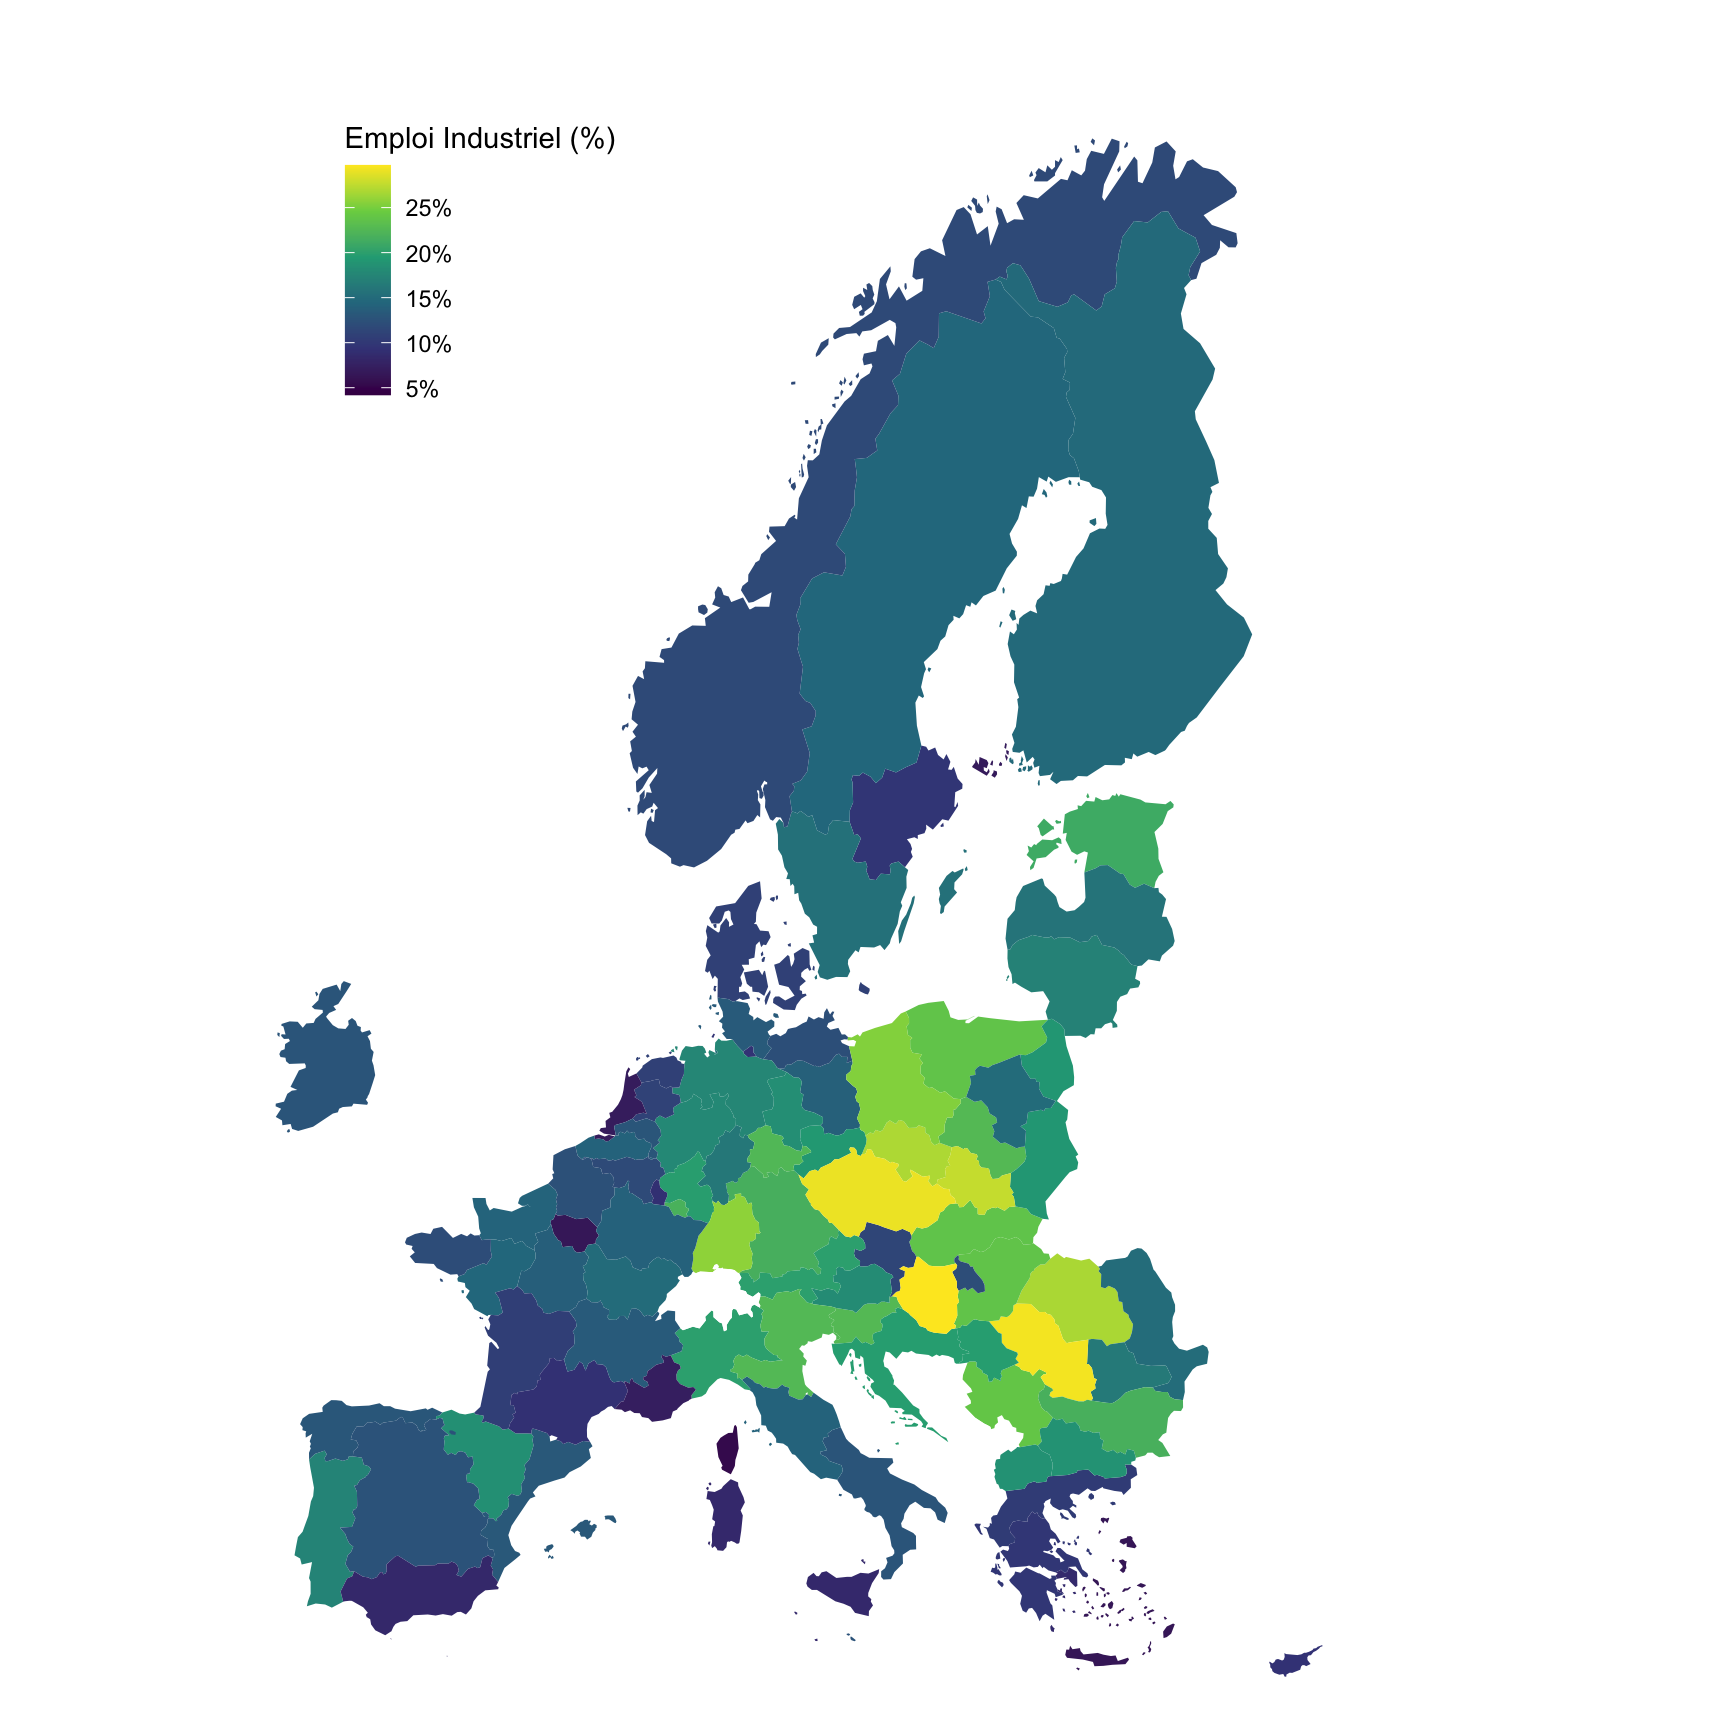
NUTS 1

Code
nama_10r_3empers %>%
  filter(time == "2015", 
         nchar(geo) == 3,
         wstatus == "EMP",
         nace_r2 %in% c("TOTAL", "B-E")) %>%
  left_join(geo, by = "geo") %>%
  spread(nace_r2, values) %>%
  mutate(`Share (%)` = round(100* `B-E` / TOTAL, 1)) %>%
  arrange(- `Share (%)`) %>%
  right_join(europe_NUTS1, by = "geo") %>%
  filter(long >= -15, lat >= 33) %>%
  ggplot(., aes(x = long, y = lat, group = group, fill = `Share (%)`/100)) +
  geom_polygon() + coord_map() +
  scale_fill_viridis_c(na.value = "white",
                       labels = scales::percent_format(accuracy = 1),
                       breaks = 0.01*seq(0, 50, 5)) +
  theme_void() + theme(legend.position = c(0.25, 0.85)) + 
  labs(fill = "Emploi Industriel (%)")

1995 Share of Employment (% Industry)

NUTS 2

Code
nama_10r_3empers %>%
  filter(time == "2007", 
         nchar(geo) == 4,
         wstatus == "EMP",
         nace_r2 %in% c("TOTAL", "B-E")) %>%
  left_join(geo, by = "geo") %>%
  spread(nace_r2, values) %>%
  mutate(`Share (%)` = round(100* `B-E` / TOTAL, 1)) %>%
  arrange(- `Share (%)`) %>%
  right_join(europe_NUTS2_2003, by = "geo") %>%
  filter(long >= -15, lat >= 33) %>%
  ggplot(., aes(x = long, y = lat, group = group, fill = `Share (%)`/100)) +
  geom_polygon() + coord_map() +
  scale_fill_viridis_c(na.value = "white",
                       labels = scales::percent_format(accuracy = 1),
                       breaks = 0.01*seq(0, 50, 5)) +
  theme_void() + theme(legend.position = c(0.25, 0.85)) + 
  labs(fill = "Emploi Industriel (%)")

NUTS 2 - Tables

Code
nama_10r_3empers %>%
  filter(time == "2005", 
         nchar(geo) == 4,
         wstatus == "EMP",
         nace_r2 %in% c("TOTAL", "B-E")) %>%
  left_join(geo, by = "geo") %>%
  spread(nace_r2, values) %>%
  mutate(`Share (%)` = round(100* `B-E` / TOTAL, 1)) %>%
  arrange(- `Share (%)`) %>%
  select(geo, Geo, `Share (%)`) %>%
  {if (is_html_output()) datatable(., filter = 'top', rownames = F) else .}

2015 Share of Employment (% Agriculture)

NUTS 2

Code
nama_10r_3empers %>%
  filter(time == "2015", 
         nchar(geo) == 4,
         wstatus == "EMP",
         nace_r2 %in% c("TOTAL", "A")) %>%
  left_join(geo, by = "geo") %>%
  spread(nace_r2, values) %>%
  mutate(`Share (%)` = round(100* `A` / TOTAL, 1)) %>%
  arrange(- `Share (%)`) %>%
  right_join(europe_NUTS2, by = "geo") %>%
  filter(long >= -15, lat >= 33) %>%
  ggplot(., aes(x = long, y = lat, group = group, fill = `Share (%)`/100)) +
  geom_polygon() + coord_map() +
  scale_fill_viridis_c(na.value = "white",
                       labels = scales::percent_format(accuracy = 1),
                       breaks = 0.01*seq(0, 50, 10),
                       values  = c(0, 0.1, 0.2,  1)) +
  theme_void() + theme(legend.position = c(0.25, 0.85)) + 
  labs(fill = "Agriculture (%)")

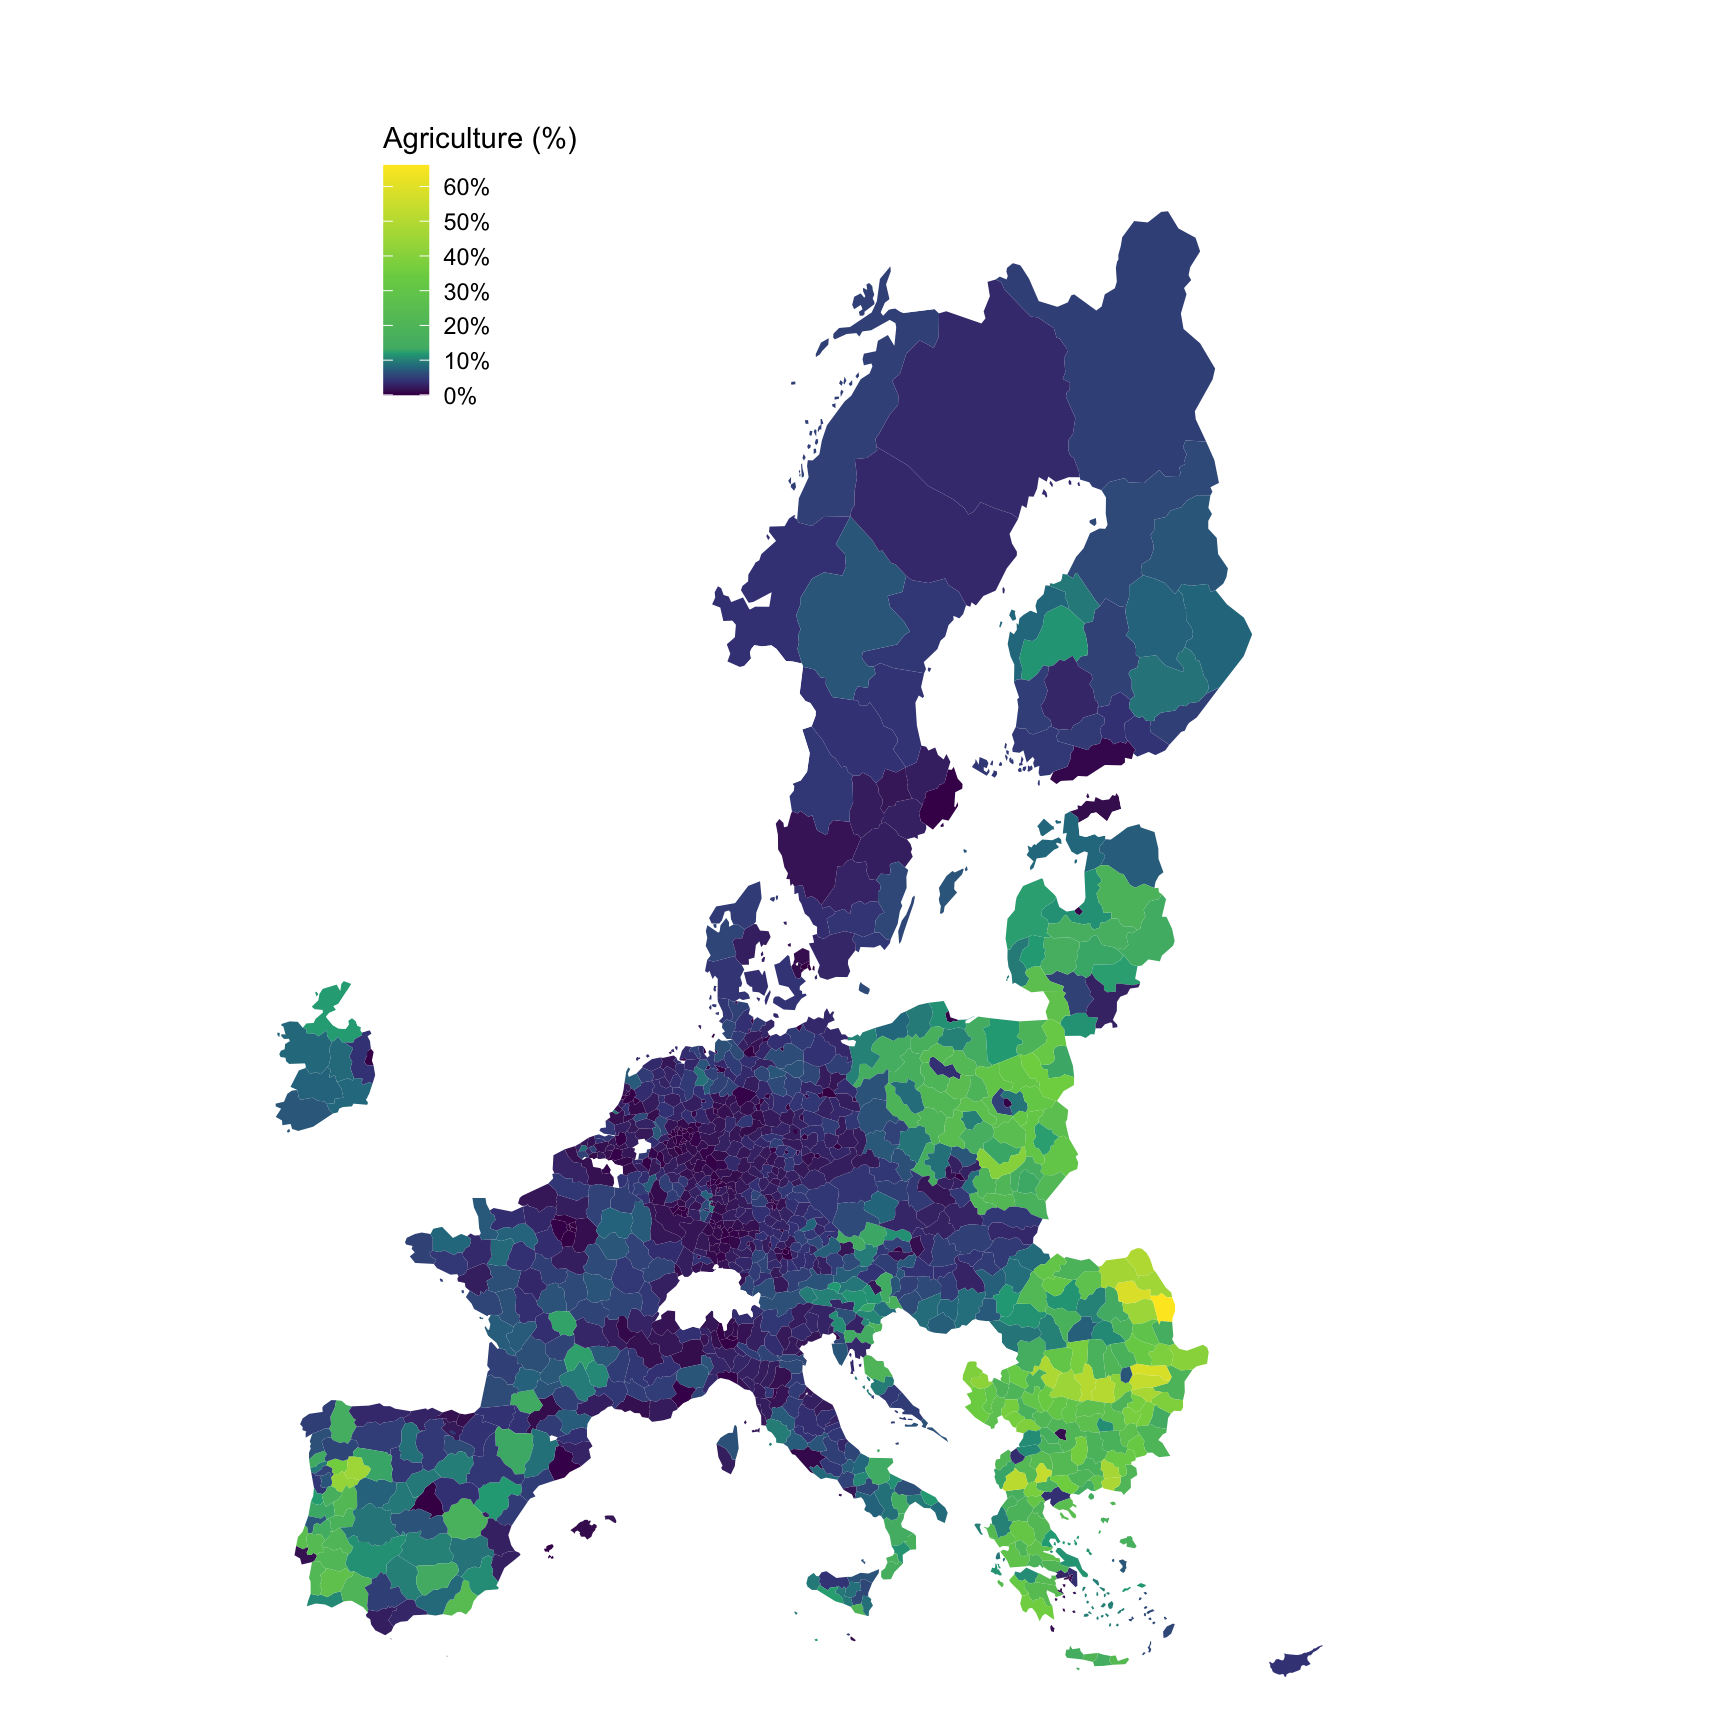
NUTS 3

Code
nama_10r_3empers %>%
  filter(time == "2015", 
         nchar(geo) == 5,
         wstatus == "EMP",
         nace_r2 %in% c("TOTAL", "A")) %>%
  left_join(geo, by = "geo") %>%
  spread(nace_r2, values) %>%
  mutate(`Share (%)` = round(100* `A` / TOTAL, 1)) %>%
  arrange(- `Share (%)`) %>%
  right_join(europe_NUTS3, by = "geo") %>%
  filter(long >= -15, lat >= 33) %>%
  ggplot(., aes(x = long, y = lat, group = group, fill = `Share (%)`/100)) +
  geom_polygon() + coord_map() +
  scale_fill_viridis_c(na.value = "white",
                       labels = scales::percent_format(accuracy = 1),
                       breaks = 0.01*seq(0, 70, 10),
                       values  = c(0, 0.1, 0.2,  1)) +
  theme_void() + theme(legend.position = c(0.25, 0.85)) + 
  labs(fill = "Agriculture (%)")

NUTS 1

Code
nama_10r_3empers %>%
  filter(time == "2015", 
         nchar(geo) == 3,
         wstatus == "EMP",
         nace_r2 %in% c("TOTAL", "A")) %>%
  left_join(geo, by = "geo") %>%
  spread(nace_r2, values) %>%
  mutate(`Share (%)` = round(100* `A` / TOTAL, 1)) %>%
  arrange(- `Share (%)`) %>%
  right_join(europe_NUTS1, by = "geo") %>%
  filter(long >= -15, lat >= 33) %>%
  ggplot(., aes(x = long, y = lat, group = group, fill = `Share (%)`/100)) +
  geom_polygon() + coord_map() +
  scale_fill_viridis_c(na.value = "white",
                       labels = scales::percent_format(accuracy = 1),
                       breaks = 0.01*seq(0, 50, 10),
                       values  = c(0, 0.1, 0.2,  1)) +
  theme_void() + theme(legend.position = c(0.25, 0.85)) + 
  labs(fill = "Agriculture (%)")

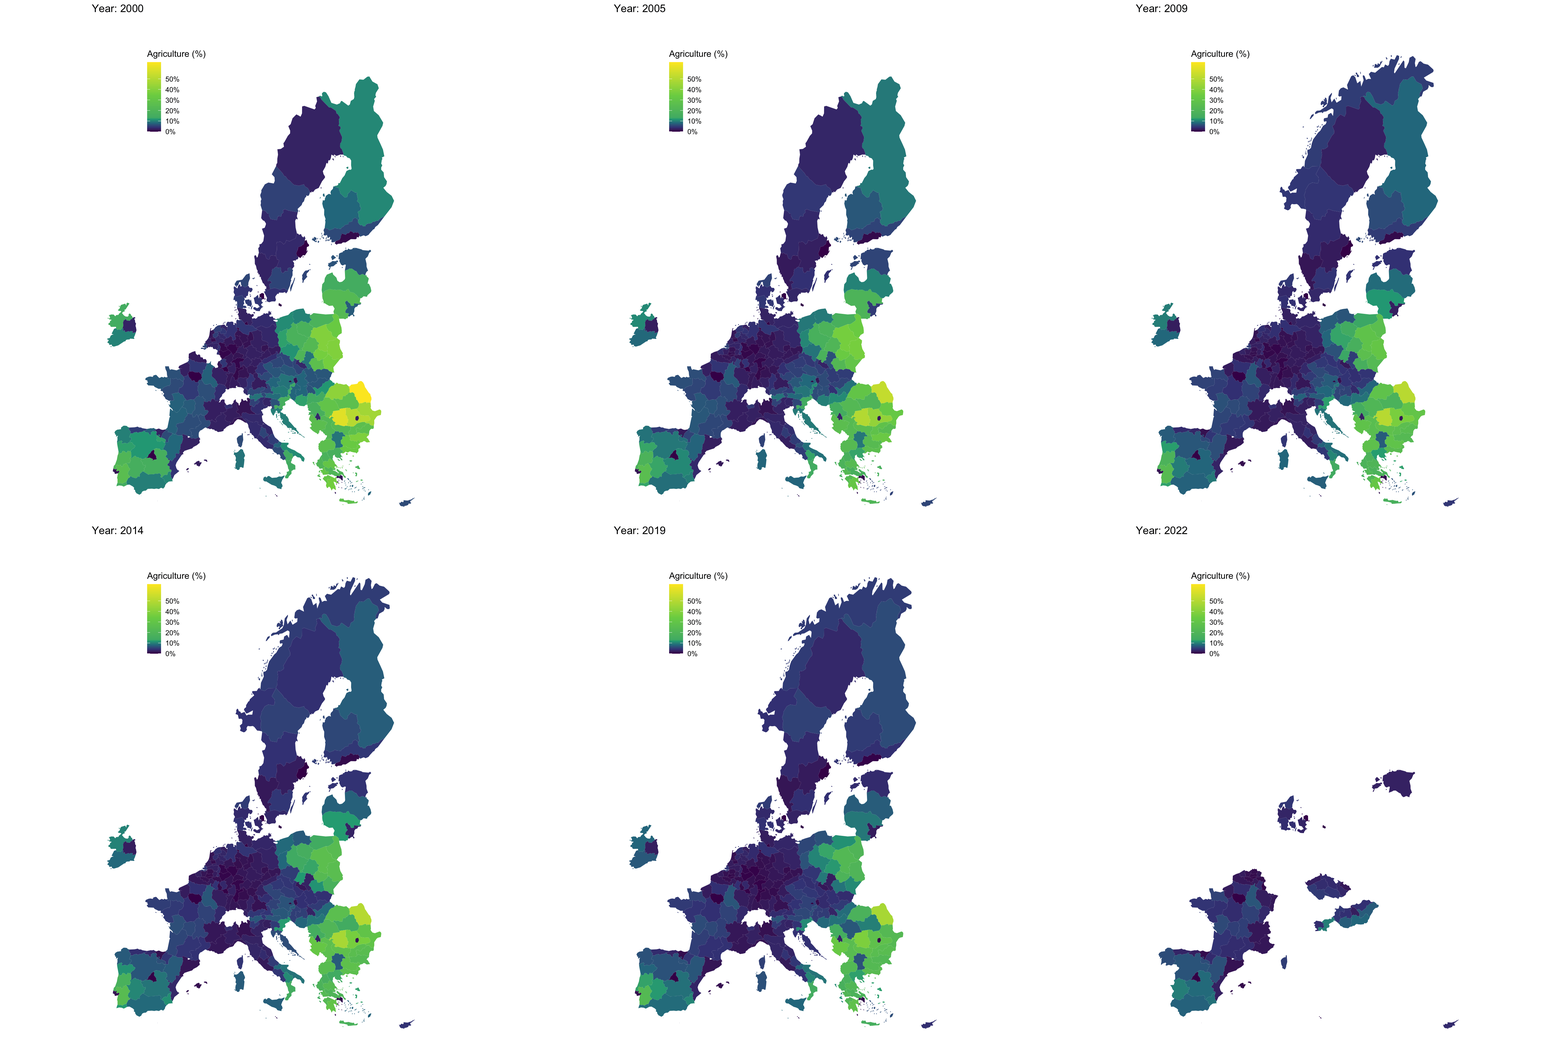
Animation

Agriculture

Code
options(gganimate.nframes = 50, gganimate.end_pause = 10)
nama_10r_3empers %>%
  filter(nchar(geo) == 4,
         wstatus == "EMP",
         nace_r2 %in% c("TOTAL", "A")) %>%
  left_join(geo, by = "geo") %>%
  spread(nace_r2, values) %>%
  mutate(`Share (%)` = round(100* `A` / TOTAL, 1),
         year = as.integer(time)) %>%
  filter(!is.na(year),
         year >= 2000) %>%
  select(year, geo, `Share (%)`) %>%
  right_join(europe_NUTS2, by = "geo") %>%
  filter(long >= -15, lat >= 33) %>%
  na.omit %>%
  ggplot(aes(x = long, y = lat, group = group)) +
  geom_polygon(aes(fill = `Share (%)`/100)) + coord_map() +
  scale_fill_viridis_c(na.value = "grey",
                       labels = scales::percent_format(accuracy = 1),
                       breaks = 0.01*seq(0, 50, 10),
                       values  = c(0, 0.1, 0.2,  1)) +
  theme_void() + theme(legend.position = c(0.25, 0.85)) + 
  labs(fill = "Agriculture (%)") + 
  transition_time(year) +
  labs(title = "Year: {frame_time}")
Industry

Code
options(gganimate.nframes = 50, gganimate.end_pause = 10)
nama_10r_3empers %>%
  filter(nchar(geo) == 4,
         wstatus == "EMP",
         nace_r2 %in% c("TOTAL", "B-E")) %>%
  left_join(geo, by = "geo") %>%
  spread(nace_r2, values) %>%
  mutate(`Share (%)` = round(100* `B-E` / TOTAL, 1),
         year = as.integer(time)) %>%
  filter(!is.na(year),
         year >= 2000) %>%
  select(year, geo, `Share (%)`) %>%
  right_join(europe_NUTS2, by = "geo") %>%
  filter(long >= -15, lat >= 33) %>%
  na.omit %>%
  ggplot(aes(x = long, y = lat, group = group)) +
  geom_polygon(aes(fill = `Share (%)`/100)) + coord_map() +
  scale_fill_viridis_c(na.value = "grey",
                       labels = scales::percent_format(accuracy = 1),
                       breaks = 0.01*seq(0, 50, 10),
                       values  = c(0, 0.1, 0.2,  1)) +
  theme_void() + theme(legend.position = c(0.25, 0.85)) + 
  labs(fill = "Industry (%)") + 
  transition_time(year) +
  labs(title = "Year: {frame_time}")