Top 5 ports for volume of containers - volume (in TEUs) of containers handled in each port - mar_qg_qm_pvh
Data - Eurostat
Info
Last observation: Quarterly: 2025Q3 (N = 40)
First observation: Quarterly: 2005Q1 (N = 8)
Last data update: 23 jul 2026, 22:14. Last compile: 24 jul 2026, 02:34
Structure
Container Volumes
Rotterdam, Hamburg, Algeciras, Valencia
Code
mar_qg_qm_pvh %>%
  filter(unit == "THS_TEU",
         rep_mar %in% c("NL_0NLRTM", "DE_1DEHAM", "ES_2ESALG", "ES_2ESVLC")) %>%
  quarter_to_date %>%
  ggplot + geom_line(aes(x = date, y = values, color = Rep_mar)) +
  theme_minimal() +
  scale_x_date(breaks = as.Date(paste0(seq(2005, 2100, 2), "-01-01")),
               labels = date_format("%Y")) +
  theme(legend.position = "right") +
  xlab("") + ylab("Container volume (thousand TEU)") +
  scale_y_continuous(labels = scales::comma_format())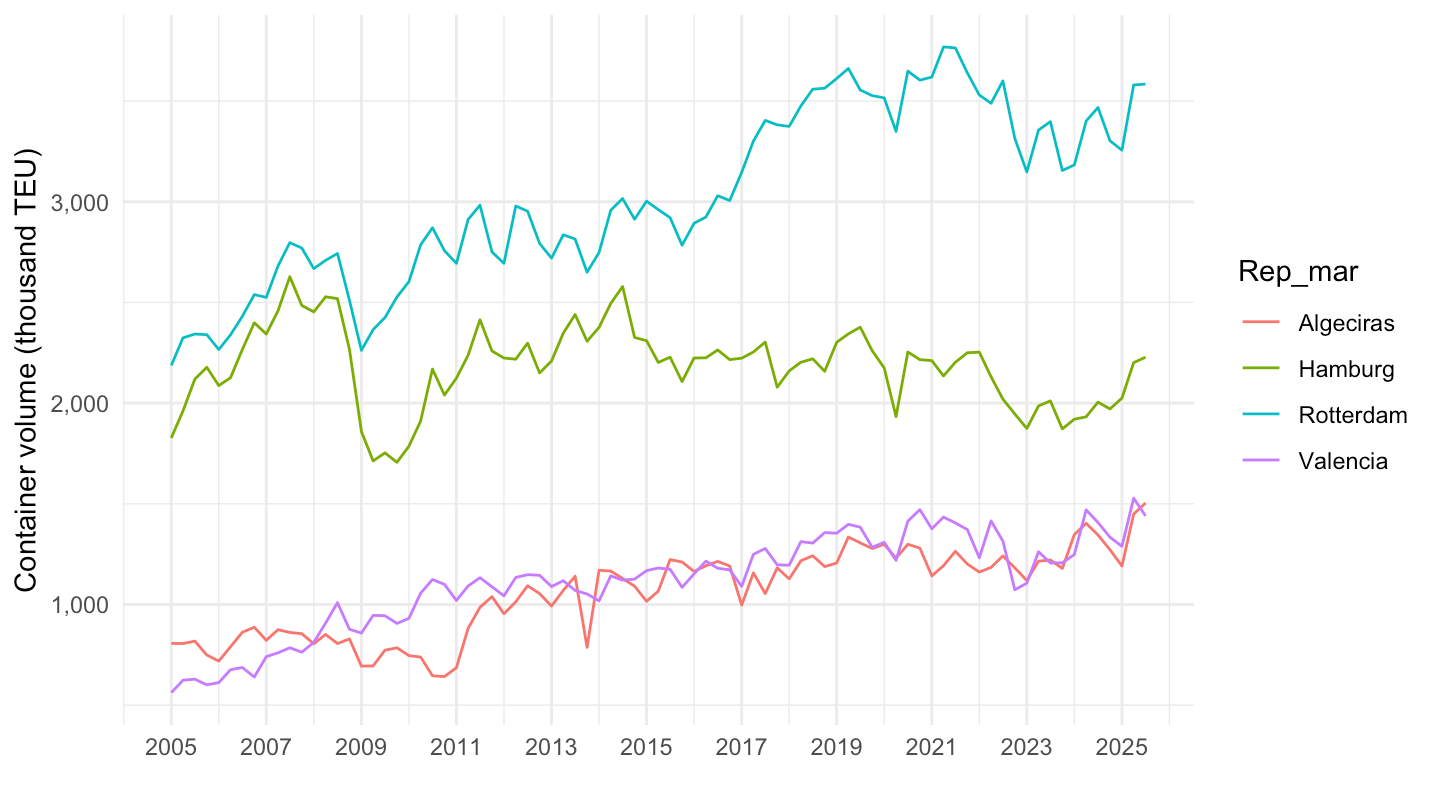
Year-on-Year Growth Rate
Code
mar_qg_qm_pvh %>%
  filter(unit == "RT4",
         rep_mar %in% c("NL_0NLRTM", "DE_1DEHAM", "ES_2ESALG", "ES_2ESVLC")) %>%
  quarter_to_date %>%
  mutate(values = values/100) %>%
  ggplot + geom_line(aes(x = date, y = values, color = Rep_mar)) +
  theme_minimal() +
  scale_x_date(breaks = as.Date(paste0(seq(2005, 2100, 2), "-01-01")),
               labels = date_format("%Y")) +
  theme(legend.position = "right") +
  xlab("") + ylab("Container volume, growth rate y/y") +
  scale_y_continuous(labels = scales::percent_format(accuracy = 1)) +
  geom_hline(yintercept = 0, linetype = "dashed", color = "black")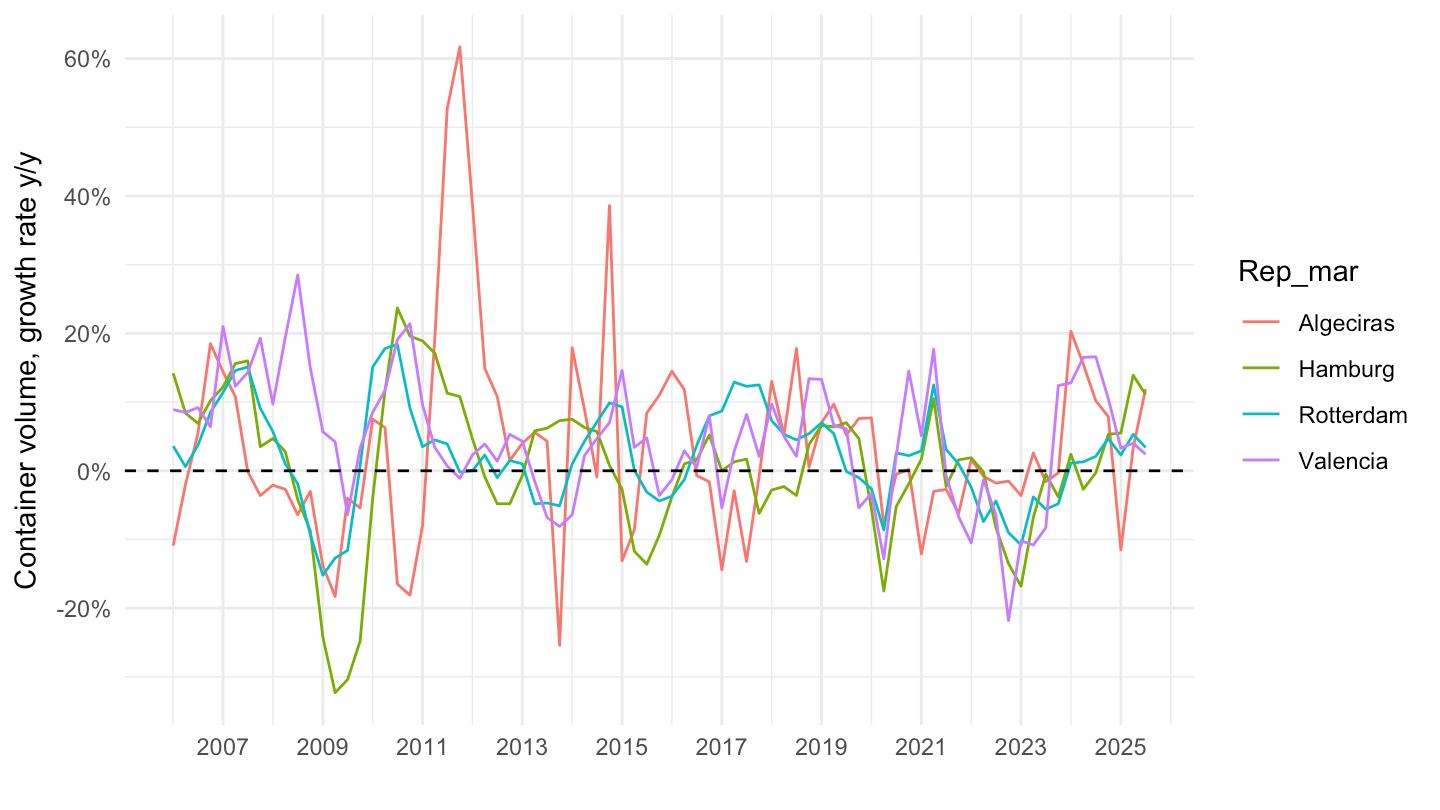
Latest Quarter by Port
Code
latest_q <- mar_qg_qm_pvh %>%
  filter(unit == "THS_TEU", !is.na(values)) %>%
  summarise(m = max(time)) %>%
  pull(m)

mar_qg_qm_pvh %>%
  filter(unit == "THS_TEU",
         time == latest_q) %>%
  select(Rep_mar, values) %>%
  arrange(-values) %>%
print_table_conditional()| Rep_mar | values |
|---|---|
| Rotterdam | 3584 |
| Antwerp-Bruges | 3080 |
| Hamburg | 2228 |
| Algeciras | 1504 |
| Valencia | 1440 |
| Bremerhaven | 1265 |
| Peiraias | 1105 |
| Gioia Tauro | 1038 |