
Last observation: 2024 (N = 180)
First observation: 2005 (N = 90)
Last data update: 14 sept. 2026, 21:54
Last compile: 04 oct. 2026, 23:26
mar_mg_aa_pwhd |>
  filter(rep_mar %in% c("NL_0NLRTM", "BE_0BEANR", "DE_1DEHAM", "NL_0NLAMS", "FR_2FRMRS"),
         unit == "THS_T",
         direct == "TOTAL") |>
  year_to_date() |>
  mutate(values = values/1000) |>
  ggplot() + geom_line(aes(x = date, y = values, color = Rep_mar)) +
  theme_minimal() +
  theme(legend.position = c(0.2, 0.75),
        legend.title = element_blank()) +
  scale_x_date(breaks = as.Date(paste0(seq(2005, 2100, 2), "-01-01")),
               labels = date_format("%Y")) +
  xlab("") + ylab("Gross weight of goods handled (million tonnes)")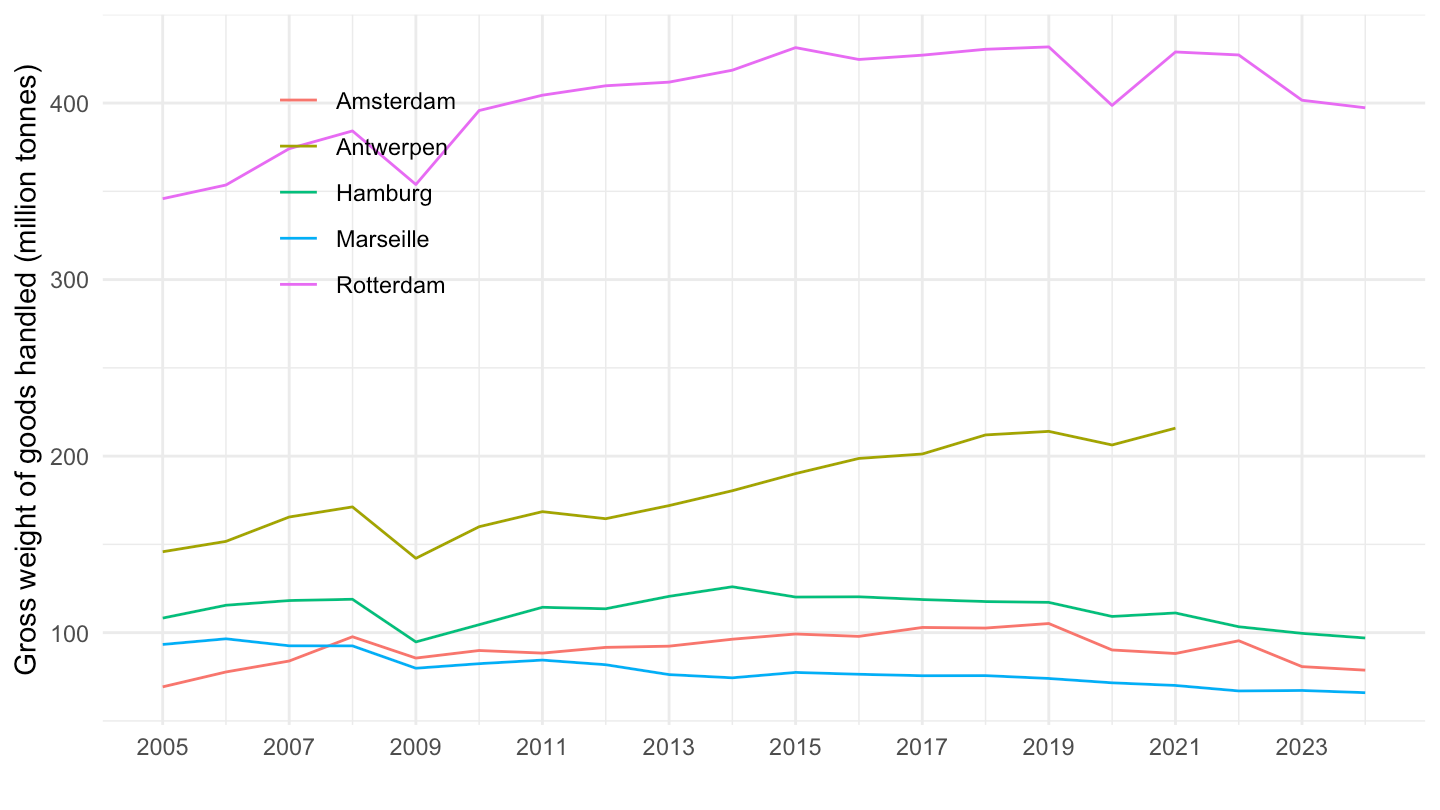
mar_mg_aa_pwhd |>
  filter(rep_mar == "NL_0NLRTM",
         unit == "THS_T",
         direct %in% c("IN", "OUT")) |>
  year_to_date() |>
  mutate(values = values/1000) |>
  ggplot() + geom_line(aes(x = date, y = values, color = Direct)) +
  theme_minimal() +
  theme(legend.position = c(0.75, 0.85),
        legend.title = element_blank()) +
  scale_x_date(breaks = as.Date(paste0(seq(2005, 2100, 2), "-01-01")),
               labels = date_format("%Y")) +
  xlab("") + ylab("Gross weight of goods handled (million tonnes)")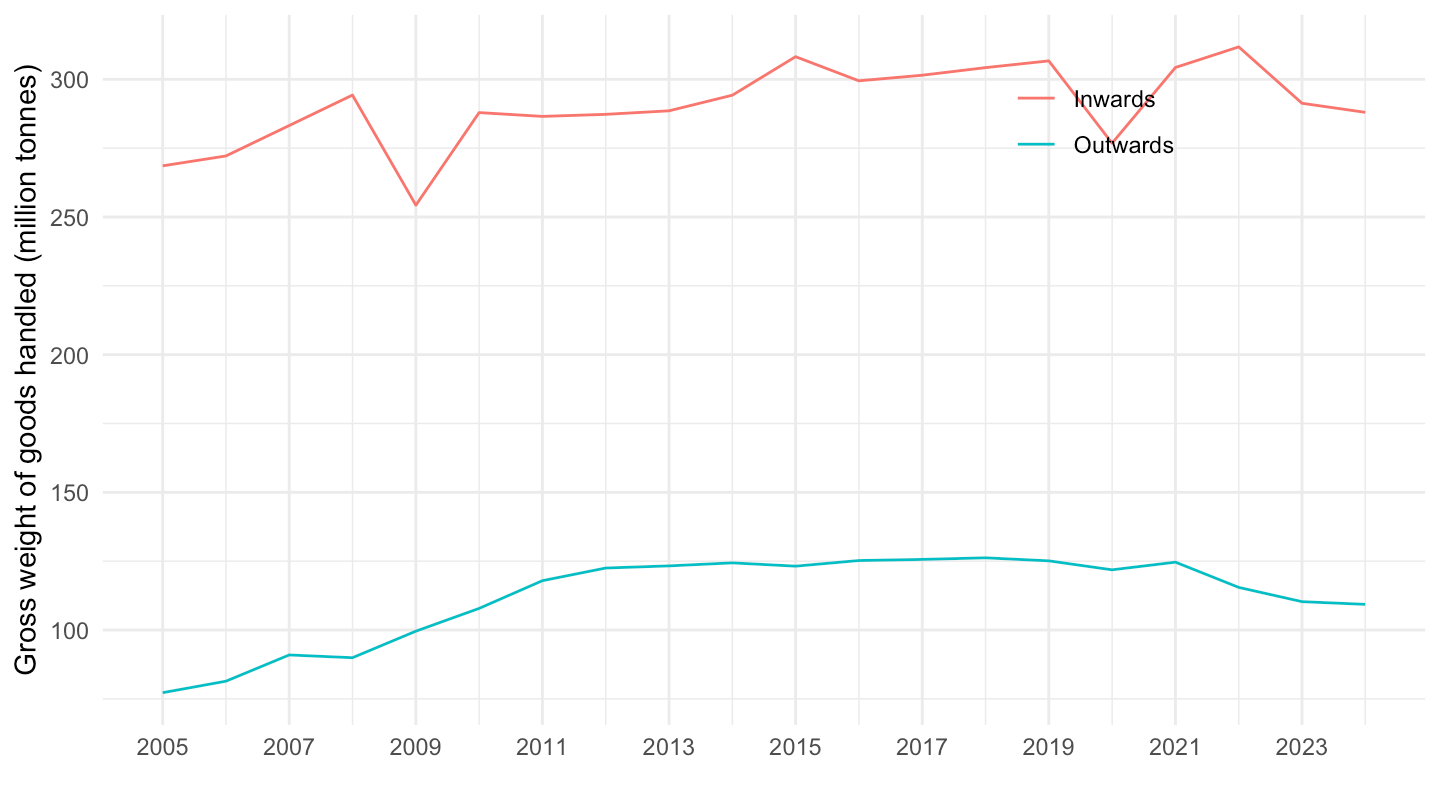
mar_mg_aa_pwhd |>
  filter(unit == "THS_T",
         time == "2019") |>


  select(rep_mar, Rep_mar, Direct, values) |>
  spread(Direct, values) %>%
  {if (is_html_output()) datatable(., filter = 'top', rownames = F, escape = F) else .}