citizen
Code
lfst_r_lfe2emprtn %>%
  left_join(citizen, by = "citizen") %>%
  group_by(citizen, Citizen) %>%
  summarise(Nobs = n()) %>%
  arrange(-Nobs) %>%
  print_table_conditional()
| TOTAL |
Total |
615962 |
| NAT |
Reporting country |
554290 |
| FOR |
Foreign country |
510966 |
| NEU27_2020_FOR |
Non-EU27 countries (from 2020) nor reporting country |
489210 |
| EU27_2020_FOR |
EU27 countries (from 2020) except reporting country |
465358 |
| NRP |
No response |
147521 |
| STLS |
Stateless |
95887 |
isced11
Code
lfst_r_lfe2emprtn %>%
  left_join(isced11, by = "isced11") %>%
  group_by(isced11, Isced11) %>%
  summarise(Nobs = n()) %>%
  arrange(-Nobs) %>%
  print_table_conditional()
| TOTAL |
All ISCED 2011 levels |
702267 |
| ED3_4 |
Upper secondary and post-secondary non-tertiary education (levels 3 and 4) |
661462 |
| ED0-2 |
Less than primary, primary and lower secondary education (levels 0-2) |
644251 |
| ED5-8 |
Tertiary education (levels 5-8) |
642485 |
| NRP |
No response |
228669 |
| UNK |
Unknown |
60 |
unit
Code
lfst_r_lfe2emprtn %>%
  left_join(unit, by = "unit") %>%
  group_by(unit, Unit) %>%
  summarise(Nobs = n()) %>%
  arrange(-Nobs) %>%
  print_table_conditional()
sex
Code
lfst_r_lfe2emprtn %>%
  left_join(sex, by = "sex") %>%
  group_by(sex, Sex) %>%
  summarise(Nobs = n()) %>%
  arrange(-Nobs) %>%
  {if (is_html_output()) print_table(.) else .}
| T |
Total |
988283 |
| F |
Females |
945563 |
| M |
Males |
945348 |
age
Code
lfst_r_lfe2emprtn %>%
  left_join(age, by = "age") %>%
  group_by(age, Age) %>%
  summarise(Nobs = n()) %>%
  arrange(-Nobs) %>%
  {if (is_html_output()) print_table(.) else .}
| Y15-64 |
From 15 to 64 years |
762783 |
| Y20-64 |
From 20 to 64 years |
746973 |
| Y25-54 |
From 25 to 54 years |
732430 |
| Y55-64 |
From 55 to 64 years |
637008 |
geo
Code
lfst_r_lfe2emprtn %>%
  left_join(geo, by = "geo") %>%
  group_by(geo, Geo) %>%
  summarise(Nobs = n()) %>%
  arrange(-Nobs) %>%
  mutate(Geo = ifelse(geo == "DE", "Germany", Geo)) %>%
  mutate(Flag = gsub(" ", "-", str_to_lower(Geo)),
         Flag = paste0('<img src="../../icon/flag/vsmall/', Flag, '.png" alt="Flag">')) %>%
  select(Flag, everything()) %>%
  {if (is_html_output()) datatable(., filter = 'top', rownames = F, escape = F) else .}
time
Code
lfst_r_lfe2emprtn %>%
  group_by(time) %>%
  summarise(Nobs = n()) %>%
  arrange(desc(time)) %>%
  print_table_conditional()
| 2024 |
103810 |
| 2023 |
103602 |
| 2022 |
102420 |
| 2021 |
103025 |
| 2020 |
107237 |
| 2019 |
123864 |
| 2018 |
123983 |
| 2017 |
124314 |
| 2016 |
123897 |
| 2015 |
124051 |
| 2014 |
124070 |
| 2013 |
123188 |
| 2012 |
119882 |
| 2011 |
119646 |
| 2010 |
120590 |
| 2009 |
117464 |
| 2008 |
118201 |
| 2007 |
117346 |
| 2006 |
113871 |
| 2005 |
106285 |
| 2004 |
99191 |
| 2003 |
96159 |
| 2002 |
95288 |
| 2001 |
92733 |
| 2000 |
87583 |
| 1999 |
87494 |
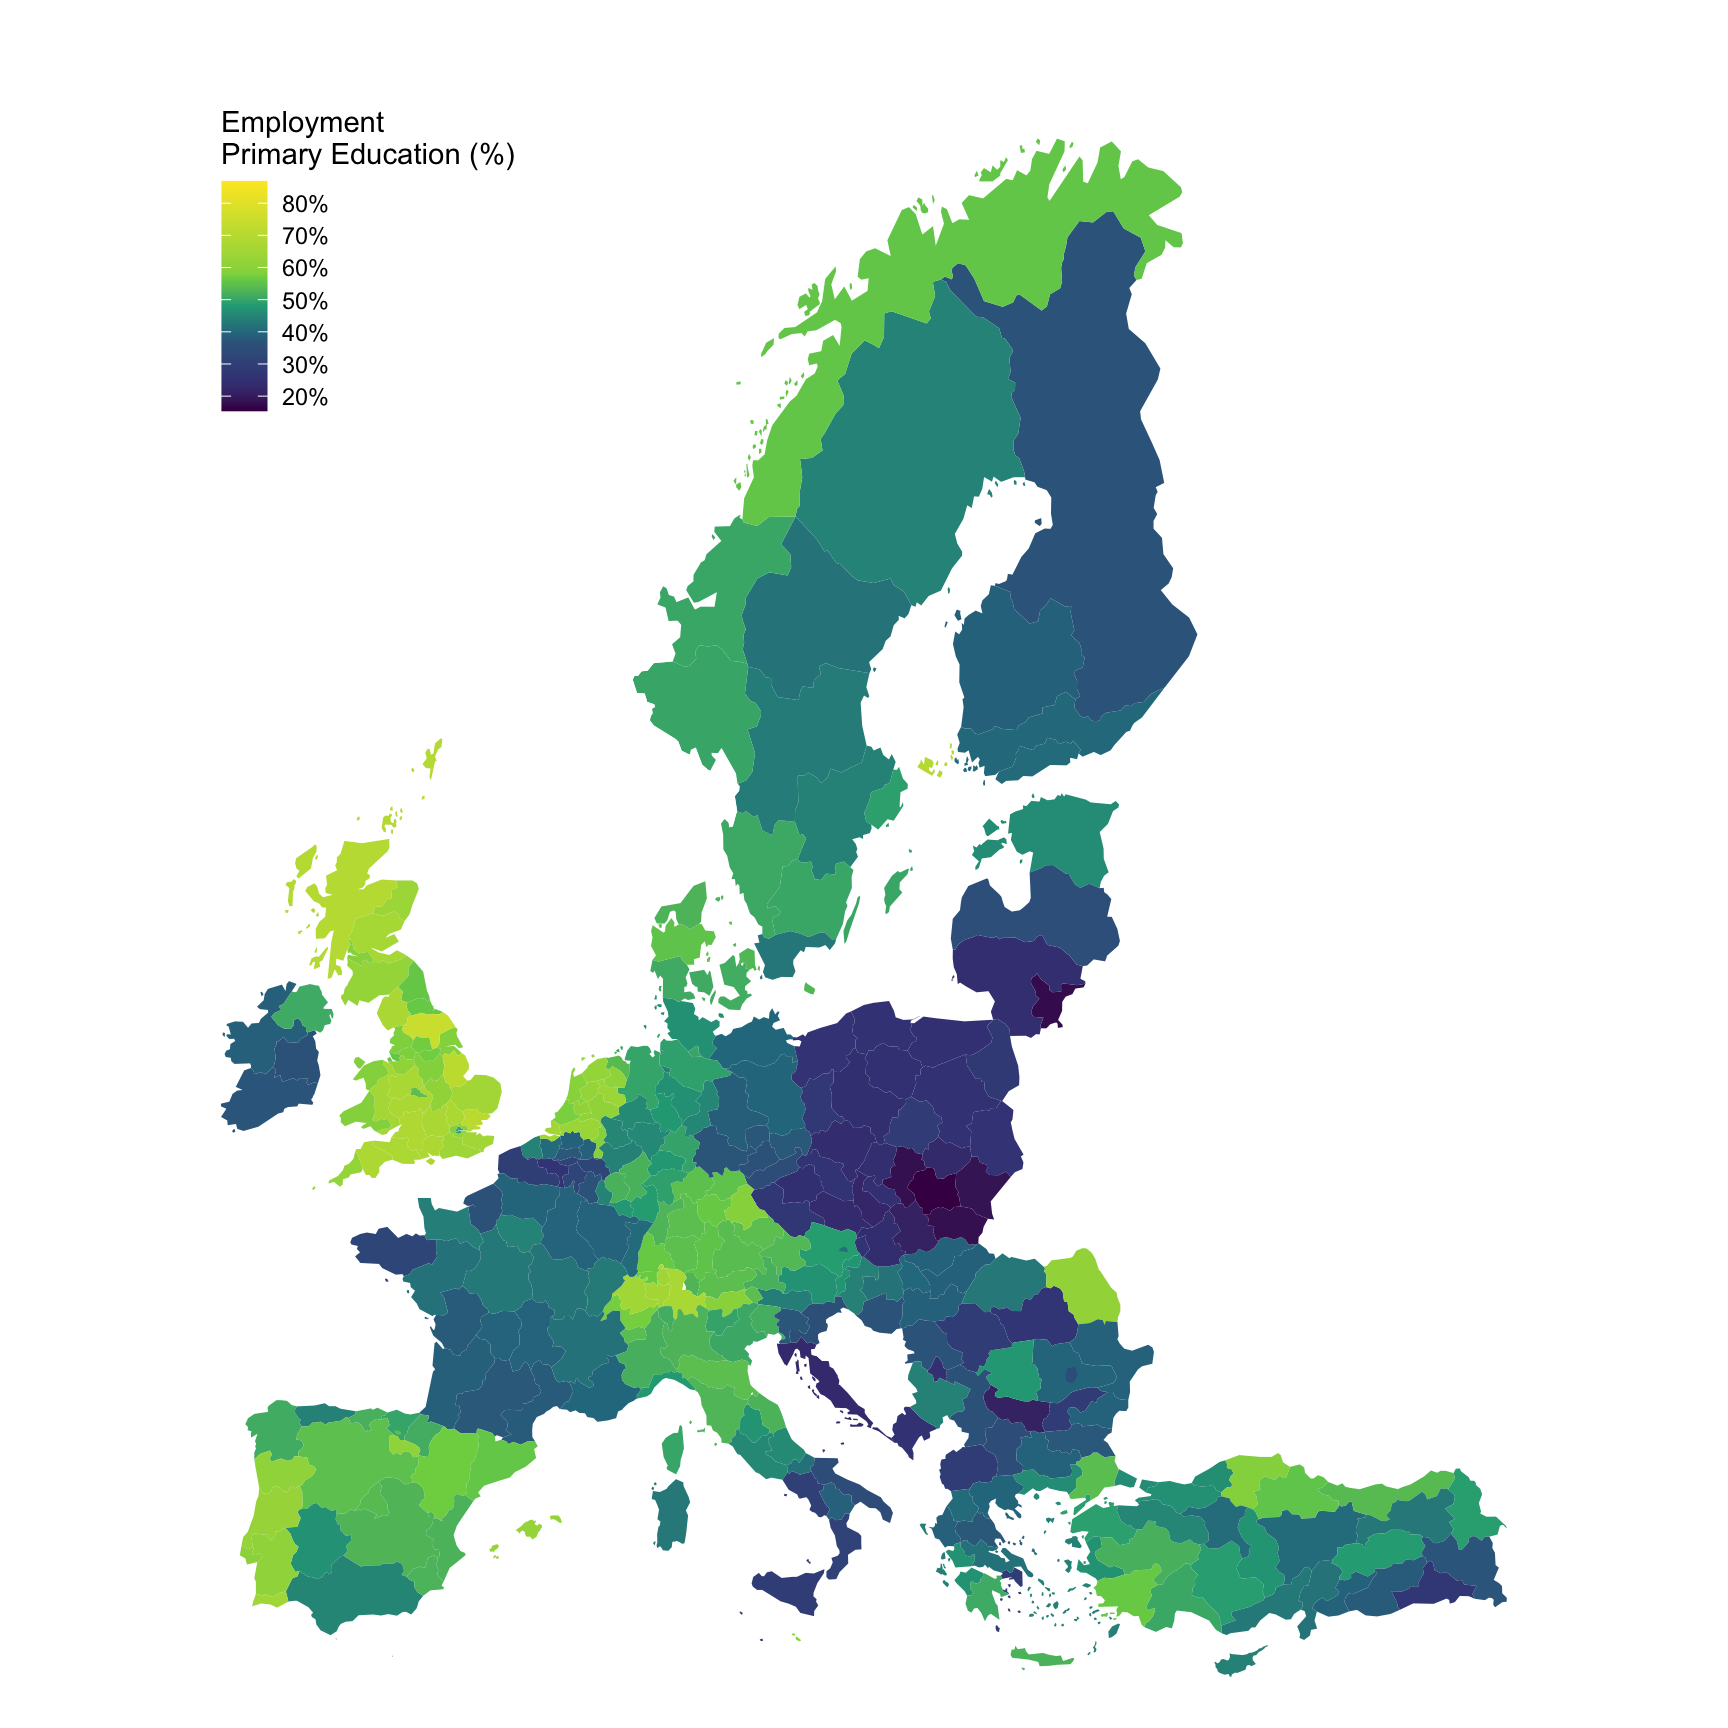
Education: levels 0-2
Code
lfst_r_lfe2emprtn %>%
  filter(unit == "PC",
         sex == "T",
         isced11 == "ED0-2",
         citizen == "TOTAL",
         nchar(geo) == 4,
         time == "2018") %>%
  right_join(europe_NUTS2, by = "geo") %>%
  filter(long >= -13.5, lat >= 33) %>%
  ggplot(., aes(x = long, y = lat, group = group, fill = values/100)) +
  geom_polygon() + coord_map() +
  scale_fill_viridis_c(na.value = "white",
                       labels = scales::percent_format(accuracy = 1),
                       breaks = 0.01*seq(20, 100, 10),
                       values = c(0, 0.1, 0.3, 0.4, 0.5, 0.6, 1)) +
  theme_void() + theme(legend.position = c(0.15, 0.85)) +
  labs(fill = "Employment \nPrimary Education (%)")
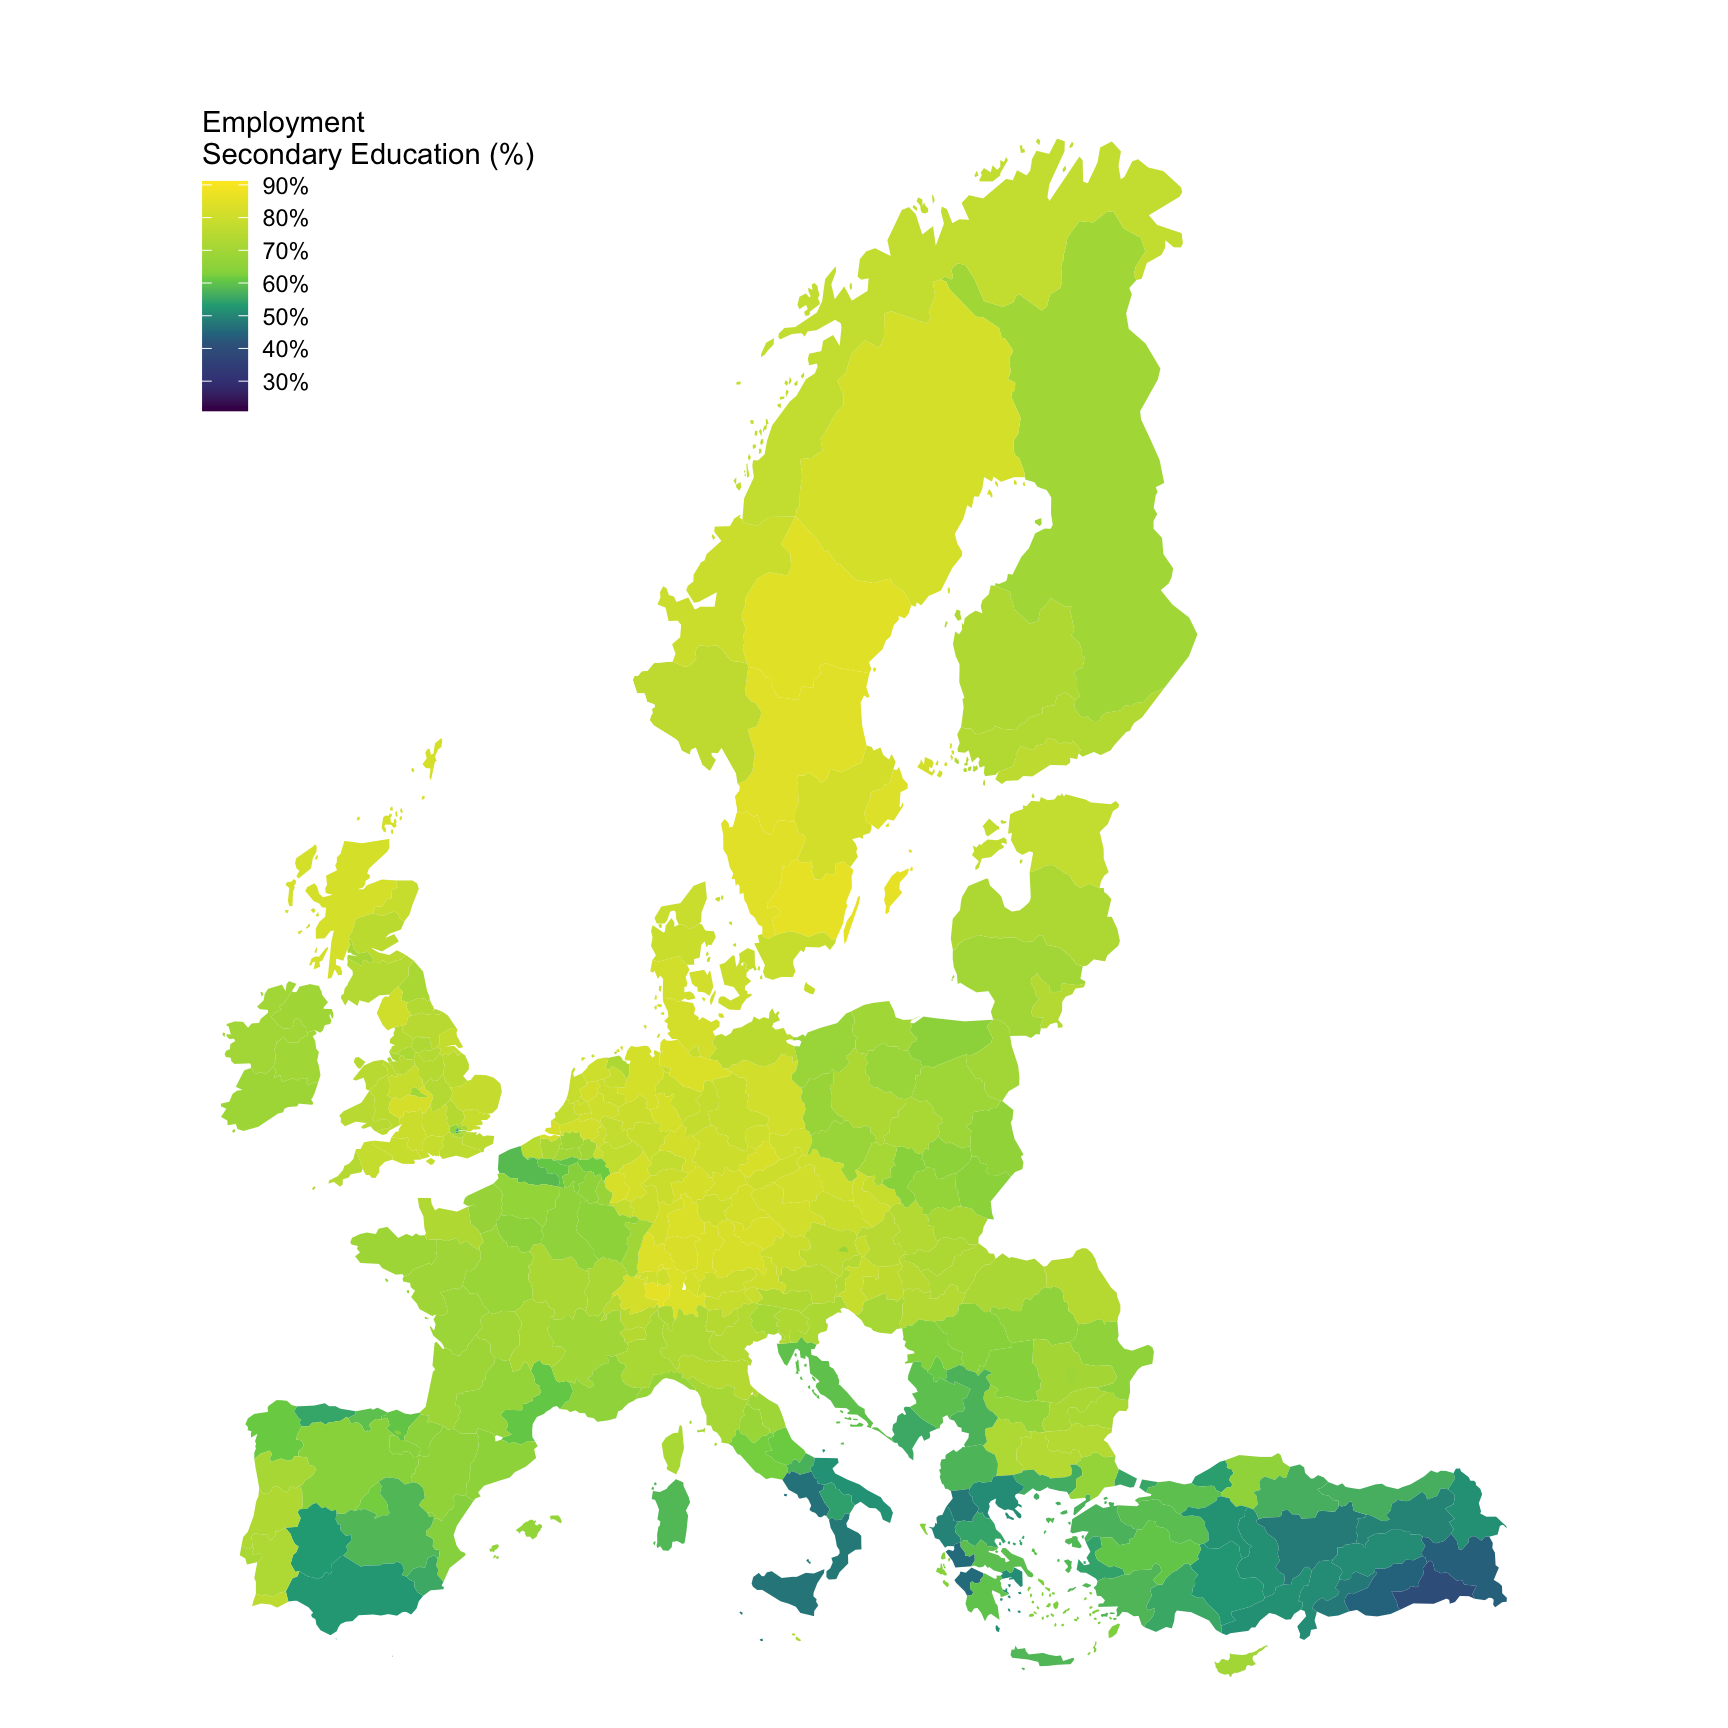
Upper secondary and post-secondary non-tertiary education (levels 3 and 4)
Education: levels 3-4
Code
lfst_r_lfe2emprtn %>%
  filter(unit == "PC",
         sex == "T",
         isced11 == "ED3_4",
         citizen == "TOTAL",
         nchar(geo) == 4,
         time == "2018") %>%
  right_join(europe_NUTS2, by = "geo") %>%
  filter(long >= -13.5, lat >= 33) %>%
  ggplot(., aes(x = long, y = lat, group = group, fill = values/100)) +
  geom_polygon() + coord_map() +
  scale_fill_viridis_c(na.value = "white",
                       labels = scales::percent_format(accuracy = 1),
                       breaks = 0.01*seq(20, 100, 10),
                       values = c(0, 0.1, 0.3, 0.4, 0.5, 0.6, 1)) +
  theme_void() + theme(legend.position = c(0.15, 0.85)) +
  labs(fill = "Employment \nSecondary Education (%)")
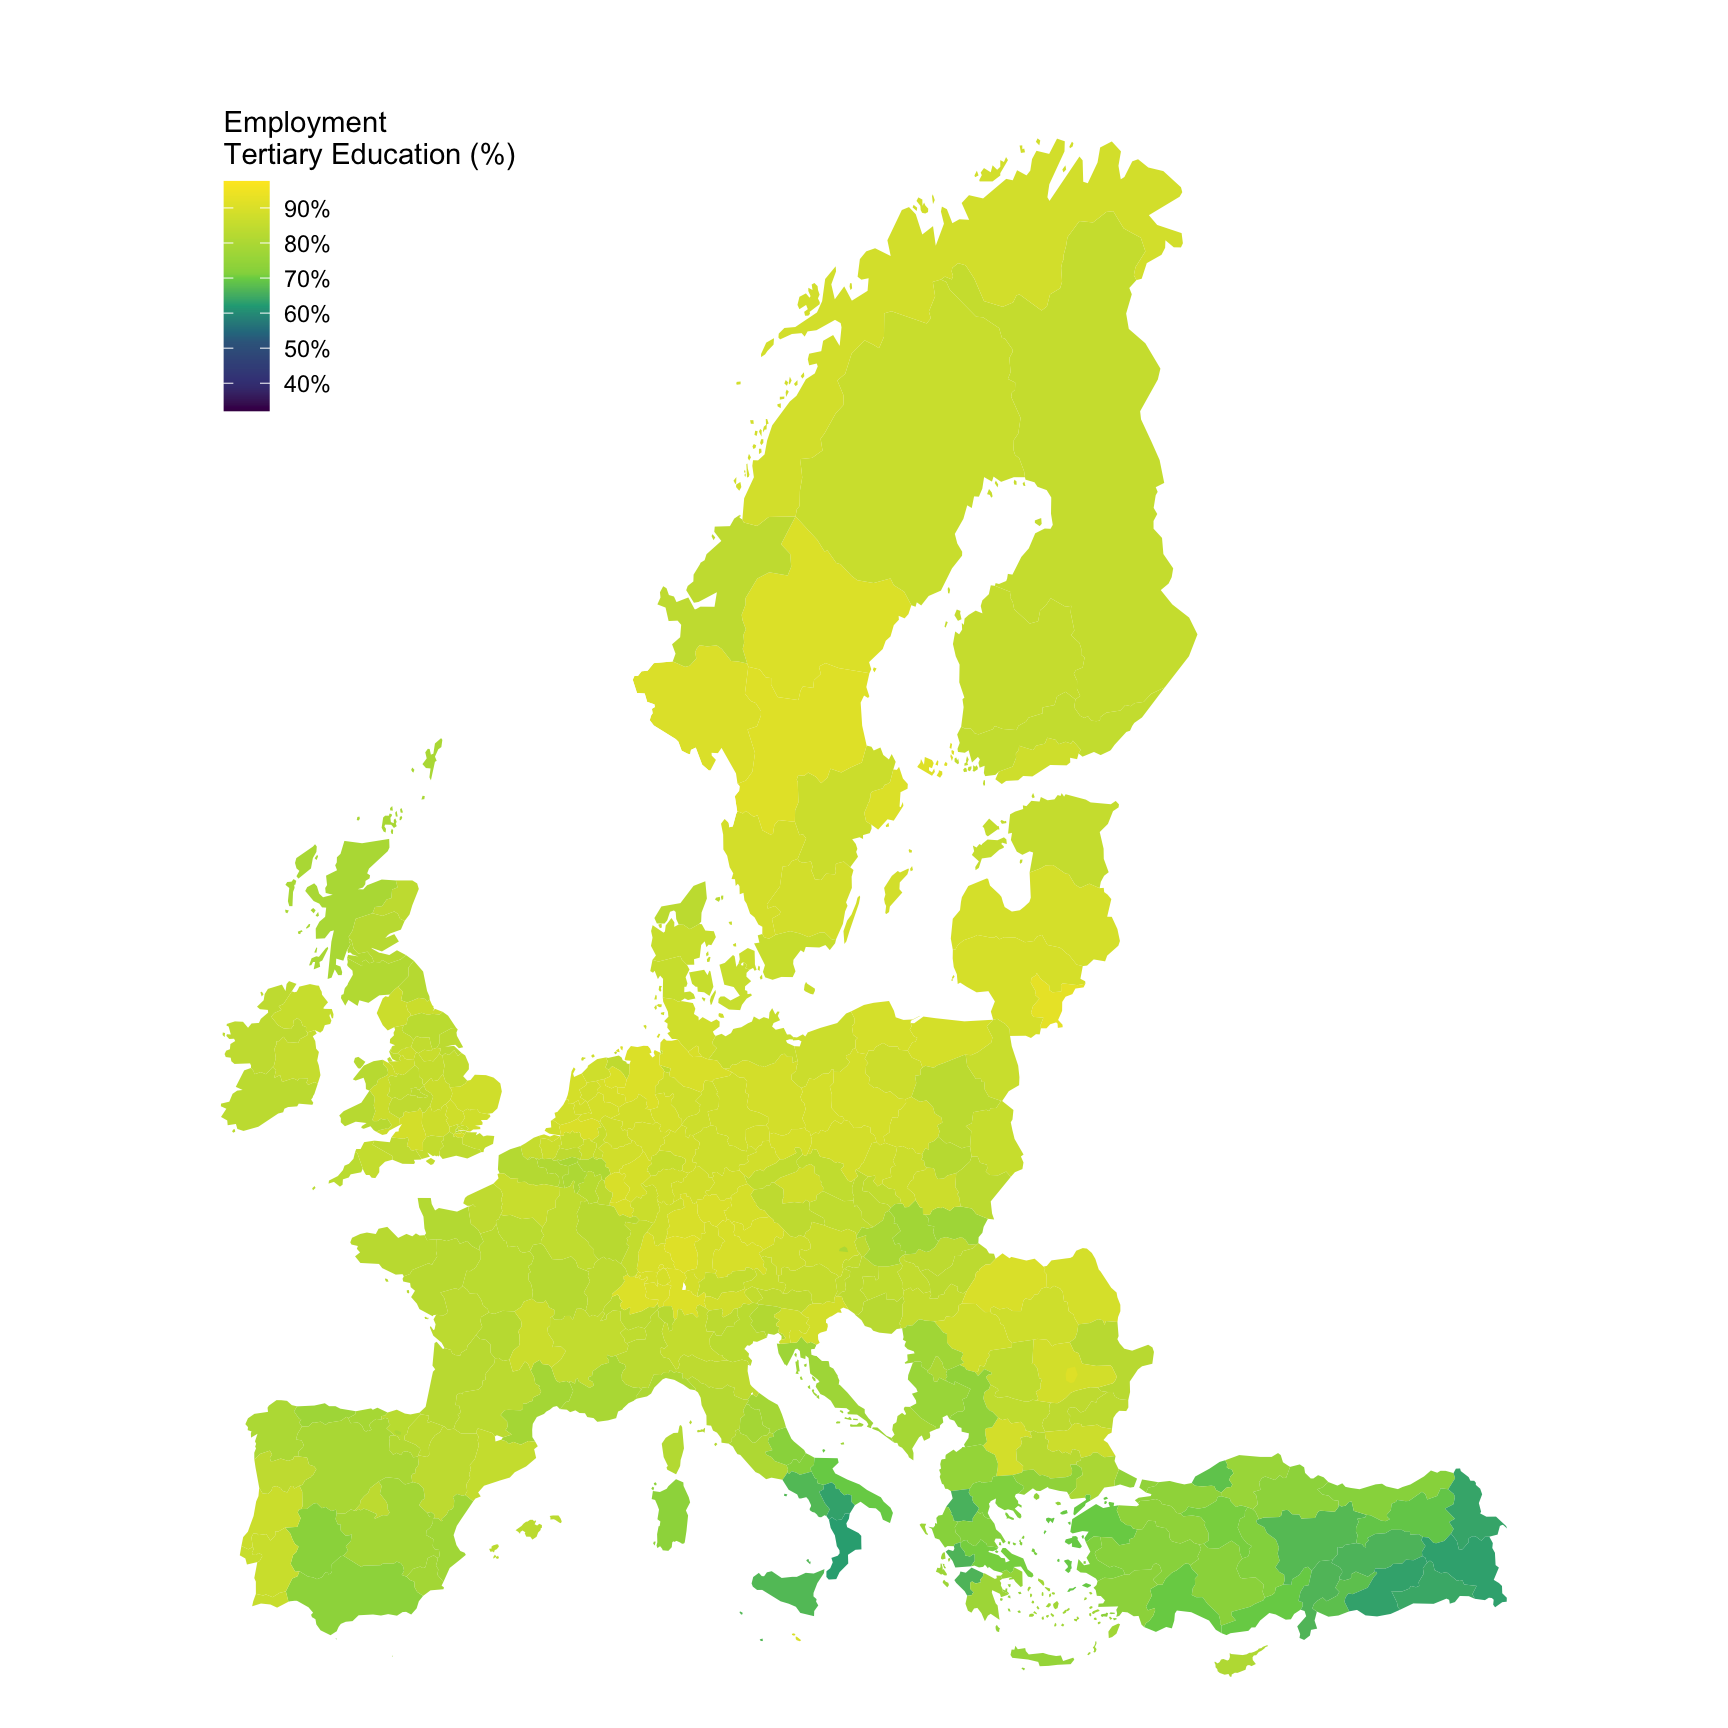
Education: levels 5-8
Code
lfst_r_lfe2emprtn %>%
  filter(unit == "PC",
         sex == "T",
         isced11 == "ED5-8",
         citizen == "TOTAL",
         nchar(geo) == 4,
         time == "2018") %>%
  right_join(europe_NUTS2, by = "geo") %>%
  filter(long >= -13.5, lat >= 33) %>%
  ggplot(., aes(x = long, y = lat, group = group, fill = values/100)) +
  geom_polygon() + coord_map() +
  scale_fill_viridis_c(na.value = "white",
                       labels = scales::percent_format(accuracy = 1),
                       breaks = 0.01*seq(20, 100, 10),
                       values = c(0, 0.1, 0.3, 0.4, 0.5, 0.6, 1)) +
  theme_void() + theme(legend.position = c(0.15, 0.85)) +
  labs(fill = "Employment \nTertiary Education (%)")