c_birth
Code
lfst_r_lfe2emprc %>%
  left_join(c_birth, by = "c_birth") %>%
  group_by(c_birth, C_birth) %>%
  summarise(Nobs = n()) %>%
  arrange(-Nobs) %>%
  {if (is_html_output()) print_table(.) else .}
| TOTAL |
Total |
615962 |
| NAT |
Reporting country |
574439 |
| FOR |
Foreign country |
549879 |
| NEU27_2020_FOR |
Non-EU27 countries (from 2020) nor reporting country |
483869 |
| EU27_2020_FOR |
EU27 countries (from 2020) except reporting country |
459699 |
| NRP |
No response |
148506 |
isced11
Code
lfst_r_lfe2emprc %>%
  left_join(isced11, by = "isced11") %>%
  group_by(isced11, Isced11) %>%
  summarise(Nobs = n()) %>%
  arrange(-Nobs) %>%
  {if (is_html_output()) print_table(.) else .}
| TOTAL |
All ISCED 2011 levels |
674425 |
| ED3_4 |
Upper secondary and post-secondary non-tertiary education (levels 3 and 4) |
652492 |
| ED5-8 |
Tertiary education (levels 5-8) |
646118 |
| ED0-2 |
Less than primary, primary and lower secondary education (levels 0-2) |
636458 |
| NRP |
No response |
222801 |
| UNK |
Unknown |
60 |
age
Code
lfst_r_lfe2emprc %>%
  left_join(age, by = "age") %>%
  group_by(age, Age) %>%
  summarise(Nobs = n()) %>%
  arrange(-Nobs) %>%
  {if (is_html_output()) print_table(.) else .}
| Y15-64 |
From 15 to 64 years |
739441 |
| Y20-64 |
From 20 to 64 years |
723405 |
| Y25-54 |
From 25 to 54 years |
710215 |
| Y55-64 |
From 55 to 64 years |
659293 |
sex
Code
lfst_r_lfe2emprc %>%
  left_join(sex, by = "sex") %>%
  group_by(sex, Sex) %>%
  summarise(Nobs = n()) %>%
  arrange(-Nobs) %>%
  {if (is_html_output()) print_table(.) else .}
| T |
Total |
961937 |
| F |
Females |
936830 |
| M |
Males |
933587 |
unit
Code
lfst_r_lfe2emprc %>%
  left_join(unit, by = "unit") %>%
  group_by(unit, Unit) %>%
  summarise(Nobs = n()) %>%
  arrange(-Nobs) %>%
  {if (is_html_output()) print_table(.) else .}
geo
Code
lfst_r_lfe2emprc %>%
  left_join(geo, by = "geo") %>%
  group_by(geo, Geo) %>%
  summarise(Nobs = n()) %>%
  arrange(-Nobs) %>%
  {if (is_html_output()) datatable(., filter = 'top', rownames = F) else .}
time
Code
lfst_r_lfe2emprc %>%
  group_by(time) %>%
  summarise(Nobs = n()) %>%
  arrange(-Nobs) %>%
  {if (is_html_output()) datatable(., filter = 'top', rownames = F) else .}
Education Foreign: levels 0-2
Code
lfst_r_lfe2emprc %>%
  filter(unit == "PC",
         sex == "T",
         isced11 == "ED0-2",
         c_birth == "FOR",
         nchar(geo) == 4,
         time == "2018") %>%
  right_join(europe_NUTS2, by = "geo") %>%
  filter(long >= -13.5, lat >= 33) %>%
  ggplot(., aes(x = long, y = lat, group = group, fill = values/100)) +
  geom_polygon() + coord_map() +
  scale_fill_viridis_c(na.value = "white",
                       labels = scales::percent_format(accuracy = 1),
                       breaks = 0.01*seq(20, 100, 10),
                       values = c(0, 0.1, 0.3, 0.4, 0.5, 0.6, 1)) +
  theme_void() + theme(legend.position = c(0.15, 0.85)) +
  labs(fill = "Employment \nPrimary Education (%)")
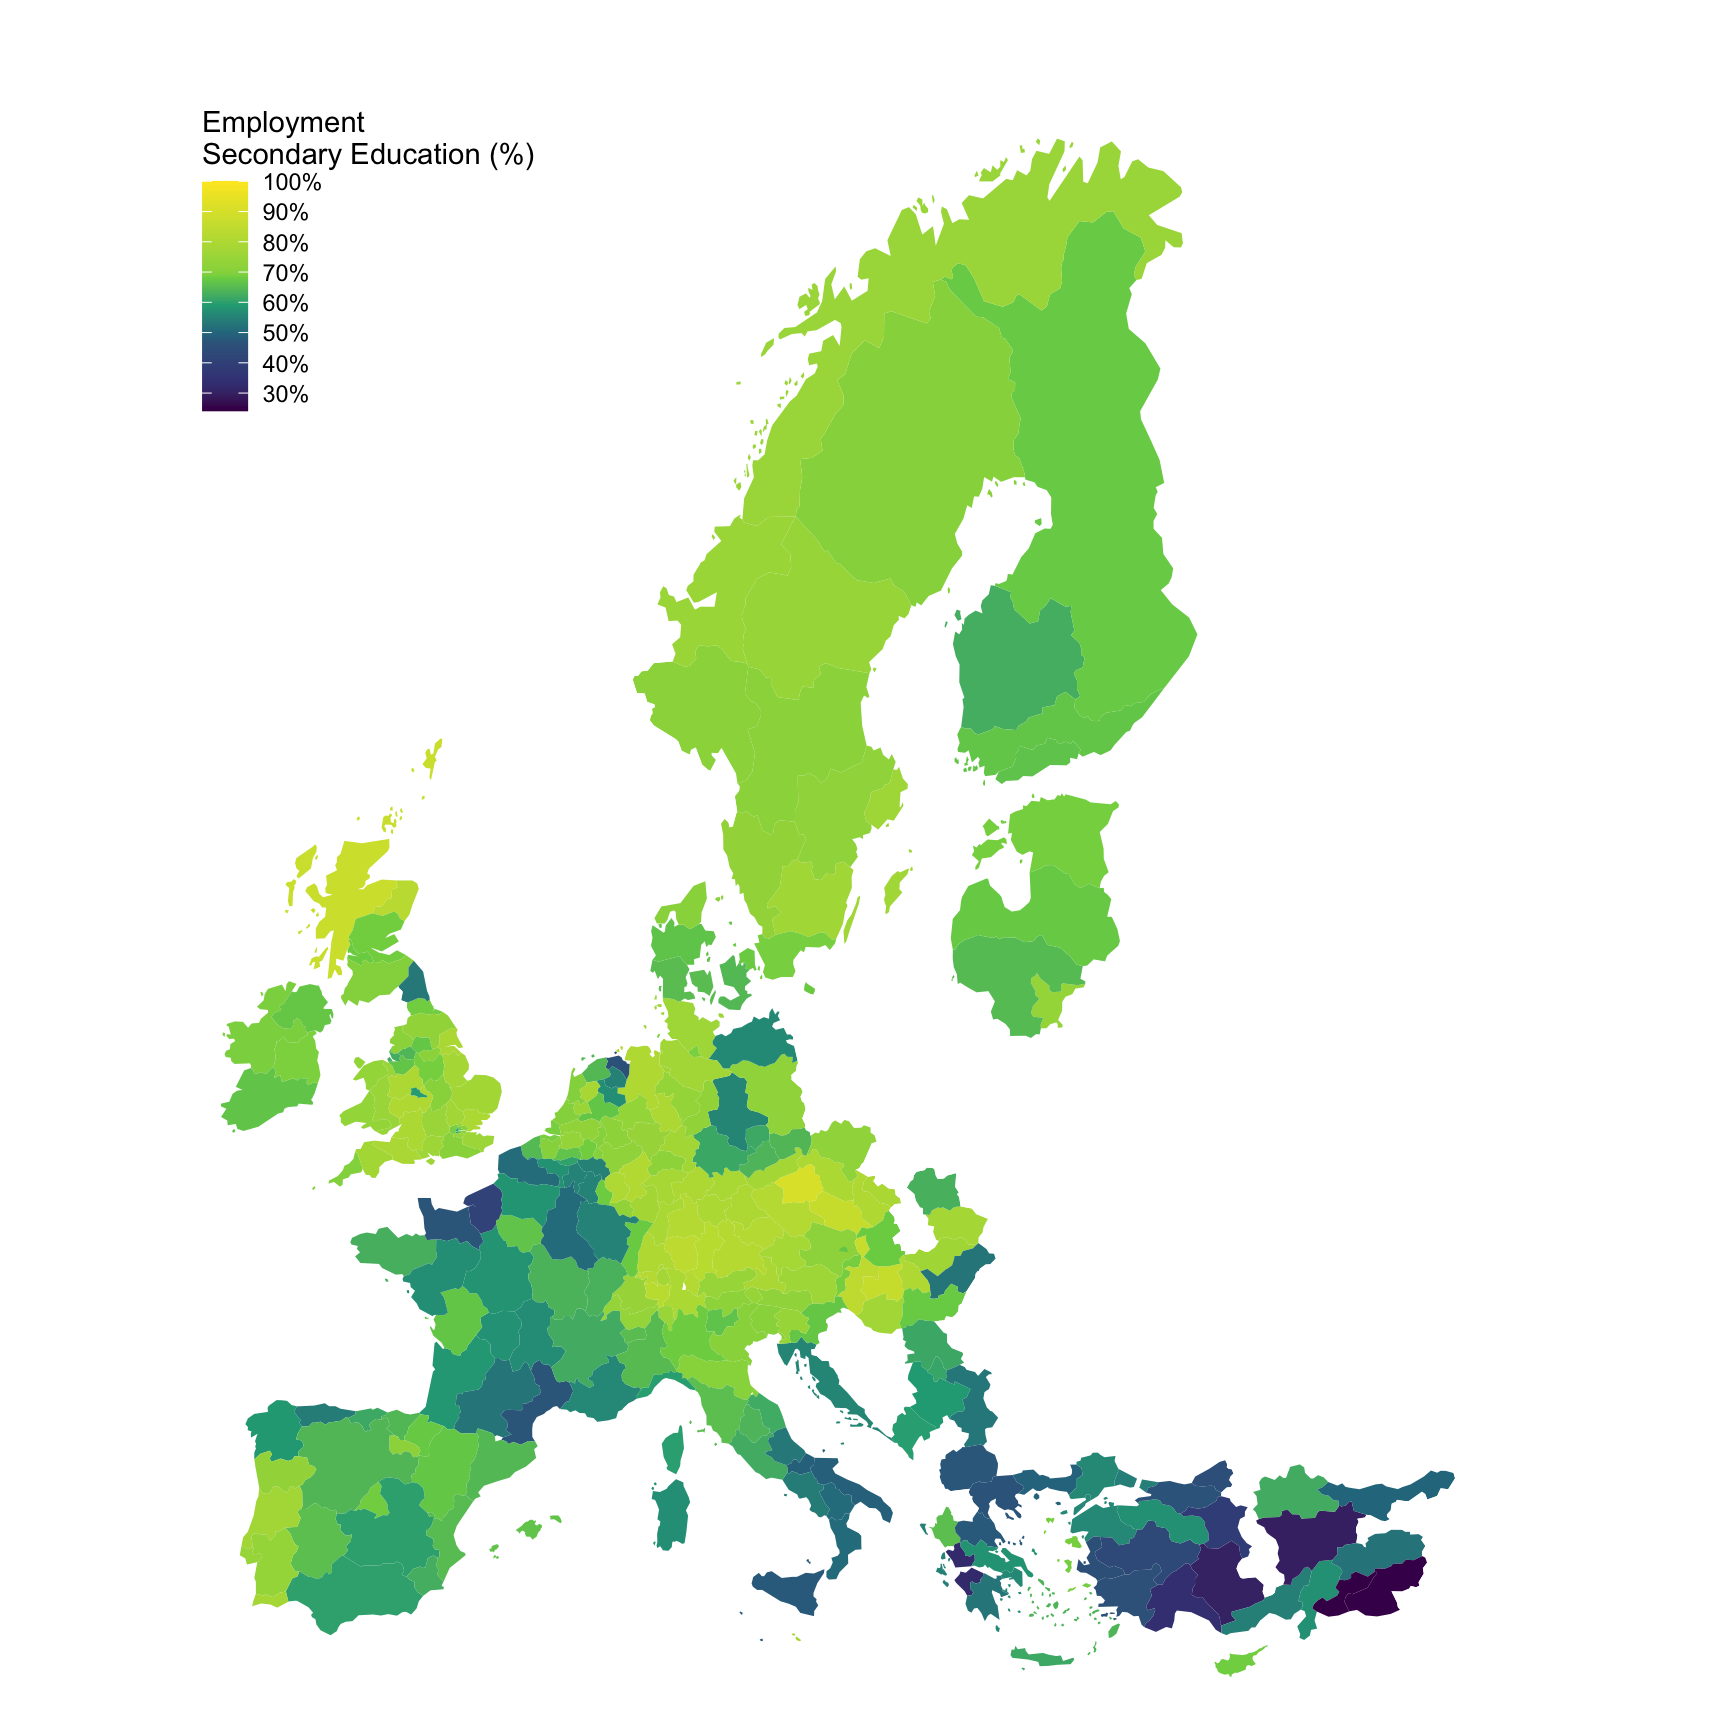
Upper secondary and post-secondary non-tertiary education (levels 3 and 4)
Education Foreign: levels 3-4
Code
lfst_r_lfe2emprc %>%
  filter(unit == "PC",
         sex == "T",
         isced11 == "ED3_4",
         c_birth == "FOR",
         nchar(geo) == 4,
         time == "2018") %>%
  right_join(europe_NUTS2, by = "geo") %>%
  filter(long >= -13.5, lat >= 33) %>%
  ggplot(., aes(x = long, y = lat, group = group, fill = values/100)) +
  geom_polygon() + coord_map() +
  scale_fill_viridis_c(na.value = "white",
                       labels = scales::percent_format(accuracy = 1),
                       breaks = 0.01*seq(20, 100, 10),
                       values = c(0, 0.1, 0.3, 0.4, 0.5, 0.6, 1)) +
  theme_void() + theme(legend.position = c(0.15, 0.85)) +
  labs(fill = "Employment \nSecondary Education (%)")
Education Foreign: levels 5-8
Code
lfst_r_lfe2emprc %>%
  filter(unit == "PC",
         sex == "T",
         isced11 == "ED5-8",
         c_birth == "FOR",
         nchar(geo) == 4,
         time == "2018") %>%
  right_join(europe_NUTS2, by = "geo") %>%
  filter(long >= -13.5, lat >= 33) %>%
  ggplot(., aes(x = long, y = lat, group = group, fill = values/100)) +
  geom_polygon() + coord_map() +
  scale_fill_viridis_c(na.value = "white",
                       labels = scales::percent_format(accuracy = 1),
                       breaks = 0.01*seq(20, 100, 10),
                       values = c(0, 0.1, 0.3, 0.4, 0.5, 0.6, 1)) +
  theme_void() + theme(legend.position = c(0.15, 0.85)) +
  labs(fill = "Employment \nTertiary Education (%)")