Labour market transitions - quarterly data - lfsi_long_q

Data - Eurostat

unit

Code
lfsi_long_q %>%
  left_join(unit, by = "unit") %>%
  group_by(unit, Unit) %>%
  summarise(Nobs = n()) %>%
  arrange(-Nobs) %>%
  {if (is_html_output()) print_table(.) else .}
unit Unit Nobs
PC_EMP Percentage of total employment 97983
PC_INAC Percentage of population outside the labour force 97983
PC_UNE Percentage of unemployment 97983
THS_PER Thousand persons 95661

s_adj

Code
lfsi_long_q %>%
  left_join(s_adj, by = "s_adj") %>%
  group_by(s_adj, S_adj) %>%
  summarise(Nobs = n()) %>%
  arrange(-Nobs) %>%
  {if (is_html_output()) print_table(.) else .}
s_adj S_adj Nobs
SA Seasonally adjusted data, not calendar adjusted data 194859
NSA Unadjusted data (i.e. neither seasonally adjusted nor calendar adjusted data) 194751

indic_em

Code
lfsi_long_q %>%
  left_join(indic_em, by = "indic_em") %>%
  group_by(indic_em, Indic_em) %>%
  summarise(Nobs = n()) %>%
  arrange(-Nobs) %>%
  print_table_conditional()
indic_em Indic_em Nobs
E_E Transition employment - employment 43290
E_I Transition employment - outside the labour force 43290
E_U Transition employment - unemployment 43290
I_E Transition outside the labour force - employment 43290
I_I Transition outside the labour force - outside the labour force 43290
I_U Transition outside the labour force - unemployment 43290
U_E Transition unemployment - employment 43290
U_I Transition unemployment - outside the labour force 43290
U_U Transition unemployment - unemployment 43290

sex

Code
lfsi_long_q %>%
  left_join(sex, by = "sex") %>%
  group_by(sex, Sex) %>%
  summarise(Nobs = n()) %>%
  arrange(-Nobs) %>%
  {if (is_html_output()) print_table(.) else .}
sex Sex Nobs
F Females 129870
M Males 129870
T Total 129870

geo

Code
lfsi_long_q %>%
  left_join(geo, by = "geo") %>%
  group_by(geo, Geo) %>%
  summarise(Nobs = n()) %>%
  arrange(-Nobs) %>%
  mutate(Geo = ifelse(geo == "DE", "Germany", Geo)) %>%
  mutate(Flag = gsub(" ", "-", str_to_lower(Geo)),
         Flag = paste0('<img src="../../bib/flags/vsmall/', Flag, '.png" alt="Flag">')) %>%
  select(Flag, everything()) %>%
  {if (is_html_output()) datatable(., filter = 'top', rownames = F, escape = F) else .}

time

Code
lfsi_long_q %>%
  group_by(time) %>%
  summarise(Nobs = n()) %>%
  arrange(desc(time)) %>%
  print_table_conditional()

France

Table

Code
lfsi_long_q %>%
  filter(geo == "FR",
         sex == "T",
         s_adj == "SA",
         unit == "THS_PER",
         time %in% c("2015Q2", "2021Q2", "2019Q2", "2017Q2")) %>%
  filter(!is.na(values)) %>%
  left_join(indic_em, by = "indic_em") %>%
  select(indic_em, Indic_em, time, values) %>%
  spread(time, values) %>%
  print_table_conditional()
indic_em Indic_em 2015Q2 2017Q2 2019Q2 2021Q2
E_E Transition employment - employment 25273 25564 25988 26287
E_I Transition employment - outside the labour force 564 550 598 636
E_U Transition employment - unemployment 525 438 443 445
I_E Transition outside the labour force - employment 447 615 501 708
I_I Transition outside the labour force - outside the labour force 16599 16883 17142 16849
I_U Transition outside the labour force - unemployment 678 728 633 710
U_E Transition unemployment - employment 646 649 616 638
U_I Transition unemployment - outside the labour force 507 523 539 529
U_U Transition unemployment - unemployment 1873 1642 1415 1234

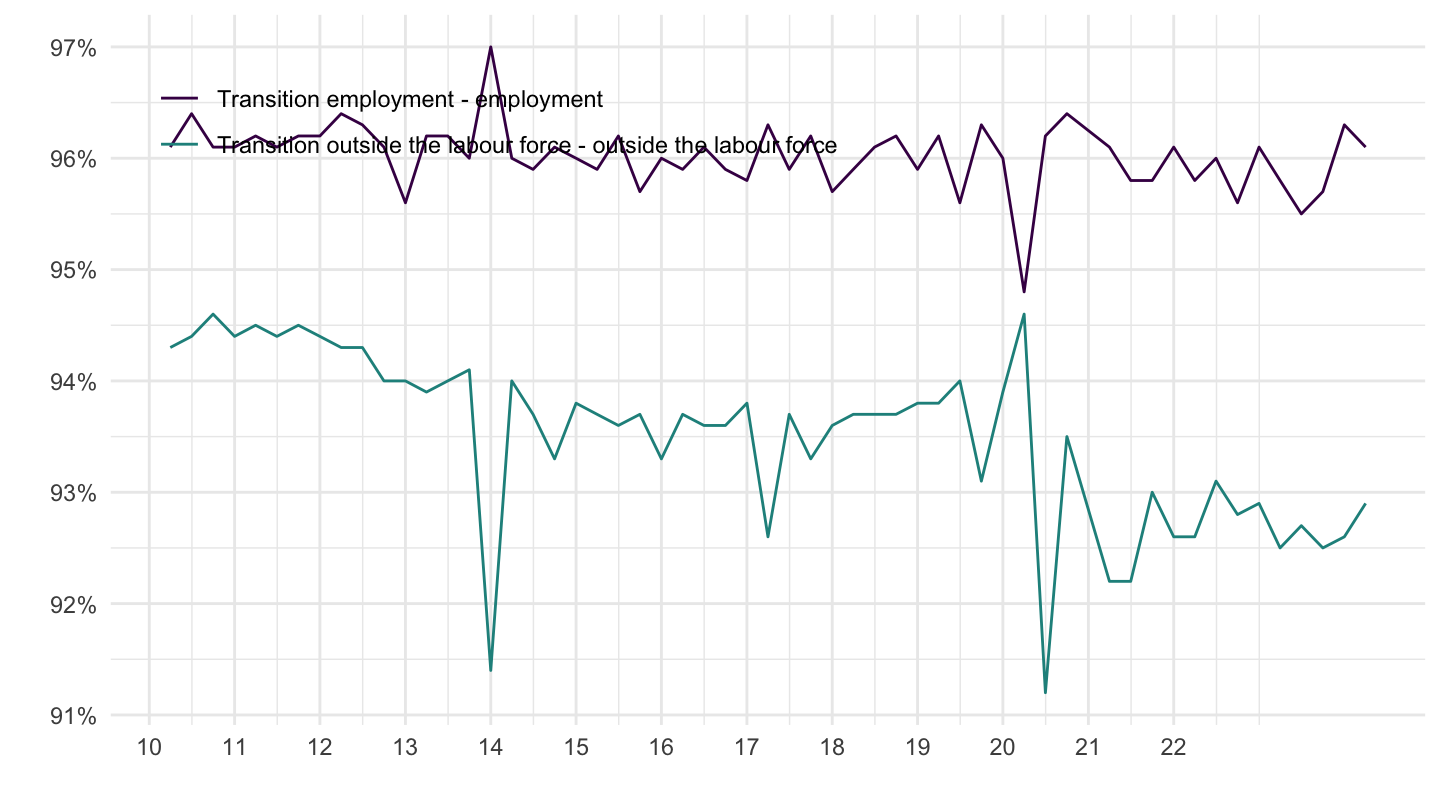
EE, II

Code
lfsi_long_q %>%
  filter(geo == "FR",
         sex == "T",
         s_adj == "SA",
         unit != "THS_PER",
         indic_em %in% c("E_E", "I_I")) %>%
  filter(!is.na(values)) %>%
  left_join(indic_em, by = "indic_em") %>%
  select(indic_em, Indic_em, time, values) %>%
  quarter_to_date() %>%
  ggplot + theme_minimal() + xlab("") + ylab("") +
  geom_line(aes(x = date, y = values/100, color = Indic_em)) +
  scale_color_manual(values = viridis(3)[1:2]) +
  scale_x_date(breaks = as.Date(paste0(seq(1960, 2022, 1), "-01-01")),
               labels = date_format("%y")) +
  theme(legend.position = c(0.3, 0.85),
        legend.title = element_blank()) +
  scale_y_continuous(breaks = 0.01*seq(0, 100, 1),
                     labels = scales::percent_format(acc = 1))
Italy

EE, II

Code
lfsi_long_q %>%
  filter(geo == "IT",
         sex == "T",
         s_adj == "SA",
         unit != "THS_PER",
         indic_em %in% c("E_E", "I_I")) %>%
  filter(!is.na(values)) %>%
  left_join(indic_em, by = "indic_em") %>%
  select(indic_em, Indic_em, time, values) %>%
  quarter_to_date() %>%
  ggplot + theme_minimal() + xlab("") + ylab("") +
  geom_line(aes(x = date, y = values/100, color = Indic_em)) +
  scale_color_manual(values = viridis(3)[1:2]) +
  scale_x_date(breaks = as.Date(paste0(seq(1960, 2022, 1), "-01-01")),
               labels = date_format("%y")) +
  theme(legend.position = c(0.3, 0.85),
        legend.title = element_blank()) +
  scale_y_continuous(breaks = 0.01*seq(0, 100, 1),
                     labels = scales::percent_format(acc = 1))