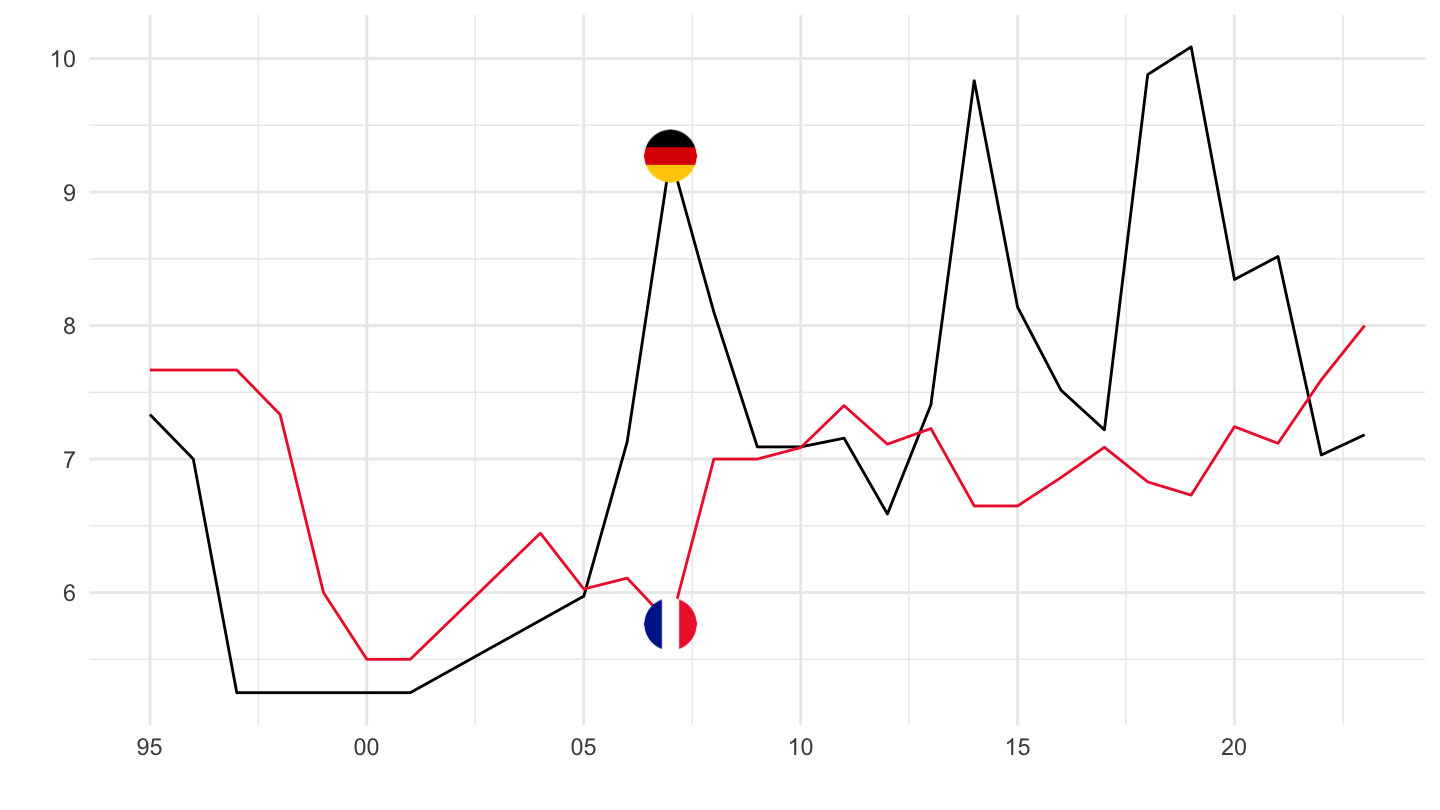
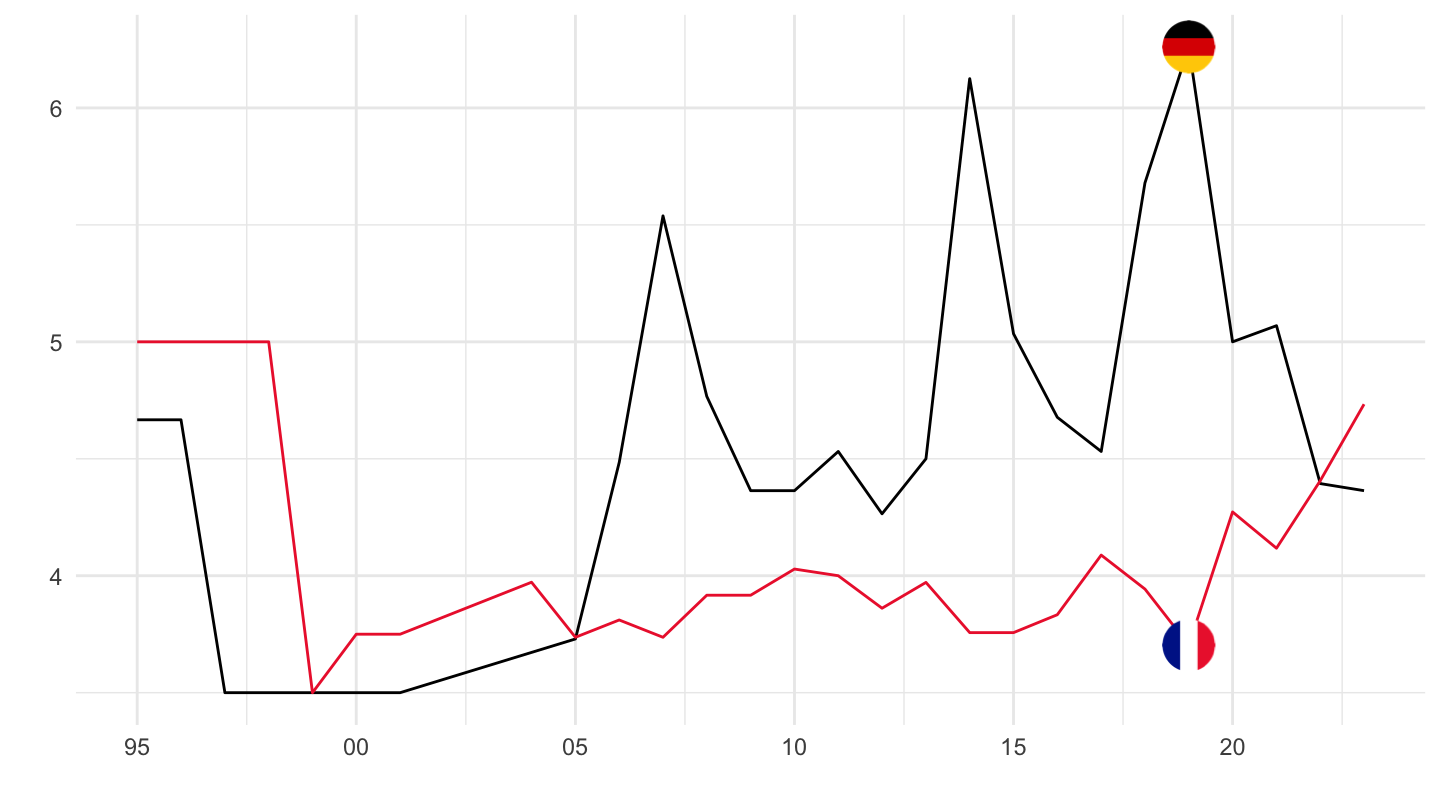
Distribution of income by quantiles - EU-SILC and ECHP surveys - ilc_di01

Data - Eurostat

quantile

Code
ilc_di01 %>%
  left_join(quantile, by = "quantile") %>%
  group_by(quantile, Quantile) %>%
  summarise(Nobs = n()) %>%
  arrange(-Nobs) %>%
  print_table_conditional()
quantile Quantile Nobs
D1 First decile 4964
D2 Second decile 4964
D3 Third decile 4964
D4 Fourth decile 4964
D5 Fifth decile 4964
D6 Sixth decile 4964
D7 Seventh decile 4964
D8 Eighth decile 4964
D9 Ninth decile 4964
Q1 First quartile 4964
Q2 Second quartile 4964
Q3 Third quartile 4964
QU1 First quintile 4964
QU2 Second quintile 4964
QU3 Third quintile 4964
QU4 Fourth quintile 4964
P1 First percentile 4368
P5 Fifth percentile 4368
P95 Ninety-fifth percentile 4368
P96 Ninety-sixth percentile 4368
P97 Ninety-seventh percentile 4368
P98 Ninety-eighth percentile 4368
P99 Ninety-ninth percentile 4368
P3 Third percentile 4362
P4 Fourth percentile 4362
P2 Second percentile 4350
D10 Tenth decile 2482
Q4 Fourth quartile 2482
QU5 Fifth quintile 2482
P100 Hundredth percentile 2184

indic_il

Code
ilc_di01 %>%
  left_join(indic_il, by = "indic_il") %>%
  group_by(indic_il, Indic_il) %>%
  summarise(Nobs = n()) %>%
  arrange(-Nobs) %>%
  print_table_conditional()
indic_il Indic_il Nobs
SHARE Share of national equivalised income 71167
TC Top cut-off point 61537

geo

Code
ilc_di01 %>%
  left_join(geo, by = "geo") %>%
  group_by(geo, Geo) %>%
  summarise(Nobs = n()) %>%
  arrange(-Nobs) %>%
  mutate(Geo = ifelse(geo == "DE", "Germany", Geo)) %>%
  mutate(Flag = gsub(" ", "-", str_to_lower(Geo)),
         Flag = paste0('<img src="../../bib/flags/vsmall/', Flag, '.png" alt="Flag">')) %>%
  select(Flag, everything()) %>%
  {if (is_html_output()) datatable(., filter = 'top', rownames = F, escape = F) else .}

D10 / D1

Code
ilc_di01 %>%
  filter(quantile %in% c("D1", "D10"),
         geo %in% c("FR", "DE"),
         currency == "EUR",
         indic_il == "SHARE") %>%
  time_to_date %>%
  left_join(geo, by = "geo") %>%
  arrange(date, quantile, geo, values) %>%
  spread(quantile, values) %>%
  mutate(values = D10/D1) %>%
  left_join(colors, by = c("Geo" = "country")) %>%
  ggplot + geom_line(aes(x = date, y = values, color = color)) +
  scale_color_identity() + add_2flags + theme_minimal()  +
  scale_x_date(breaks = as.Date(paste0(seq(1960, 2020, 5), "-01-01")),
               labels = date_format("%y")) +
  xlab("") + ylab("") +
  scale_y_continuous(breaks = seq(0, 20, 1))

D9 / D1

Code
ilc_di01 %>%
  filter(quantile %in% c("D1", "D9"),
         geo %in% c("FR", "DE"),
         currency == "EUR",
         indic_il == "SHARE") %>%
  time_to_date %>%
  left_join(geo, by = "geo") %>%
  arrange(date, quantile, geo, values) %>%
  spread(quantile, values) %>%
  mutate(values = D9/D1) %>%
  left_join(colors, by = c("Geo" = "country")) %>%
  ggplot + geom_line(aes(x = date, y = values, color = color)) +
  scale_color_identity() + add_2flags + theme_minimal()  +
  scale_x_date(breaks = as.Date(paste0(seq(1960, 2020, 5), "-01-01")),
               labels = date_format("%y")) +
  xlab("") + ylab("") +
  scale_y_continuous(breaks = seq(0, 20, 1))