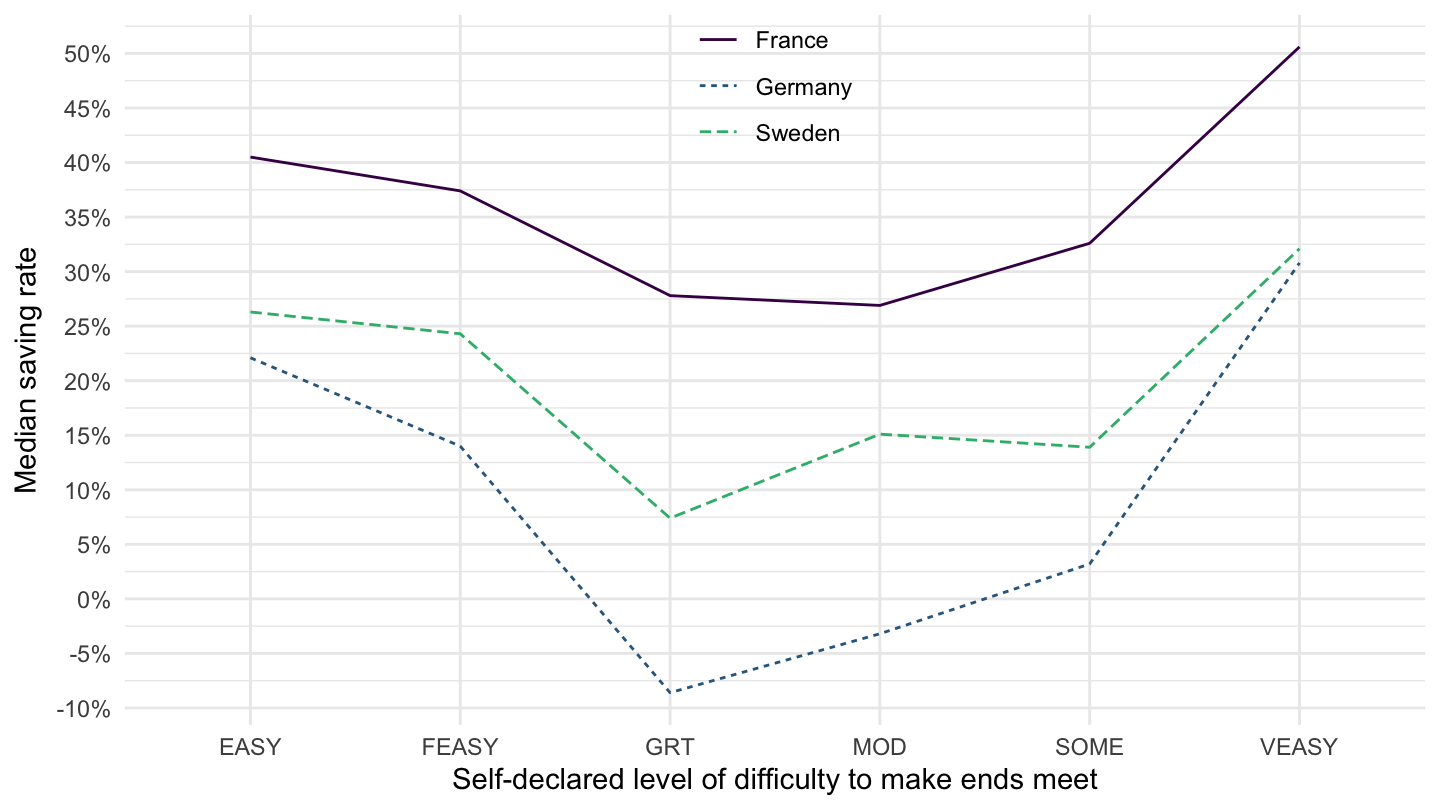
icw_sr_12 %>%
  filter(time == "2015",
         geo %in% c("SE", "FR", "DE")) %>%
  left_join(geo, by = "geo") %>%
  ggplot + geom_line(aes(x = lev_diff, y = values/100, color = Geo, group = Geo, linetype = Geo)) +
  scale_color_manual(values = viridis(4)[1:3]) + theme_minimal() +
  theme(legend.position = c(0.5, 0.9),
        legend.title = element_blank()) +
  xlab("Self-declared level of difficulty to make ends meet") + ylab("Median saving rate") +
  scale_y_continuous(breaks = 0.01*seq(-30, 50, 5),
                     labels = percent_format(accuracy = 1))
