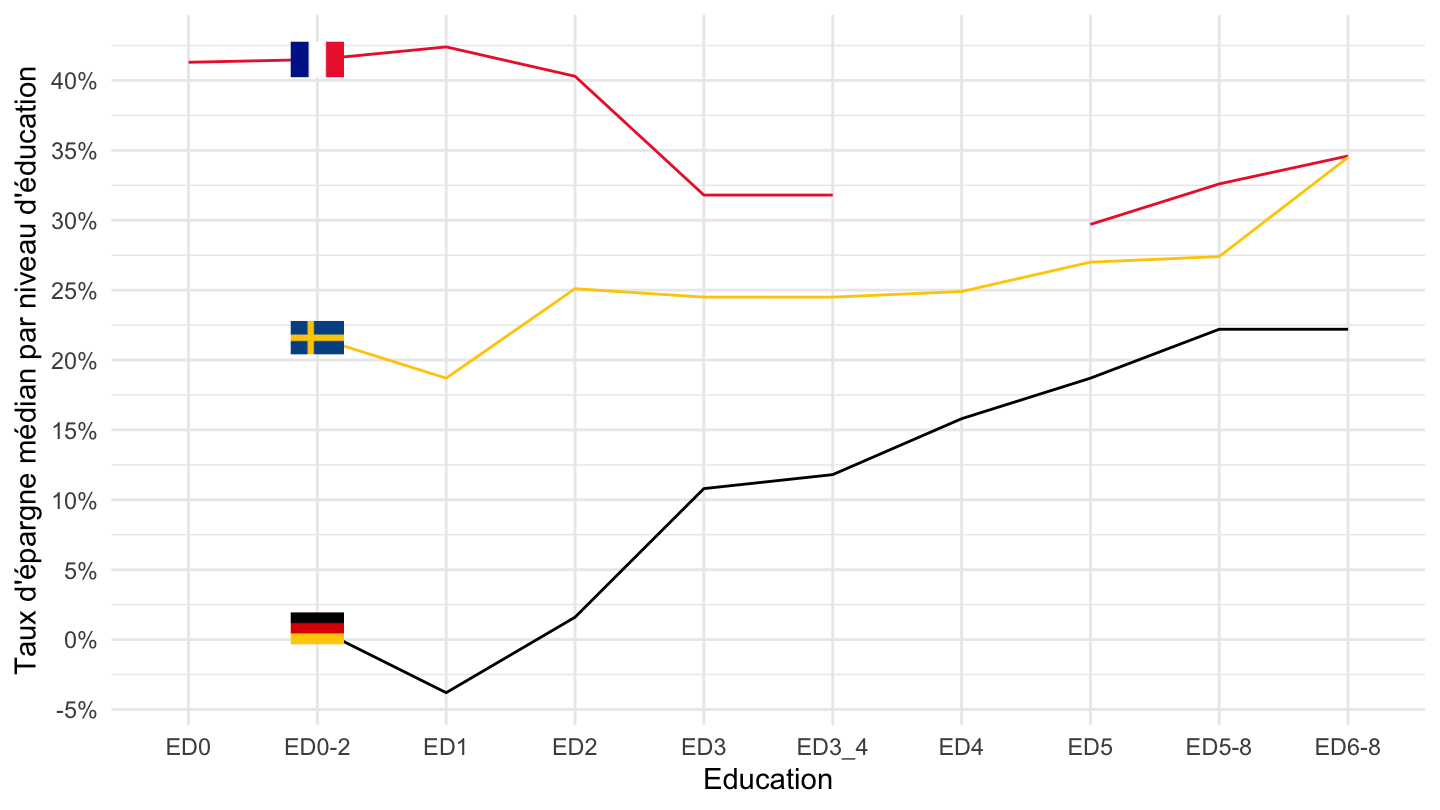
icw_sr_04 %>%
  filter(time == "2015",
         geo %in% c("SE", "FR", "DE"),
         grepl("ED", isced11)) %>%
  left_join(geo, by = "geo") %>%
  left_join(colors, by = c("Geo" = "country")) %>%
  mutate(values = values/100) %>%
  ggplot + geom_line(aes(x = isced11, y = values, color = color, group = color)) +
  scale_color_identity() + theme_minimal() +
  geom_image(data = . %>%
               group_by(isced11) %>%
               filter(n() == 3) %>%
               arrange(values) %>%
               mutate(dist = min(values[2]-values[1],values[3]-values[2],values[4]-values[3])) %>%
               arrange(-dist, isced11) %>%
               head(3) %>%
               mutate(image = paste0("../../icon/flag/", str_to_lower(gsub(" ", "-", Geo)), ".png")),
             aes(x = isced11, y = values, image = image), asp = 1.5) +
  xlab("Education") + ylab("Taux d'épargne médian par niveau d'éducation") +
  scale_y_continuous(breaks = 0.01*seq(-30, 50, 5),
                     labels = percent_format(accuracy = 1))
