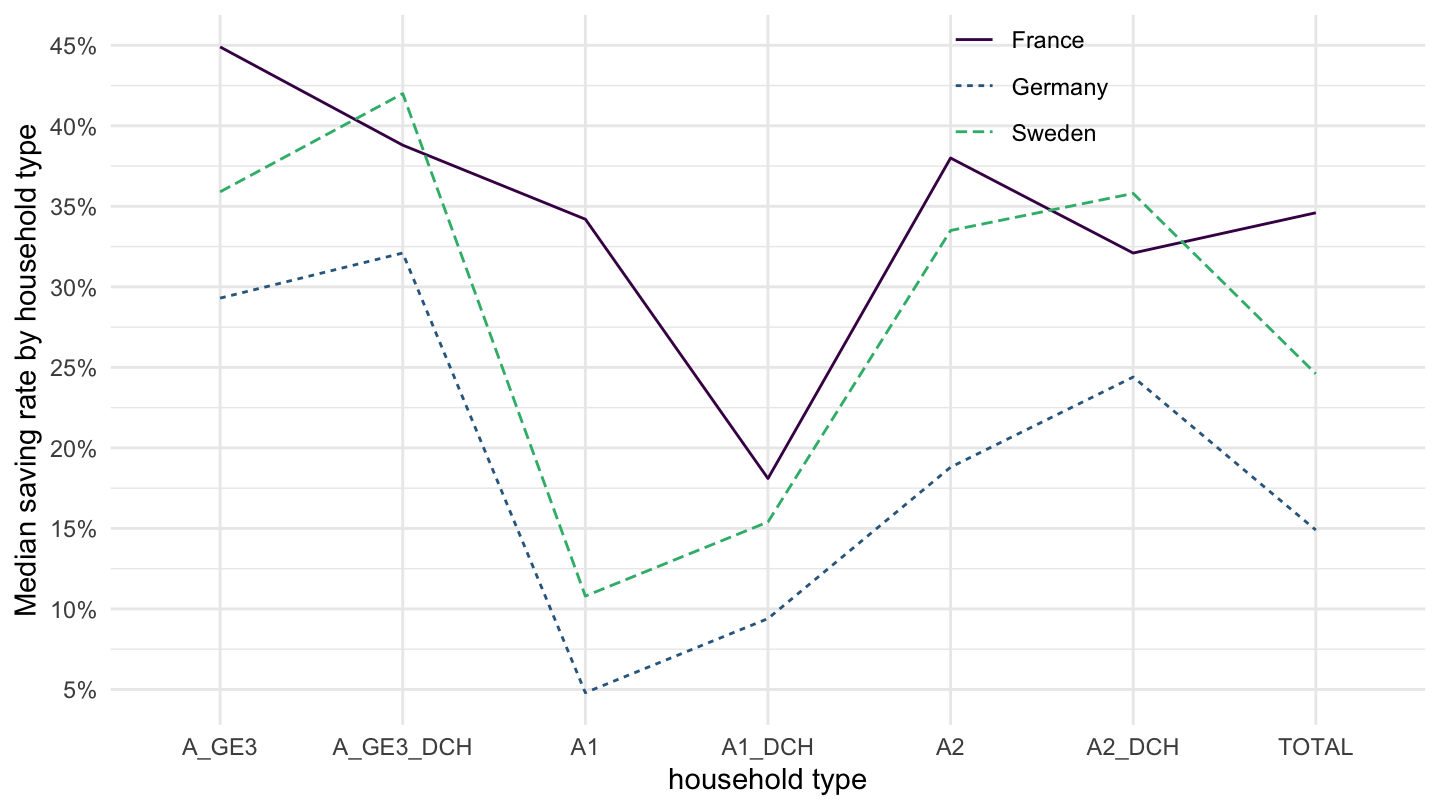
Median saving rate by household type - experimental statistics - icw_sr_02

Data - Eurostat

hhcomp

Code
icw_sr_02 %>%
  left_join(hhcomp, by = "hhcomp") %>%
  group_by(hhcomp, Hhcomp) %>%
  summarise(Nobs = n()) %>%
  arrange(-Nobs) %>%
  {if (is_html_output()) print_table(.) else .}
hhcomp Hhcomp Nobs
A1 One adult 84
A1_DCH One adult with dependent children 84
A2 Two adults 84
A2_DCH Two adults with dependent children 84
A_GE3 Three or more adults 84
A_GE3_DCH Three or more adults with dependent children 84
TOTAL Total 84

unit

Code
icw_sr_02 %>%
  left_join(unit, by = "unit") %>%
  group_by(unit, Unit) %>%
  summarise(Nobs = n()) %>%
  arrange(-Nobs) %>%
  {if (is_html_output()) print_table(.) else .}
unit Unit Nobs
PC_DI Percentage of disposable income 588

geo

Code
icw_sr_02 %>%
  left_join(geo, by = "geo") %>%
  group_by(geo, Geo) %>%
  summarise(Nobs = n()) %>%
  arrange(-Nobs) %>%
  {if (is_html_output()) datatable(., filter = 'top', rownames = F) else .}

time

Code
icw_sr_02 %>%
  group_by(time) %>%
  summarise(Nobs = n()) %>%
  arrange(-Nobs) %>%
  {if (is_html_output()) print_table(.) else .}
time Nobs
2015 217
2010 189
2020 182

2010

Code
icw_sr_02 %>%
  filter(time == "2010") %>%
  select(hhcomp, geo, values) %>%
  left_join(geo, by = "geo") %>%
  spread(hhcomp, values) %>%
  select(geo, Geo, TOTAL, everything()) %>%
  {if (is_html_output()) print_table(.) else .}
geo Geo TOTAL A_GE3 A_GE3_DCH A1 A1_DCH A2 A2_DCH
AT Austria 18.0 34.3 30.1 8.3 2.8 22.1 19.2
BE Belgium 8.9 29.7 14.0 -0.3 -0.4 8.4 16.5
BG Bulgaria 38.0 51.2 44.2 15.9 23.6 36.9 39.5
CY Cyprus 12.2 22.3 6.1 21.8 -19.6 18.1 0.4
CZ Czechia 23.9 32.6 31.9 13.4 11.8 24.7 27.1
DE Germany 13.5 24.7 23.3 5.6 4.8 15.2 22.2
DK Denmark 4.3 21.2 17.2 -4.1 -17.5 13.7 15.2
EE Estonia 34.9 42.0 45.5 28.2 23.7 39.4 36.7
EL Greece -11.2 6.8 -12.2 -22.9 -53.8 1.8 -26.3
ES Spain 16.1 26.0 16.6 16.5 -11.8 20.7 7.5
FI Finland 22.2 40.1 25.2 21.2 6.2 26.8 17.0
FR France 29.1 40.4 30.2 29.8 12.5 32.7 25.5
HR Croatia 4.0 17.5 14.9 -11.5 -5.8 6.0 2.5
HU Hungary 16.3 29.8 28.3 5.8 8.7 20.8 17.2
IE Ireland 18.4 14.8 15.0 22.6 1.5 23.5 18.6
IT Italy 26.4 43.6 27.8 22.5 -17.7 31.7 19.6
LT Lithuania 22.8 39.4 34.7 11.6 -6.4 28.4 23.6
LU Luxembourg 28.4 43.1 36.1 24.3 0.6 32.2 27.2
LV Latvia 10.5 27.2 25.7 1.2 -7.4 14.5 12.6
MT Malta 13.7 30.4 23.6 7.2 -28.4 12.8 2.2
PL Poland 24.7 37.0 32.7 15.8 12.2 27.0 22.9
PT Portugal 13.1 25.3 13.1 12.7 -15.1 21.8 2.7
RO Romania -5.1 9.6 -2.2 -14.5 -20.4 3.4 -9.8
SE Sweden 18.0 31.1 30.7 8.9 1.4 27.0 24.5
SI Slovenia 18.0 35.1 30.9 1.0 -4.4 22.1 18.8
SK Slovakia 24.4 33.7 35.2 11.0 15.4 25.0 26.3
UK United Kingdom 22.9 32.0 27.2 19.8 -5.9 25.9 25.4

2015

Code
icw_sr_02 %>%
  filter(time == "2015") %>%
  select(hhcomp, geo, values) %>%
  left_join(geo, by = "geo") %>%
  spread(hhcomp, values) %>%
  select(geo, Geo, TOTAL, everything()) %>%
  {if (is_html_output()) print_table(.) else .}
geo Geo TOTAL A_GE3 A_GE3_DCH A1 A1_DCH A2 A2_DCH
AT Austria 21.1 35.4 35.8 12.8 6.2 25.7 21.4
BE Belgium 19.0 37.1 35.9 7.4 13.0 18.0 29.8
BG Bulgaria 17.4 31.3 27.8 2.8 5.4 20.9 19.6
CY Cyprus 10.5 18.6 12.3 4.7 1.3 11.6 10.9
CZ Czechia 25.5 36.4 37.5 15.6 12.4 27.0 31.5
DE Germany 14.9 29.3 32.1 4.8 9.4 18.8 24.4
DK Denmark 25.6 47.1 41.3 12.1 13.4 29.6 41.0
EA Euro area (EA11-1999, EA12-2001, EA13-2007, EA15-2008, EA16-2009, EA17-2011, EA18-2014, EA19-2015, EA20-2023) 20.7 30.5 25.6 14.7 9.3 24.5 22.3
EA20 Euro area – 20 countries (from 2023) 20.5 30.1 25.0 14.5 9.2 24.4 22.1
EE Estonia 34.9 45.7 43.4 31.8 18.0 39.4 31.6
EL Greece -6.5 6.3 -6.9 -9.2 -28.4 3.6 -19.0
ES Spain 19.2 28.4 14.8 23.0 -6.8 23.1 12.2
EU European Union (EU6-1958, EU9-1973, EU10-1981, EU12-1986, EU15-1995, EU25-2004, EU27-2007, EU28-2013, EU27-2020) 20.1 30.2 25.7 13.2 3.9 24.0 21.8
EU27_2020 European Union - 27 countries (from 2020) 21.0 30.9 27.0 13.8 9.2 24.9 22.7
FI Finland 19.5 30.5 30.4 15.7 10.3 26.6 16.8
FR France 34.6 44.9 38.8 34.2 18.1 38.0 32.1
HR Croatia 4.4 17.5 12.8 -5.6 -19.7 5.5 -1.7
HU Hungary 14.6 24.1 27.0 5.8 5.7 17.1 17.0
IE Ireland 25.2 27.8 25.8 23.7 14.6 27.7 25.9
LT Lithuania 31.6 44.9 39.2 19.4 15.8 41.5 33.3
LU Luxembourg 27.0 45.8 34.4 17.4 13.6 29.3 29.1
LV Latvia 24.6 41.4 39.0 8.7 15.5 30.9 28.4
MT Malta 17.8 33.3 20.1 19.4 -1.4 18.2 9.4
NL Netherlands 15.8 31.9 34.3 -0.9 8.9 18.9 29.7
PL Poland 29.5 38.3 35.6 19.3 10.2 33.5 27.9
PT Portugal 18.9 30.9 22.1 16.9 -1.2 23.3 14.1
RO Romania 10.9 22.8 13.9 2.5 -5.9 16.3 9.0
SE Sweden 24.6 35.9 42.0 10.8 15.4 33.5 35.8
SI Slovenia 22.8 33.0 27.2 18.1 -1.8 29.9 18.1
SK Slovakia 17.6 32.7 32.3 -2.0 -2.6 18.3 17.5
UK United Kingdom 15.0 26.2 16.2 9.7 -16.7 19.5 15.9

Germany, France, Sweden

Code
icw_sr_02 %>%
  filter(time == "2015",
         geo %in% c("SE", "FR", "DE")) %>%
  left_join(geo, by = "geo") %>%
  ggplot + geom_line(aes(x = hhcomp, y = values/100, color = Geo, linetype = Geo, group = Geo)) +
  scale_color_manual(values = viridis(4)[1:3]) + theme_minimal() +
  theme(legend.position = c(0.7, 0.9),
        legend.title = element_blank()) +
  xlab("household type") + ylab("Median saving rate by household type") +
  scale_y_continuous(breaks = 0.01*seq(-30, 50, 5),
                     labels = percent_format(accuracy = 1))