Code
tibble(LAST_DOWNLOAD = as.Date(file.info("~/iCloud/website/data/eurostat/icw_sr_01.RData")$mtime)) %>%
print_table_conditional()| LAST_DOWNLOAD |
|---|
| 2026-01-30 |
Data - Eurostat
tibble(LAST_DOWNLOAD = as.Date(file.info("~/iCloud/website/data/eurostat/icw_sr_01.RData")$mtime)) %>%
print_table_conditional()| LAST_DOWNLOAD |
|---|
| 2026-01-30 |
| LAST_COMPILE |
|---|
| 2026-01-31 |
icw_sr_01 %>%
  group_by(time) %>%
  summarise(Nobs = n()) %>%
  arrange(desc(time)) %>%
  head(1) %>%
print_table_conditional()| time | Nobs |
|---|---|
| 2020 | 377 |
icw_sr_01 %>%
  left_join(age, by = "age") %>%
  group_by(age, Age) %>%
  summarise(Nobs = n()) %>%
  arrange(-Nobs) %>%
print_table_conditional()| age | Age | Nobs |
|---|---|---|
| TOTAL | Total | 87 |
| Y_LT30 | Less than 30 years | 87 |
| Y30-39 | From 30 to 39 years | 86 |
| Y35-44 | From 35 to 44 years | 86 |
| Y40-49 | From 40 to 49 years | 86 |
| Y45-54 | From 45 to 54 years | 86 |
| Y50-59 | From 50 to 59 years | 86 |
| Y55-64 | From 55 to 64 years | 86 |
| Y60-69 | From 60 to 69 years | 86 |
| Y65-74 | From 65 to 74 years | 86 |
| Y_GE70 | 70 years or over | 86 |
| Y_GE75 | 75 years or over | 86 |
| Y_LT35 | Less than 35 years | 86 |
| Y30-44 | From 30 to 44 years | 26 |
| Y45-59 | From 45 to 59 years | 26 |
| Y_GE60 | 60 years or over | 26 |
| UNK | Unknown | 15 |
icw_sr_01 %>%
  left_join(unit, by = "unit") %>%
  group_by(unit, Unit) %>%
  summarise(Nobs = n()) %>%
  arrange(-Nobs) %>%
print_table_conditional()| unit | Unit | Nobs |
|---|---|---|
| PC_DI | Percentage of disposable income | 1213 |
icw_sr_01 %>%
  left_join(geo, by = "geo") %>%
  group_by(geo, Geo) %>%
  summarise(Nobs = n()) %>%
  arrange(-Nobs) %>%
  mutate(Geo = ifelse(geo == "DE", "Germany", Geo)) %>%
  mutate(Flag = gsub(" ", "-", str_to_lower(Geo)),
         Flag = paste0('<img src="../../bib/flags/vsmall/', Flag, '.png" alt="Flag">')) %>%
  select(Flag, everything()) %>%
{if (is_html_output()) datatable(., filter = 'top', rownames = F, escape = F) else .}icw_sr_01 %>%
group_by(time) %>%
summarise(Nobs = n()) %>%
arrange(-Nobs) %>%
print_table_conditional()| time | Nobs |
|---|---|
| 2010 | 433 |
| 2015 | 403 |
| 2020 | 377 |
icw_sr_01 %>%
  filter(time == "2010") %>%
  select(age, geo, values) %>%
  left_join(geo, by = "geo") %>%
  spread(age, values) %>%
  select(geo, Geo, TOTAL, everything()) %>%
print_table_conditional()| geo | Geo | TOTAL | UNK | Y_GE60 | Y_GE70 | Y_GE75 | Y_LT30 | Y_LT35 | Y30-39 | Y30-44 | Y35-44 | Y40-49 | Y45-54 | Y45-59 | Y50-59 | Y55-64 | Y60-69 | Y65-74 |
|---|---|---|---|---|---|---|---|---|---|---|---|---|---|---|---|---|---|---|
| AT | Austria | 18.0 | NA | 21.7 | 21.5 | 20.1 | -8.0 | 1.1 | 14.9 | 16.1 | 21.3 | 22.8 | 22.5 | 22.2 | 20.7 | 15.8 | 16.0 | 22.1 |
| BE | Belgium | 8.9 | NA | 3.1 | -3.0 | -3.4 | 5.9 | 9.8 | 12.8 | 12.8 | 14.0 | 14.1 | 12.1 | 15.2 | 13.5 | 12.7 | 7.2 | 1.7 |
| BG | Bulgaria | 38.0 | NA | 29.5 | NA | NA | 35.0 | NA | NA | 40.4 | NA | NA | NA | 44.3 | NA | NA | NA | NA |
| CY | Cyprus | 12.2 | NA | 21.3 | 18.4 | 16.4 | -0.9 | 2.4 | 3.9 | 0.6 | 2.9 | 4.3 | 9.2 | 13.1 | 19.0 | 22.0 | 20.0 | 23.3 |
| CZ | Czechia | 23.9 | NA | 19.8 | 15.6 | 15.1 | 25.7 | 29.5 | 27.2 | 25.9 | 25.2 | 25.9 | 25.9 | 28.9 | 28.4 | 26.2 | 21.8 | 19.2 |
| DE | Germany | 13.5 | NA | 8.0 | 7.4 | 7.7 | 4.0 | 11.8 | 19.2 | 18.9 | 20.2 | 19.2 | 17.9 | 17.0 | 15.6 | 11.4 | 8.2 | 7.5 |
| DK | Denmark | 4.3 | NA | -0.9 | -7.6 | -10.8 | -30.4 | -8.2 | 11.0 | 13.2 | 9.3 | 11.1 | 13.2 | 14.9 | 15.9 | 14.9 | 6.8 | 1.7 |
| EE | Estonia | 34.9 | NA | 37.0 | 36.7 | 36.9 | 26.2 | 33.0 | 35.7 | 36.2 | 31.3 | 32.3 | 35.1 | 32.1 | 34.8 | 34.2 | 37.0 | 38.2 |
| EL | Greece | -11.2 | NA | 2.4 | 9.1 | 7.4 | -67.6 | -47.8 | -34.5 | -20.4 | -31.5 | -26.1 | -21.0 | -9.7 | -9.8 | -1.8 | 7.3 | 14.9 |
| ES | Spain | 16.1 | NA | 25.1 | 22.4 | 22.6 | -3.2 | 8.4 | 14.2 | 13.4 | 13.8 | 10.0 | 10.0 | 15.4 | 16.2 | 19.9 | 22.7 | 24.9 |
| FI | Finland | 22.2 | NA | 28.0 | 31.0 | 30.5 | -1.6 | 5.7 | 16.5 | 22.2 | 21.1 | 21.1 | 23.6 | 23.6 | 25.4 | 25.1 | 28.4 | 31.5 |
| FR | France | 29.1 | NA | 36.2 | 35.6 | 35.3 | 9.2 | 16.3 | 23.5 | 24.2 | 24.7 | 26.2 | 28.2 | 29.8 | 32.1 | 33.9 | 35.1 | 37.2 |
| HR | Croatia | 4.0 | NA | 0.1 | -1.6 | -3.1 | 2.7 | 9.0 | 8.5 | 6.3 | 4.6 | 4.2 | 6.2 | 6.6 | 8.6 | 7.5 | 4.7 | 2.9 |
| HU | Hungary | 16.3 | NA | 16.7 | 17.2 | 17.3 | 7.3 | 13.9 | 17.7 | 17.2 | 16.5 | 15.8 | 16.6 | 15.6 | 16.9 | 15.3 | 15.7 | 18.0 |
| IE | Ireland | 18.4 | NA | 21.9 | 23.6 | 22.0 | 1.6 | 12.7 | 18.3 | 17.6 | 18.0 | 17.7 | 17.6 | 21.1 | 20.1 | 19.6 | 18.8 | 23.6 |
| IT | Italy | 26.4 | NA | NA | 33.8 | 33.9 | -31.6 | 1.7 | 16.3 | NA | 18.2 | 19.2 | 21.8 | NA | 27.3 | 30.4 | 35.3 | 37.2 |
| LT | Lithuania | 22.8 | NA | 13.7 | 21.2 | 20.2 | 20.4 | 22.4 | 22.3 | 21.0 | 20.8 | 23.3 | 24.1 | 22.7 | 23.6 | 25.2 | 24.1 | 23.9 |
| LU | Luxembourg | 28.4 | NA | 35.7 | 32.0 | 33.2 | 13.7 | 19.3 | 23.9 | 26.3 | 25.2 | 26.9 | 28.8 | 29.7 | 31.9 | 34.5 | 34.0 | 32.4 |
| LV | Latvia | 10.5 | NA | 12.7 | 12.4 | 11.8 | 7.9 | 11.0 | 12.6 | 15.9 | 10.0 | 10.3 | 10.6 | 7.8 | 7.9 | 6.5 | 10.1 | 13.2 |
| MT | Malta | 13.7 | NA | 15.1 | 17.5 | 17.0 | 4.6 | 9.4 | 4.7 | 1.4 | -0.2 | 4.8 | 12.6 | 15.7 | 19.5 | 19.3 | 18.0 | 19.9 |
| PL | Poland | 24.7 | NA | 24.3 | 22.8 | 23.0 | 20.6 | 24.2 | 25.4 | 25.5 | 24.3 | 25.7 | 27.4 | 26.7 | 26.6 | 24.7 | 24.6 | 24.0 |
| PT | Portugal | 13.1 | NA | 21.7 | 23.7 | 22.0 | -3.4 | 0.8 | 2.6 | 6.8 | 2.4 | 2.7 | 7.2 | 13.0 | 16.6 | 21.4 | 23.0 | 26.3 |
| RO | Romania | -5.1 | NA | -3.1 | -5.2 | -7.0 | -15.5 | -8.4 | -6.1 | -7.3 | -7.7 | -8.6 | -6.1 | -4.2 | -2.6 | -1.9 | -0.8 | -0.4 |
| SE | Sweden | 18.0 | NA | 20.3 | 11.0 | 8.8 | -6.1 | 2.8 | 18.6 | 21.1 | 20.2 | 23.2 | 28.0 | 27.1 | 28.4 | 24.7 | 23.0 | 21.2 |
| SI | Slovenia | 18.0 | NA | 20.4 | 19.9 | 17.5 | -4.7 | 8.2 | 14.5 | 14.9 | 17.5 | 18.6 | 19.6 | 20.2 | 21.6 | 17.1 | 17.9 | 24.4 |
| SK | Slovakia | 24.4 | NA | 19.8 | 16.6 | 15.8 | 22.2 | 25.8 | 26.7 | 25.8 | 26.5 | 27.5 | 29.3 | 28.7 | 29.5 | 26.4 | 22.0 | 18.4 |
| UK | United Kingdom | 22.9 | NA | 22.3 | 22.4 | 21.6 | 12.5 | 19.4 | 26.8 | 25.4 | 24.4 | 24.4 | 24.6 | 25.9 | 24.7 | 23.1 | 22.8 | 23.8 |
icw_sr_01 %>%
  filter(time == "2015") %>%
  select(age, geo, values) %>%
  left_join(geo, by = "geo") %>%
  spread(age, values) %>%
  arrange(Geo) %>%
  select(geo, Geo, TOTAL, everything()) %>%
  mutate(Geo = ifelse(geo == "DE", "Germany", Geo)) %>%
  mutate(Flag = gsub(" ", "-", str_to_lower(Geo)),
         Flag = paste0('<img src="../../bib/flags/vsmall/', Flag, '.png" alt="Flag">')) %>%
  select(Flag, everything()) %>%
  arrange(-`Y65-74`) %>%
{if (is_html_output()) datatable(., filter = 'top', rownames = F, escape = F) else .}icw_sr_01 %>%
filter(time == "2015") %>%
select(age, geo, values) %>%
left_join(geo, by = "geo") %>%
spread(age, values) %>%
arrange(Geo) %>%
select(geo, Geo, TOTAL, everything()) %>%
mutate(Geo = ifelse(geo == "DE", "Germany", Geo)) %>%
mutate(Flag = gsub(" ", "-", str_to_lower(Geo)),
Flag = paste0('<img src="../../bib/flags/vsmall/', Flag, '.png" alt="Flag">')) %>%
select(Flag, everything()) %>%
select(1, 2, 3, 4, 9, 11, 13, 15, 5) %>%
arrange(-`Y60-69`) %>%
{if (is_html_output()) datatable(., filter = 'top', rownames = F, escape = F) else .}icw_sr_01 %>%
filter(time == "2015",
geo %in% c("UK", "FR", "DE", "ES"),
grepl("-", age) | age %in% c("Y_GE75", "Y_LT30")) %>%
mutate(age = ifelse(age == "Y_GE75", "Y75+", age),
age = ifelse(age == "Y_LT30", "Y30-", age)) %>%
mutate(age = ifelse(age == "Y_GE75", "Y75+", age)) %>%
left_join(geo, by = "geo") %>%
left_join(colors, by = c("Geo" = "country")) %>%
mutate(values = values/100) %>%
ggplot + geom_line(aes(x = age, y = values, color = color, group = color)) +
scale_color_identity() + theme_minimal() +
geom_image(data = . %>%
group_by(age) %>%
filter(n() == 4) %>%
arrange(values) %>%
mutate(dist = min(values[2]-values[1],values[3]-values[2],values[4]-values[3])) %>%
arrange(-dist, age) %>%
head(4) %>%
mutate(image = paste0("../../icon/flag/", str_to_lower(gsub(" ", "-", Geo)), ".png")),
aes(x = age, y = values, image = image), asp = 1.5) +
xlab("Age") + ylab("Taux d'épargne médian par âge") +
scale_y_continuous(breaks = 0.01*seq(-30, 50, 5),
labels = percent_format(accuracy = 1),
limits = c(0, 0.5))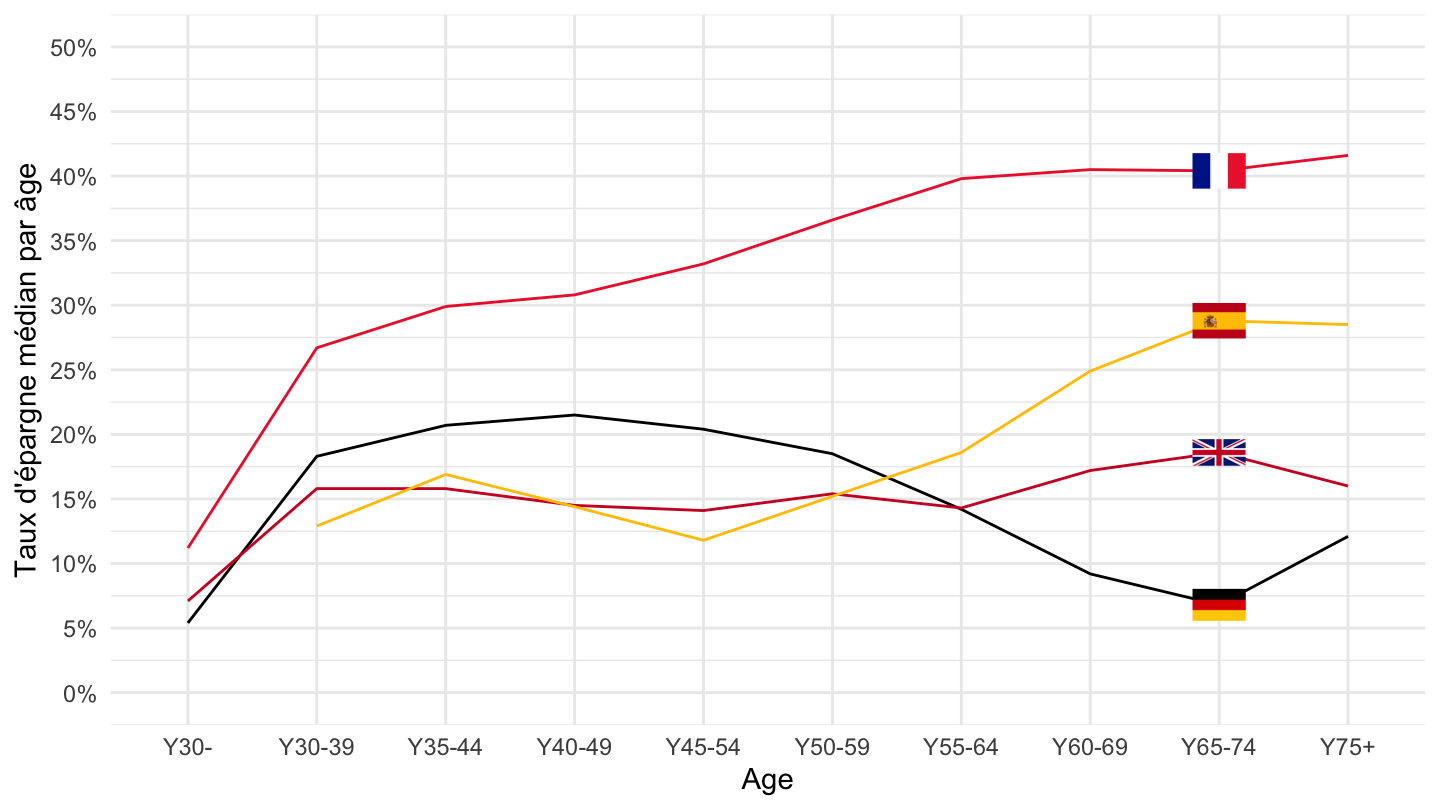
icw_sr_01 %>%
  filter(time == "2015",
         geo %in% c("UK", "FR", "DE"),
         grepl("-", age) | age %in% c("Y_GE75", "Y_LT30")) %>%
  mutate(age = ifelse(age == "Y_GE75", "Y75+", age),
         age = ifelse(age == "Y_LT30", "Y30-", age)) %>%
  mutate(age = ifelse(age == "Y_GE75", "Y75+", age)) %>%
  left_join(geo, by = "geo") %>%
  left_join(colors, by = c("Geo" = "country")) %>%
  mutate(values = values/100) %>%
  ggplot + geom_line(aes(x = age, y = values, color = color, group = color)) +
  scale_color_identity() + theme_minimal() +
  geom_image(data = . %>%
               group_by(age) %>%
               filter(n() == 3) %>%
               arrange(values) %>%
               mutate(dist = min(values[2]-values[1],values[3]-values[2])) %>%
               arrange(-dist, age) %>%
               head(3) %>%
               mutate(image = paste0("../../icon/flag/", str_to_lower(gsub(" ", "-", Geo)), ".png")),
             aes(x = age, y = values, image = image), asp = 1.5) +
  xlab("Age") + ylab("Median saving rate by age of the reference person") +
  scale_y_continuous(breaks = 0.01*seq(-30, 50, 5),
                     labels = percent_format(accuracy = 1),
                     limits = c(0, 0.5))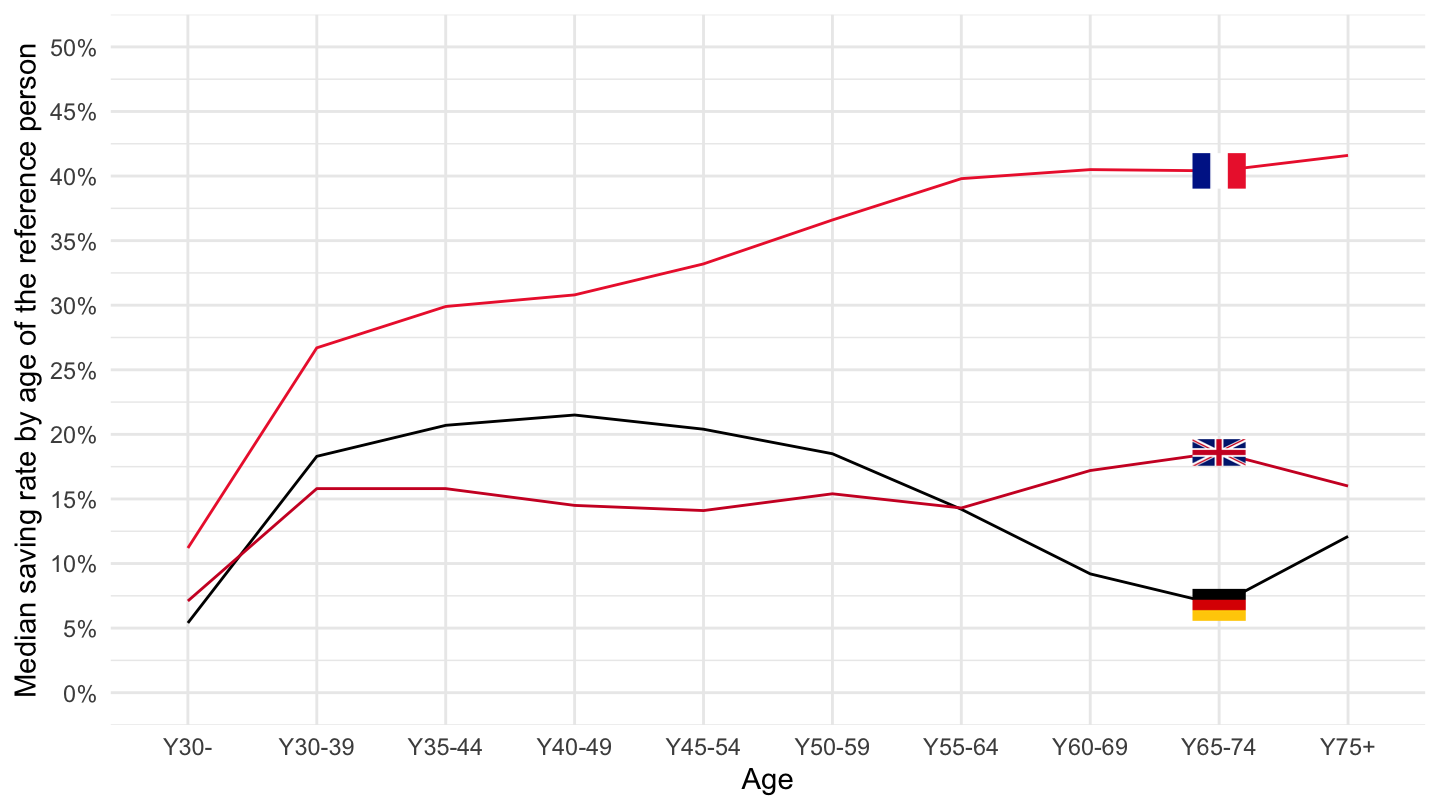
icw_sr_01 %>%
  filter(time == "2015",
         geo %in% c("UK", "ES", "PT"),
         grepl("-", age) | age %in% c("Y_GE75", "Y_LT30")) %>%
  mutate(age = ifelse(age == "Y_GE75", "Y75+", age),
         age = ifelse(age == "Y_LT30", "Y30-", age)) %>%
  left_join(geo, by = "geo") %>%
  left_join(colors, by = c("Geo" = "country")) %>%
  mutate(values = values/100) %>%
  ggplot + geom_line(aes(x = age, y = values, color = color, group = color)) +
  scale_color_identity() + theme_minimal() +
  geom_image(data = . %>%
               group_by(age) %>%
               filter(n() == 3) %>%
               arrange(values) %>%
               mutate(dist = min(values[2]-values[1],values[3]-values[2])) %>%
               arrange(-dist, age) %>%
               head(3) %>%
               mutate(image = paste0("../../icon/flag/", str_to_lower(gsub(" ", "-", Geo)), ".png")),
             aes(x = age, y = values, image = image), asp = 1.5) +
  xlab("Age") + ylab("Median saving rate by age of the reference person") +
  scale_y_continuous(breaks = 0.01*seq(-30, 50, 5),
                     labels = percent_format(accuracy = 1))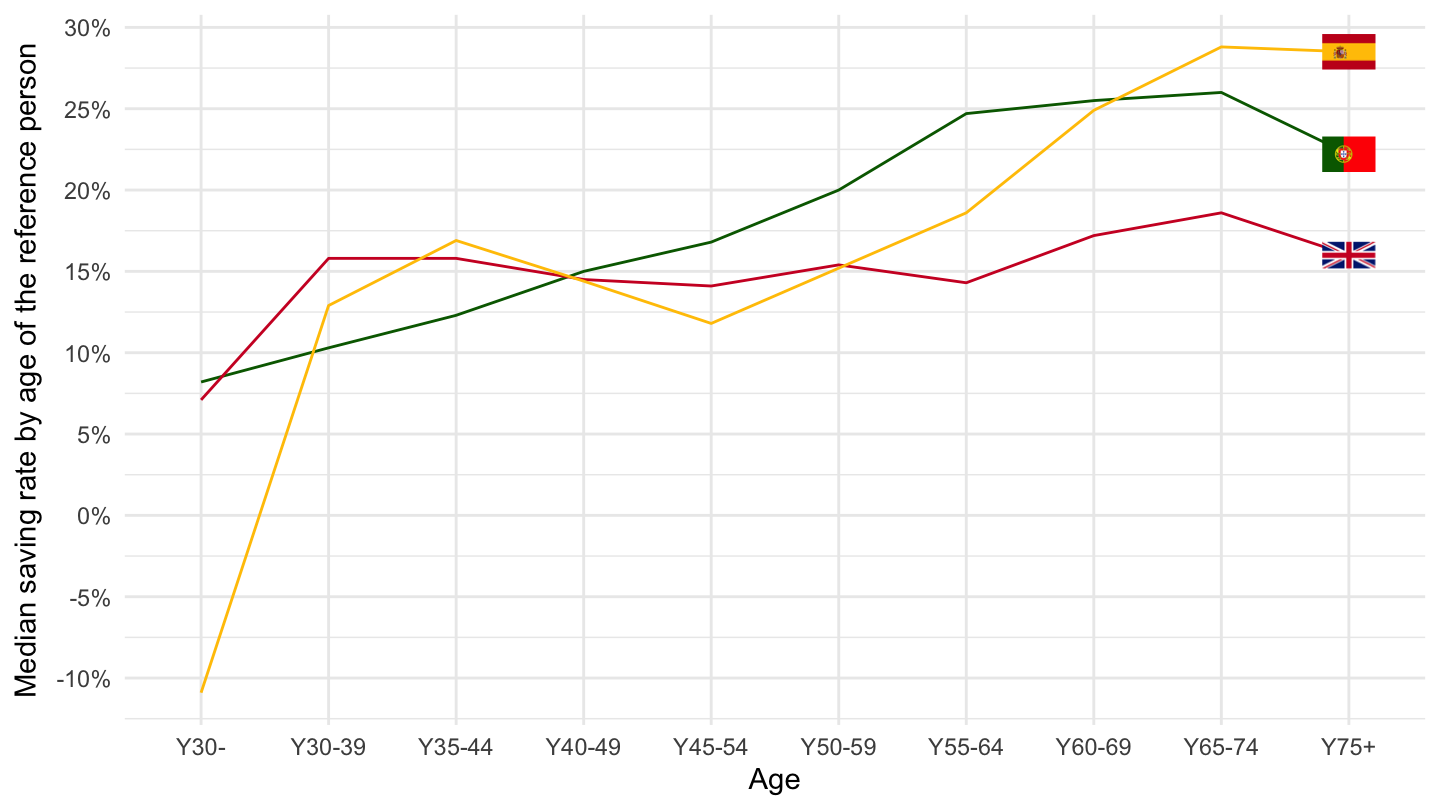
icw_sr_01 %>%
  filter(time == "2015",
         geo %in% c("AT", "BE", "BG"),
         grepl("-", age) | age %in% c("Y_GE75", "Y_LT30")) %>%
  mutate(age = ifelse(age == "Y_GE75", "Y75+", age),
         age = ifelse(age == "Y_LT30", "Y30-", age)) %>%
  mutate(age = ifelse(age == "Y_GE75", "Y75+", age)) %>%
  left_join(geo, by = "geo") %>%
  left_join(colors, by = c("Geo" = "country")) %>%
  mutate(values = values/100) %>%
  ggplot + geom_line(aes(x = age, y = values, color = color, group = color)) +
  scale_color_identity() + theme_minimal() +
  geom_image(data = . %>%
               group_by(age) %>%
               filter(n() == 3) %>%
               arrange(values) %>%
               mutate(dist = min(values[2]-values[1],values[3]-values[2])) %>%
               arrange(-dist, age) %>%
               head(3) %>%
               mutate(image = paste0("../../icon/flag/", str_to_lower(gsub(" ", "-", Geo)), ".png")),
             aes(x = age, y = values, image = image), asp = 1.5) +
  xlab("Age") + ylab("Median saving rate by age of the reference person") +
  scale_y_continuous(breaks = 0.01*seq(-30, 50, 5),
                     labels = percent_format(accuracy = 1))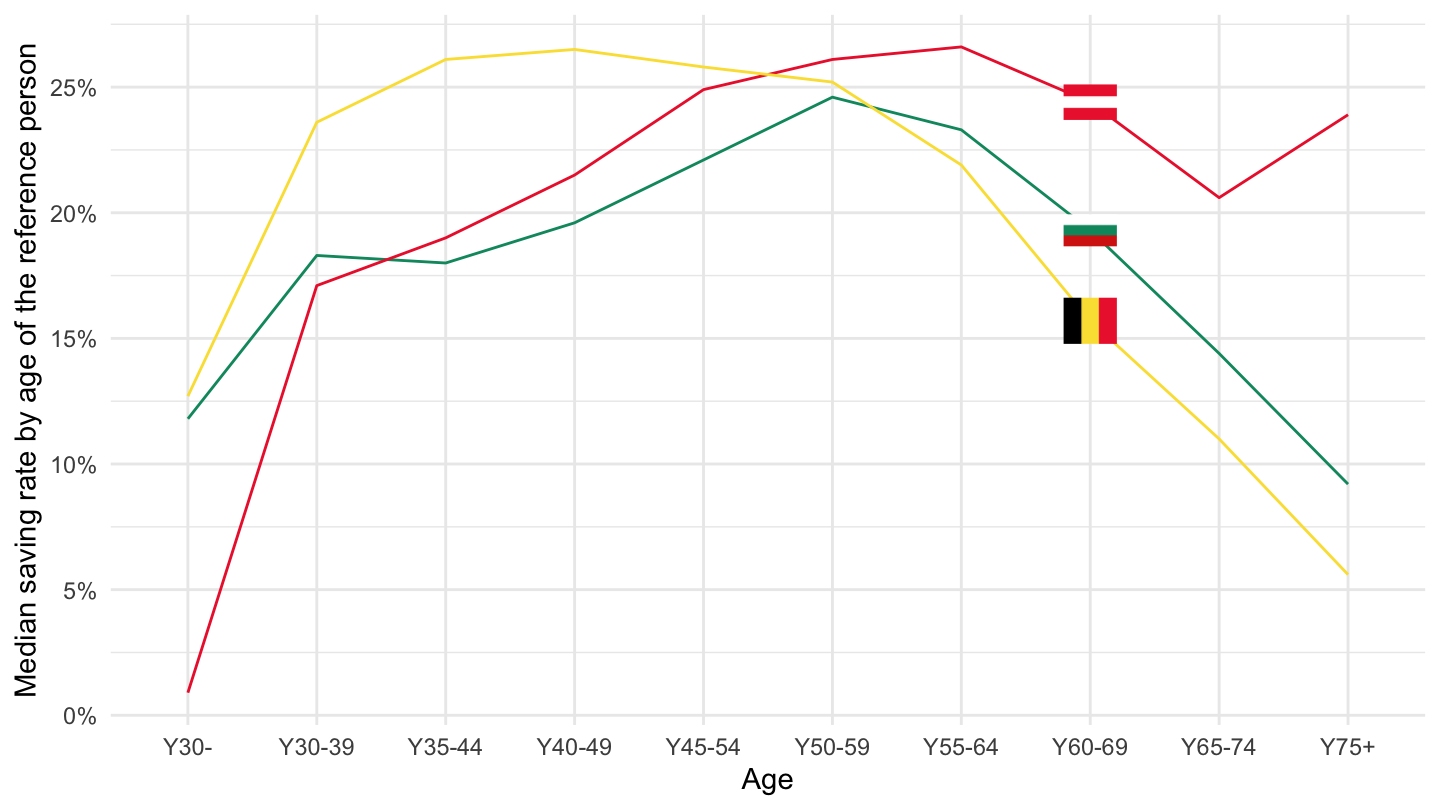
icw_sr_01 %>%
  filter(time == "2015",
         geo %in% c("EE", "ES", "HR"),
         grepl("-", age) | age %in% c("Y_GE75", "Y_LT30")) %>%
  mutate(age = ifelse(age == "Y_GE75", "Y75+", age),
         age = ifelse(age == "Y_LT30", "Y30-", age)) %>%
  mutate(age = ifelse(age == "Y_GE75", "Y75+", age)) %>%
  left_join(geo, by = "geo") %>%
  left_join(colors, by = c("Geo" = "country")) %>%
  mutate(values = values/100) %>%
  ggplot + geom_line(aes(x = age, y = values, color = color, group = color)) +
  scale_color_identity() + theme_minimal() +
  geom_image(data = . %>%
               group_by(age) %>%
               filter(n() == 3) %>%
               arrange(values) %>%
               mutate(dist = min(values[2]-values[1],values[3]-values[2])) %>%
               arrange(-dist, age) %>%
               head(3) %>%
               mutate(image = paste0("../../icon/flag/", str_to_lower(gsub(" ", "-", Geo)), ".png")),
             aes(x = age, y = values, image = image), asp = 1.5) +
  xlab("Age") + ylab("Median saving rate by age of the reference person") +
  scale_y_continuous(breaks = 0.01*seq(-30, 50, 5),
                     labels = percent_format(accuracy = 1))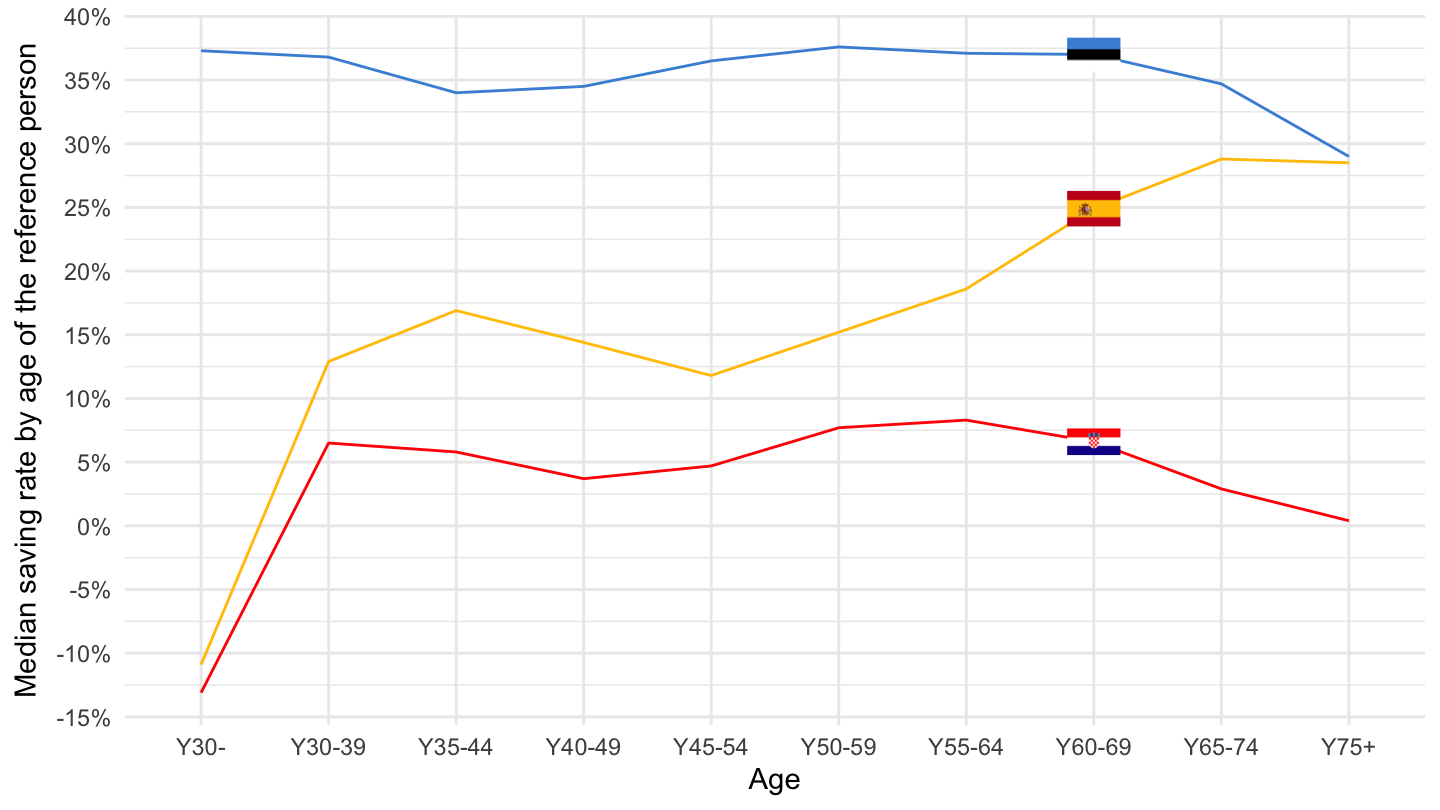
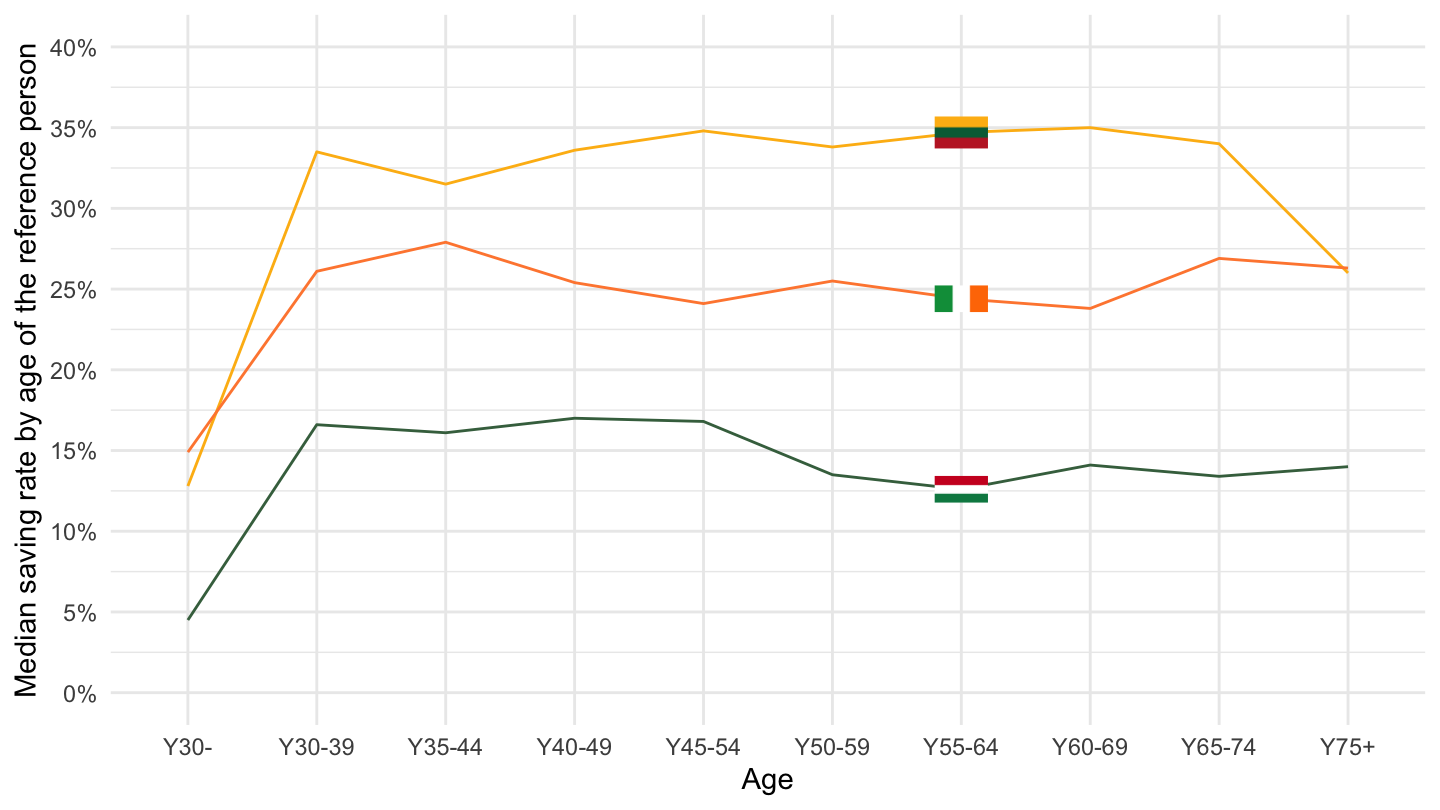
icw_sr_01 %>%
  filter(time == "2015",
         geo %in% c("HU", "IE", "LT"),
         grepl("-", age) | age %in% c("Y_GE75", "Y_LT30")) %>%
  mutate(age = ifelse(age == "Y_GE75", "Y75+", age),
         age = ifelse(age == "Y_LT30", "Y30-", age)) %>%
  mutate(age = ifelse(age == "Y_GE75", "Y75+", age)) %>%
  left_join(geo, by = "geo") %>%
  left_join(colors, by = c("Geo" = "country")) %>%
  mutate(values = values/100) %>%
  ggplot + geom_line(aes(x = age, y = values, color = color, group = color)) +
  scale_color_identity() + theme_minimal() +
  geom_image(data = . %>%
               group_by(age) %>%
               filter(n() == 3) %>%
               arrange(values) %>%
               mutate(dist = min(values[2]-values[1],values[3]-values[2])) %>%
               arrange(-dist, age) %>%
               head(3) %>%
               mutate(image = paste0("../../icon/flag/", str_to_lower(gsub(" ", "-", Geo)), ".png")),
             aes(x = age, y = values, image = image), asp = 1.5) +
  xlab("Age") + ylab("Median saving rate by age of the reference person") +
  scale_y_continuous(breaks = 0.01*seq(-30, 50, 5),
                     labels = percent_format(accuracy = 1),
                     limits = c(0, 0.4))