
Last observation: 2025 (N = 222)
First observation: 1960 (N = 45)
Last data update: 09 sept. 2026, 07:48
Last compile: 04 oct. 2026, 23:16
latest_y_phys <- hlth_rs_prs2 |>
  filter(unit == "P_HTHAB",
         wstatus == "PRACT",
         med_spec == "PHYS",
         nchar(geo) == 2,
         !is.na(values)) |>
  summarise(m = max(time)) |>
  pull(m)

hlth_rs_prs2 |>
  filter(time == latest_y_phys,
         nchar(geo) == 2,
         unit == "P_HTHAB",
         wstatus == "PRACT",
         med_spec == "PHYS") |>
  select(geo, Geo, physicians_per_100k = values) %>%
{if (is_html_output()) datatable(., filter = 'top', rownames = F) else .}hlth_rs_prs2 |>
filter(geo %in% c("FR", "DE", "ES", "IT"),
unit == "P_HTHAB",
wstatus == "PRACT",
med_spec == "PHYS") |>
year_to_date() |>
add_flag_color("Geo") |>
ggplot() + geom_line(aes(x = date, y = values, color = color)) +
theme_minimal() + scale_color_identity() + add_flags +
scale_x_date(breaks = as.Date(paste0(seq(1980, 2100, 5), "-01-01")),
labels = date_format("%Y")) +
xlab("") + ylab("Practising physicians (per 100,000 inhabitants)")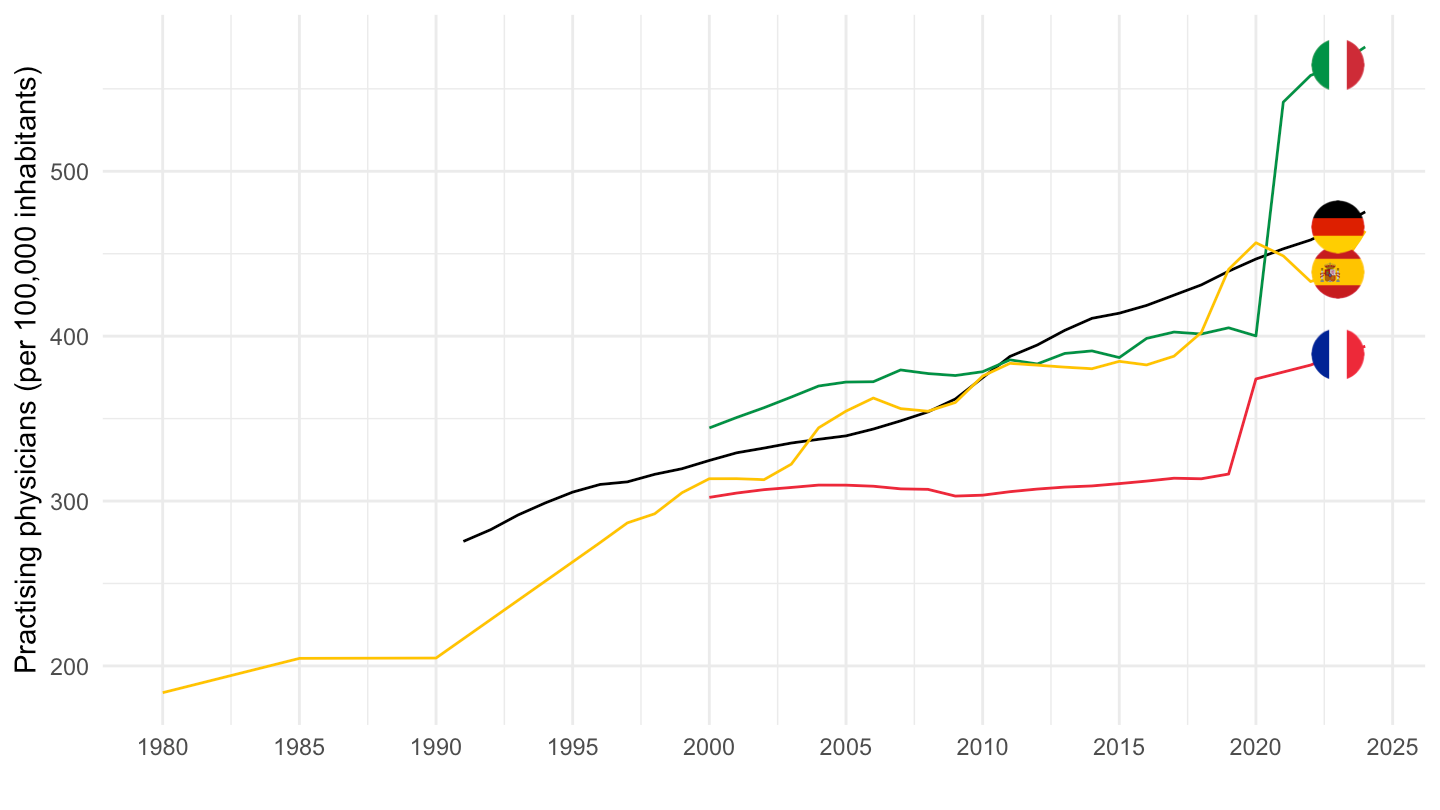
hlth_rs_prs2 |>
  filter(geo == "FR",
         unit == "P_HTHAB",
         wstatus == "PRACT",
         med_spec %in% c("PHYS", "DENT", "PHARM")) |>
  year_to_date() |>
  ggplot() + geom_line(aes(x = date, y = values, color = Med_spec)) +
  theme_minimal() +
  theme(legend.position = c(0.25, 0.85),
        legend.title = element_blank()) +
  scale_x_date(breaks = as.Date(paste0(seq(2000, 2100, 2), "-01-01")),
               labels = date_format("%Y")) +
  xlab("") + ylab("Practising personnel (per 100,000 inhabitants)")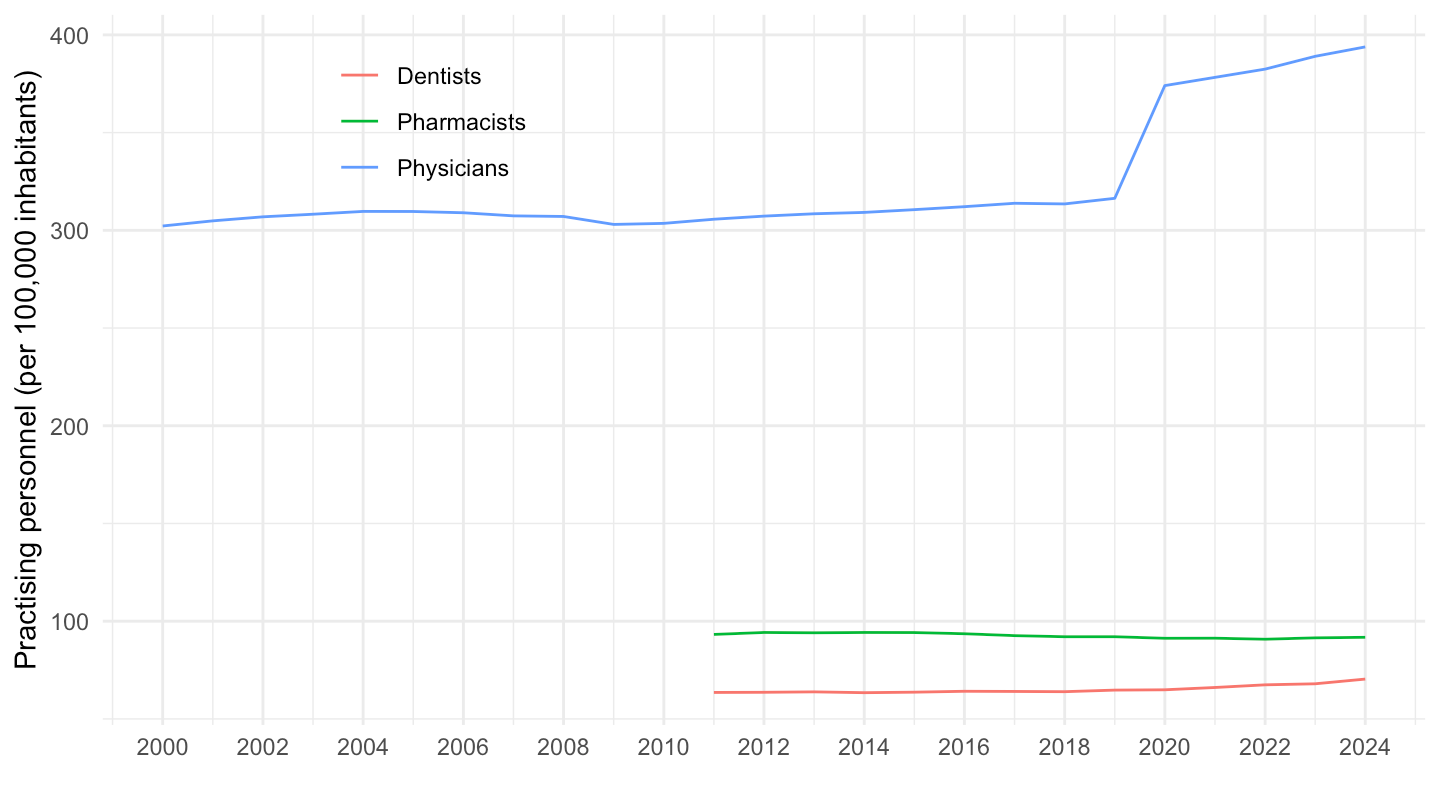
latest_y <- hlth_rs_prs2 |>
  filter(unit == "P_HTHAB",
         wstatus == "PRACT",
         med_spec %in% c("PHYS", "DENT", "NRS"),
         geo %in% c("FR", "DE", "ES", "IT", "EU27_2020"),
         !is.na(values)) |>
  summarise(m = max(time)) |>
  pull(m)

hlth_rs_prs2 |>
  filter(time == latest_y,
         unit == "P_HTHAB",
         wstatus == "PRACT",
         med_spec %in% c("PHYS", "DENT", "NRS"),
         geo %in% c("FR", "DE", "ES", "IT", "EU27_2020")) |>
  select(Geo, Med_spec, values) |>
  spread(Med_spec, values) |>
print_table_conditional()| Geo | Dentists | Nurses (EU recognised qualification) | Physicians |
|---|---|---|---|
| France | 70.39 | NA | 393.85 |
| Germany | 86.19 | 1251.25 | 475.40 |
| Italy | 87.66 | 691.60 | 575.43 |
| Spain | 68.13 | 573.31 | 463.78 |