Hospital beds by NUTS 2 regions - hlth_rs_bdsrg

Data - Eurostat

unit

Code
hlth_rs_bdsrg %>%
  left_join(unit, by = "unit") %>%
  group_by(unit, Unit) %>%
  summarise(Nobs = n()) %>%
  arrange(-Nobs) %>%
  {if (is_html_output()) print_table(.) else .}
unit Unit Nobs
NR Number 32501
P_HTHAB Per hundred thousand inhabitants 30432
HAB_P Inhabitants per ... 26196

facility

Code
hlth_rs_bdsrg %>%
  left_join(facility, by = "facility") %>%
  group_by(facility, Facility) %>%
  summarise(Nobs = n()) %>%
  arrange(-Nobs) %>%
  {if (is_html_output()) print_table(.) else .}
facility Facility Nobs
HBEDT Available beds in hospitals (HP.1) 23402
HBEDT_CUR Curative care beds in hospitals (HP.1) 16681
HBEDI_PSY Psychiatric care beds in hospitals (HP.1) 16354
HBEDT_LT Long-term care beds in hospitals (HP.1) 12295
HBEDT_REH Rehabilitative care beds in hospitals (HP.1) 10321
HBEDT_OTH Other beds in hospitals (HP.1) 10076

geo

Code
hlth_rs_bdsrg %>%
  left_join(geo, by = "geo") %>%
  group_by(geo, Geo) %>%
  summarise(Nobs = n()) %>%
  arrange(-Nobs) %>%
  {if (is_html_output()) datatable(., filter = 'top', rownames = F) else .}

Ex 1: Hospital Care Beds

Code
hlth_rs_bdsrg %>%
  filter(time == "2015", 
         nchar(geo) == 4,
         facility == "HBEDT_CUR") %>%
  left_join(geo, by = "geo") %>%
  select(geo, Geo, hospital_care = values) %>%
  {if (is_html_output()) datatable(., filter = 'top', rownames = F) else .}

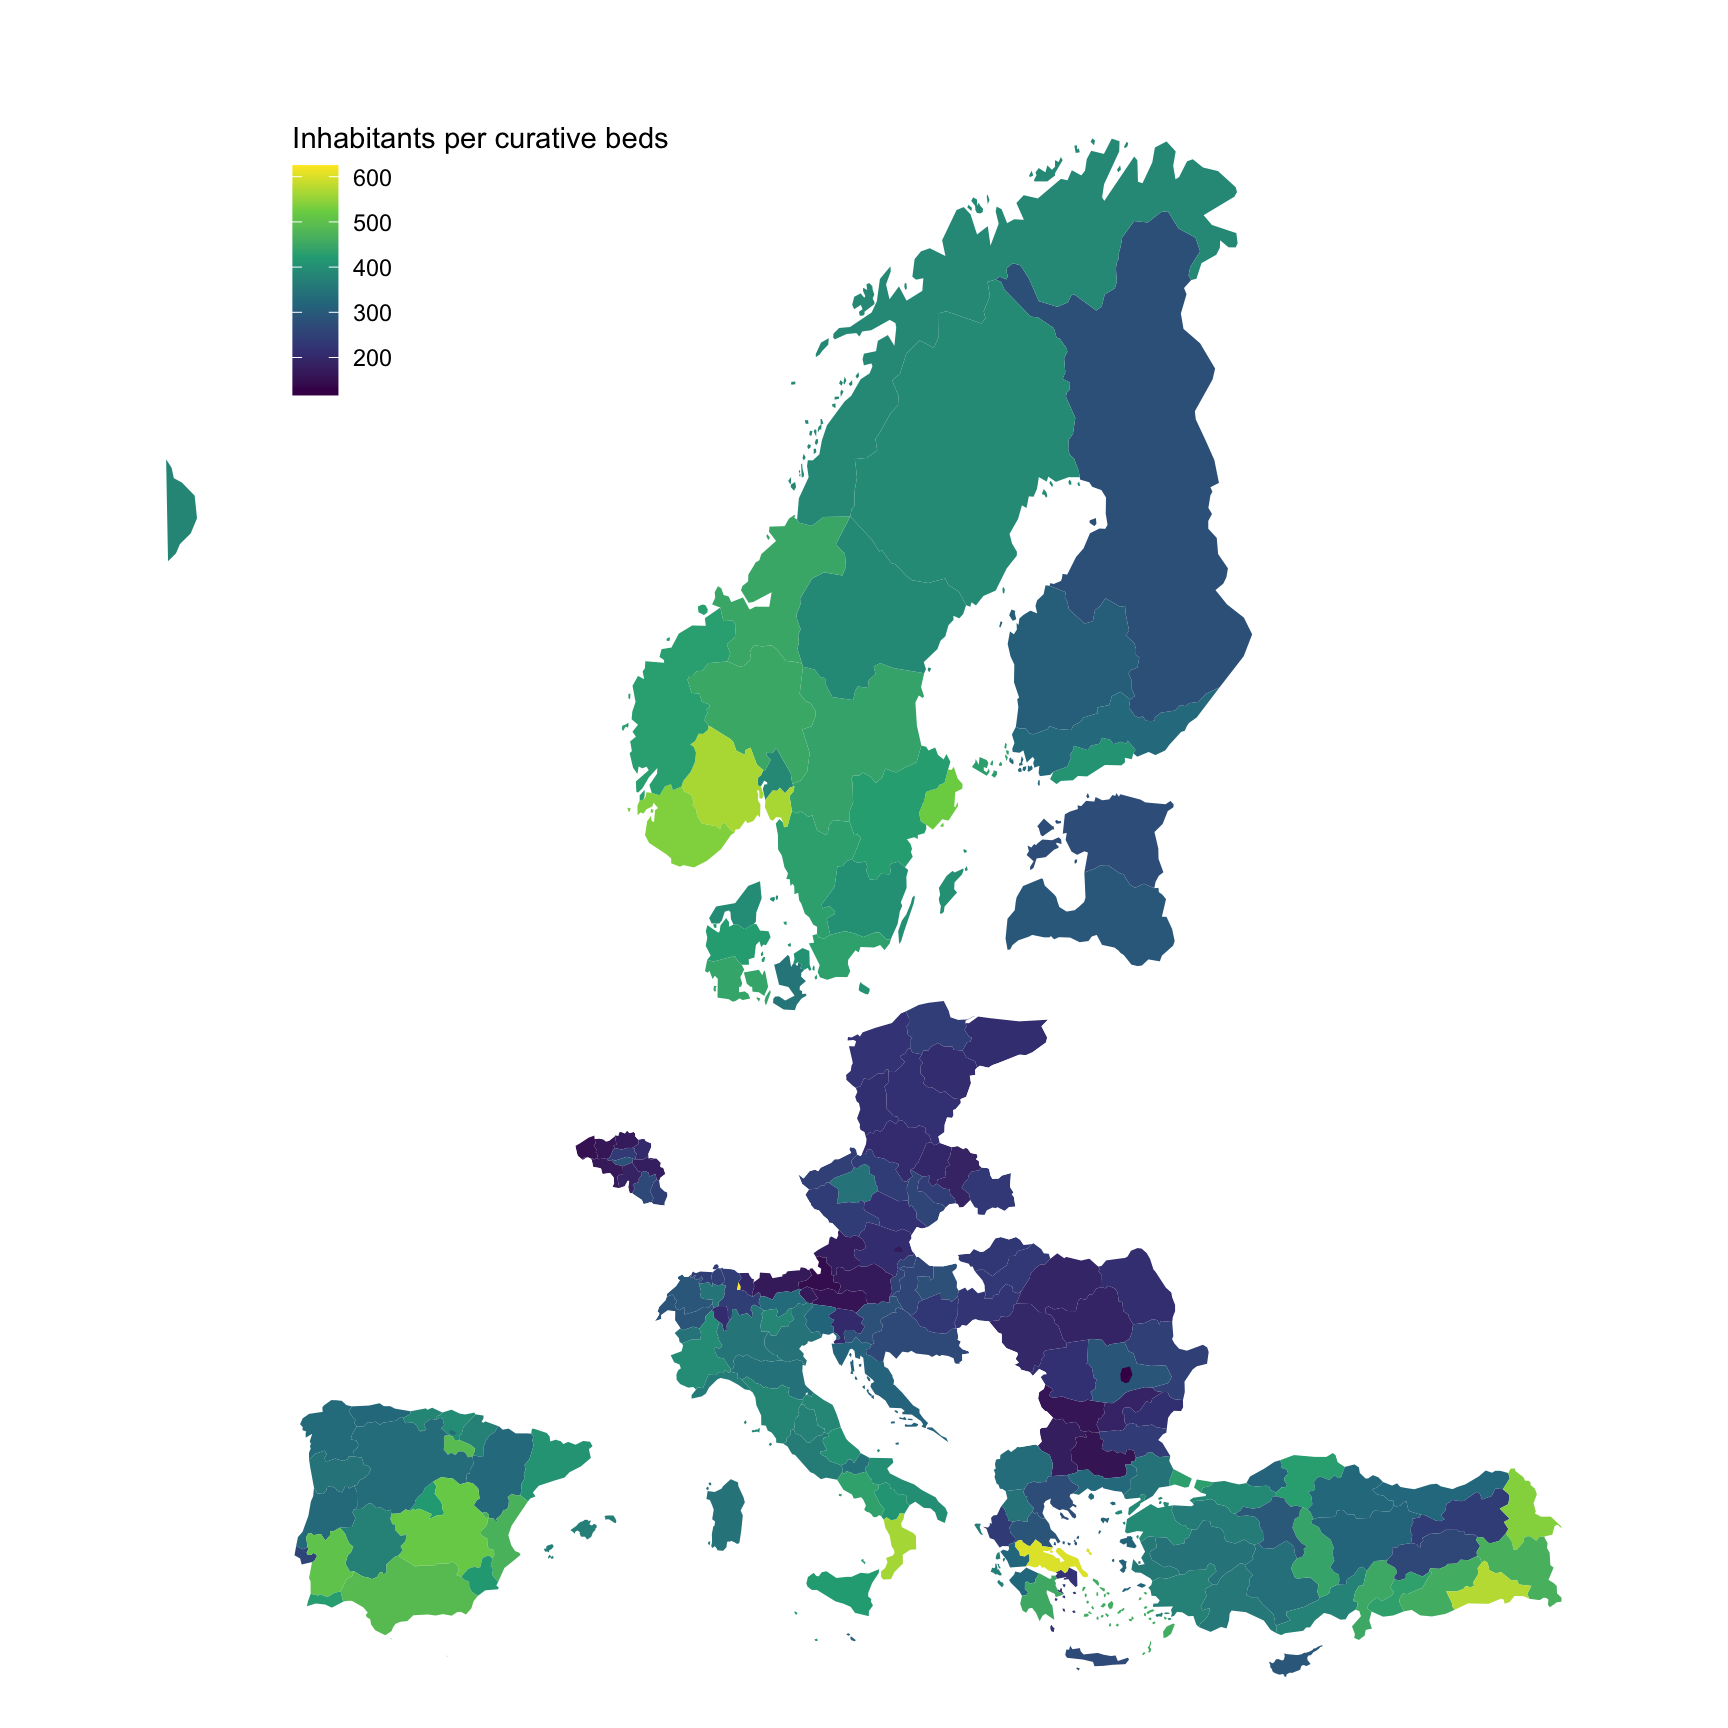
Ex 2: Hospital Care Beds - NUTS2

Code
hlth_rs_bdsrg %>%
  filter(time == "2015", 
         nchar(geo) == 4,
         facility == "HBEDT_CUR",
         unit == "HAB_P") %>%
  left_join(geo, by = "geo") %>%
  select(geo, Geo, values) %>%
  arrange(-values) %>%
  right_join(europe_NUTS2, by = "geo") %>%
  filter(long >= -15, lat >= 33) %>%
  ggplot(., aes(x = long, y = lat, group = group, fill = values)) +
  geom_polygon() + coord_map() +
  scale_fill_viridis_c(na.value = "white",
                       labels = scales::dollar_format(accuracy = 1, prefix = ""),) +
  theme_void() + theme(legend.position = c(0.25, 0.85)) + 
  labs(fill = "Inhabitants per curative beds")
Ex 2: Available Beds - NUTS2

Code
hlth_rs_bdsrg %>%
  filter(time == "2015", 
         nchar(geo) == 4,
         facility == "HBEDT",
         unit == "HAB_P") %>%
  left_join(geo, by = "geo") %>%
  select(geo, Geo, values) %>%
  arrange(-values) %>%
  right_join(europe_NUTS2, by = "geo") %>%
  filter(long >= -15, lat >= 33) %>%
  ggplot(., aes(x = long, y = lat, group = group, fill = values)) +
  geom_polygon() + coord_map() +
  scale_fill_viridis_c(na.value = "white",
                       labels = scales::dollar_format(accuracy = 1, prefix = ""),) +
  theme_void() + theme(legend.position = c(0.25, 0.85)) + 
  labs(fill = "Inhabitants per available beds")