Last observation: 2010 (N = 380517)
First observation: 1994 (N = 249030)
Last data update: 09 sept. 2026, 07:41
Last compile: 09 oct. 2026, 22:22
hlth_cd_acdr |>
  filter(geo %in% c("FR", "DE", "IT", "ES"),
         age == "TOTAL",
         sex == "T",
         icd10 == "I") |>
  year_to_date() |>
  add_flag_color("Geo") |>
  ggplot() + geom_line(aes(x = date, y = values, color = color)) +
  theme_minimal() + scale_color_identity() + add_flags +
  scale_x_date(breaks = as.Date(paste0(seq(1990, 2100, 2), "-01-01")),
               labels = date_format("%Y")) +
  xlab("") + ylab("Diseases of the circulatory system (crude death rate per 100,000)")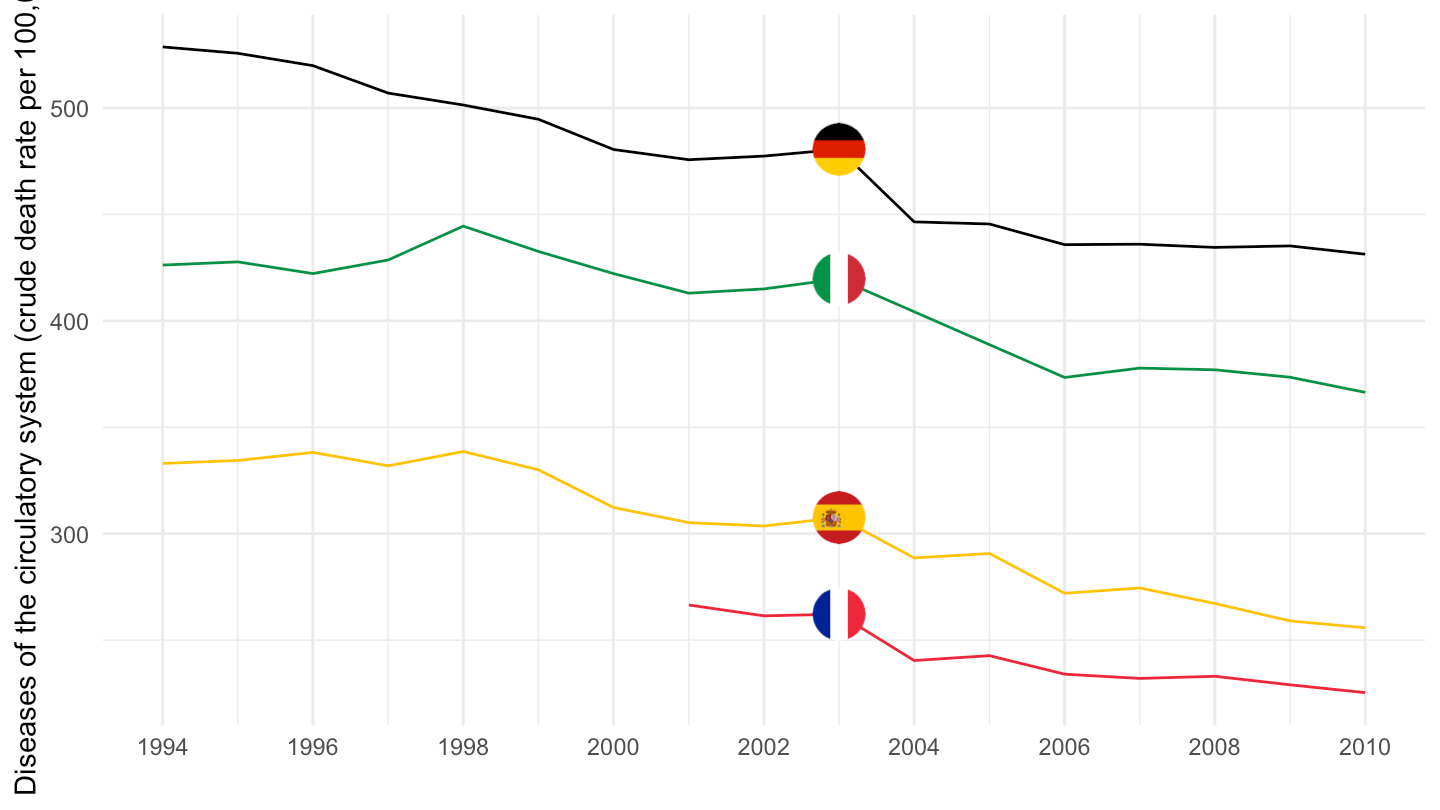
hlth_cd_acdr |>
  filter(geo == "FR",
         age == "TOTAL",
         sex == "T",
         icd10 %in% c("I", "C", "J", "K")) |>
  year_to_date() |>
  ggplot() + geom_line(aes(x = date, y = values, color = Icd10)) +
  theme_minimal() +
  scale_x_date(breaks = as.Date(paste0(seq(1990, 2100, 2), "-01-01")),
               labels = date_format("%Y")) +
  theme(legend.position = "right", legend.title = element_blank()) +
  xlab("") + ylab("Crude death rate per 100,000")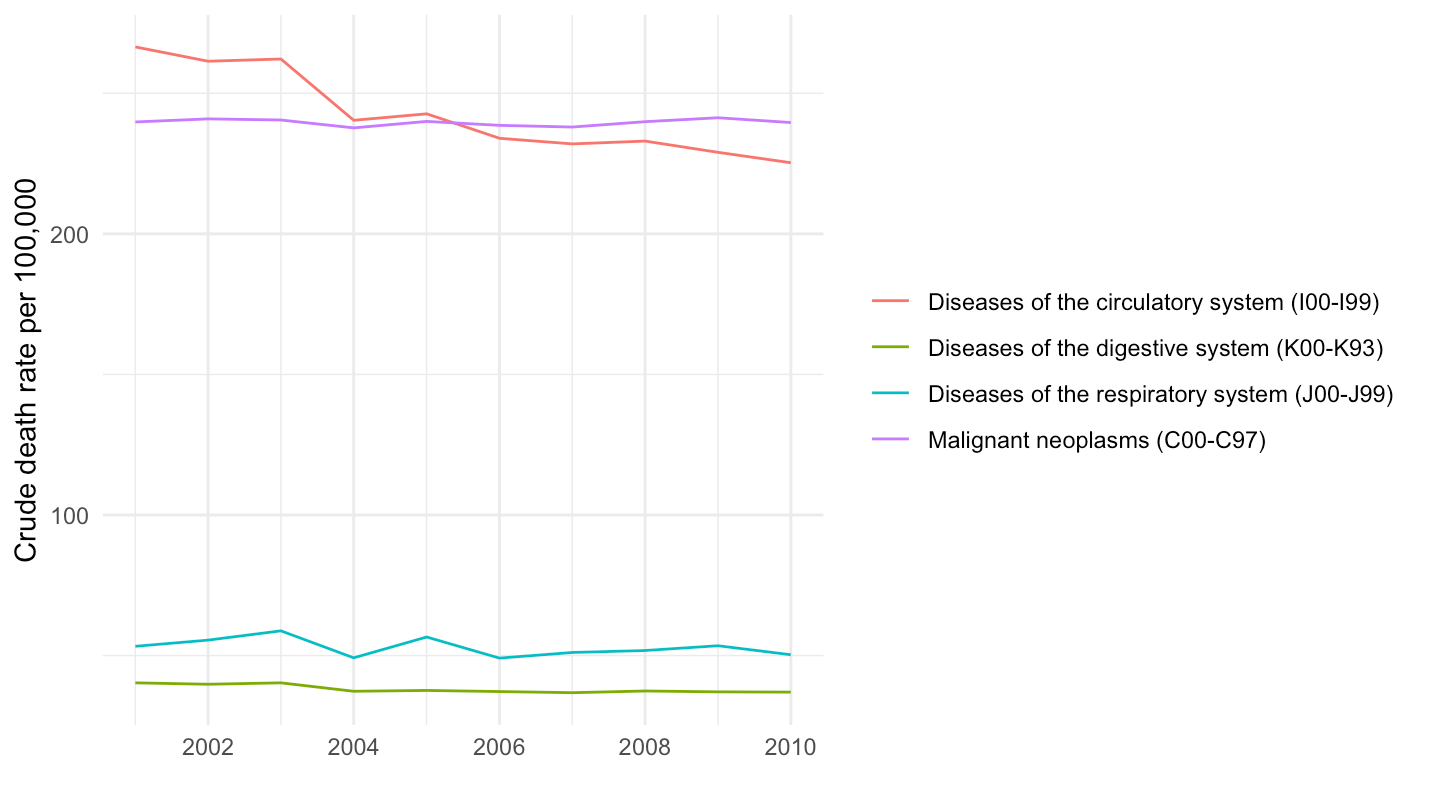
latest_y <- hlth_cd_acdr |>
  filter(geo %in% c("FR", "DE", "IT", "ES"),
         age == "TOTAL",
         sex == "T",
         icd10 == "A-R_V-Y",
         !is.na(values)) |>
  summarise(m = max(time)) |>
  pull(m)

hlth_cd_acdr |>
  filter(geo %in% c("FR", "DE", "IT", "ES"),
         age == "TOTAL",
         sex == "T",
         icd10 %in% c("A-R_V-Y", "C", "I", "J", "K"),
         time == latest_y) |>
  select(Icd10, Geo, values) |>
  spread(Geo, values) |>
print_table_conditional()| Icd10 | France | Germany | Italy | Spain |
|---|---|---|---|---|
| All causes of death (A00-Y89) excluding S00-T98 | 852.4 | 1050.1 | 966.6 | 820.3 |
| Diseases of the circulatory system (I00-I99) | 225.3 | 431.3 | 366.4 | 255.8 |
| Diseases of the digestive system (K00-K93) | 37.0 | 52.2 | 39.4 | 41.0 |
| Diseases of the respiratory system (J00-J99) | 50.3 | 74.0 | 64.1 | 86.5 |
| Malignant neoplasms (C00-C97) | 239.6 | 267.7 | 276.5 | 221.8 |
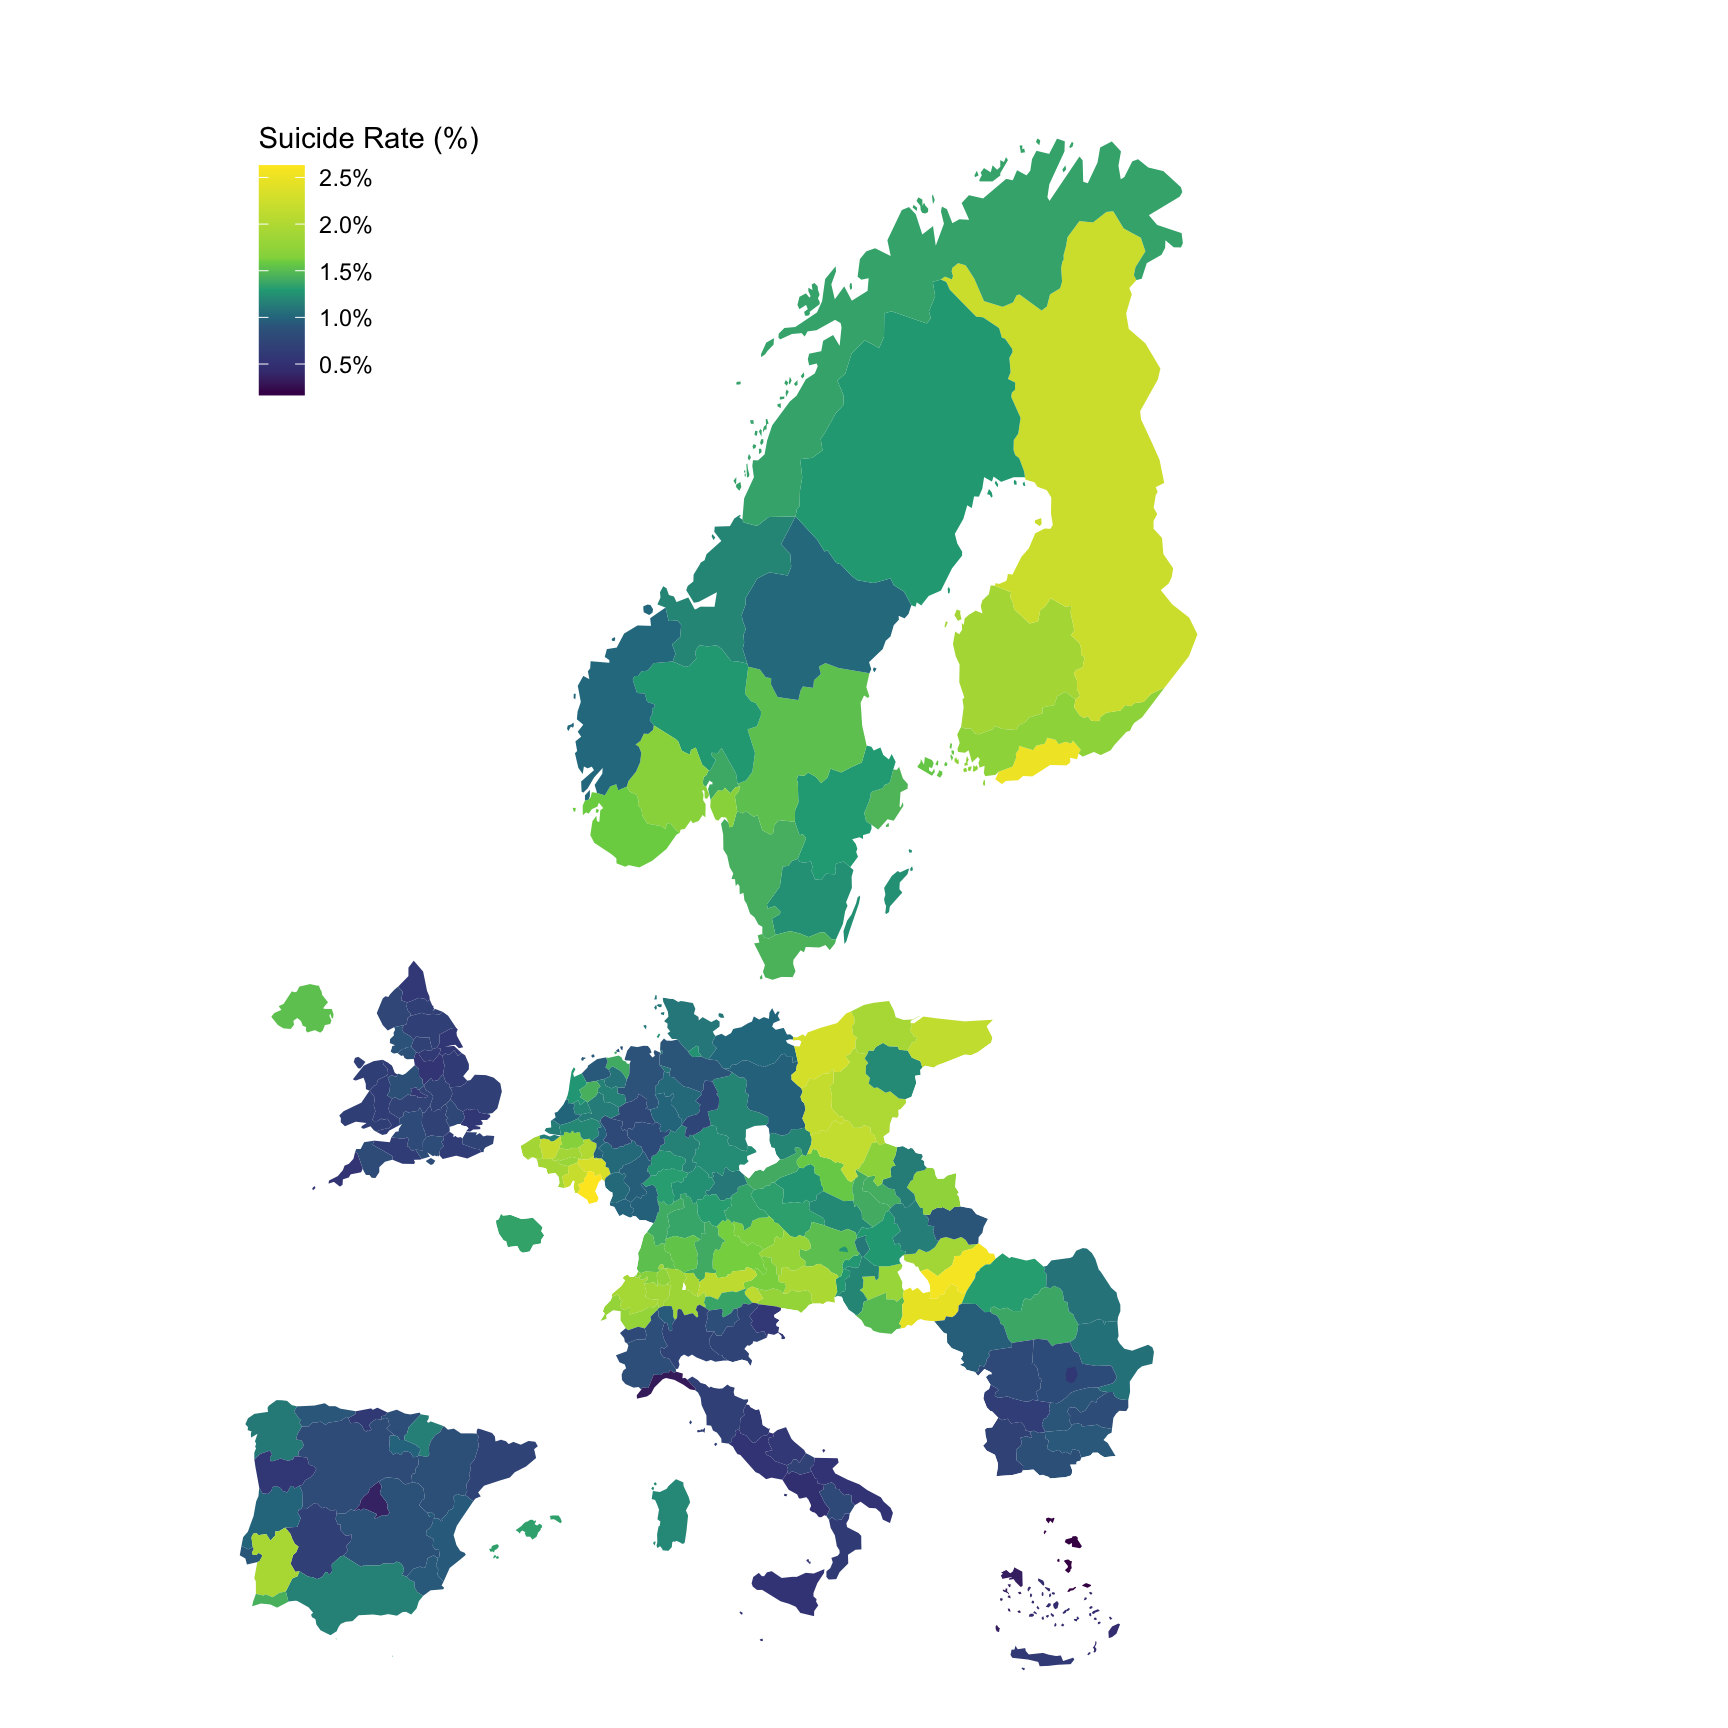
hlth_cd_acdr |>
  filter(time == "2009",
         age == "TOTAL",
         sex == "T",
         icd10 %in% c("X60-X84_Y870", "A-R_V-Y")) |>

  select(geo, Geo, icd10, values) |>
  spread(icd10, values) |>
  right_join(europe_NUTS2, by = "geo") |>
  filter(long >= -13.5, lat >= 33) |>
  ggplot(aes(x = long, y = lat, group = group, fill = `X60-X84_Y870`/`A-R_V-Y`)) +
  geom_polygon() + coord_map() +
  scale_fill_viridis_c(na.value = "white",
                       labels = scales::percent_format(accuracy = .1),
                       breaks = 0.01*seq(0, 100, 0.5),
                       values = c(0, 0.1, 0.3, 0.4, 0.5, 0.6, 1)) +
  theme_void() + theme(legend.position = c(0.15, 0.85)) +
  labs(fill = "Suicide Rate (%)")