Last observation: juil. 2026 (N = 3660)
First observation: janv. 2002 (N = 14994)
Last data update: 17 sept. 2026, 23:16
Last compile: 15 oct. 2026, 23:11
ext_st_27_2020msbec |>
  filter(stk_flow == "EXP",
         indic_et == "TRD_VAL",
         partner == "WORLD",
         bclas_bec == "TOTAL",
         geo %in% c("FR", "DE", "IT")) |>
  month_to_date() |>

  add_flag_color("Geo") |>
  ggplot() + geom_line(aes(x = date, y = values, color = color)) +
  theme_minimal() + scale_color_identity() + add_flags +
  scale_y_log10(breaks = 10000*c(1, 2, 3, 5, 8, 10, 20)) + xlab("") + ylab("")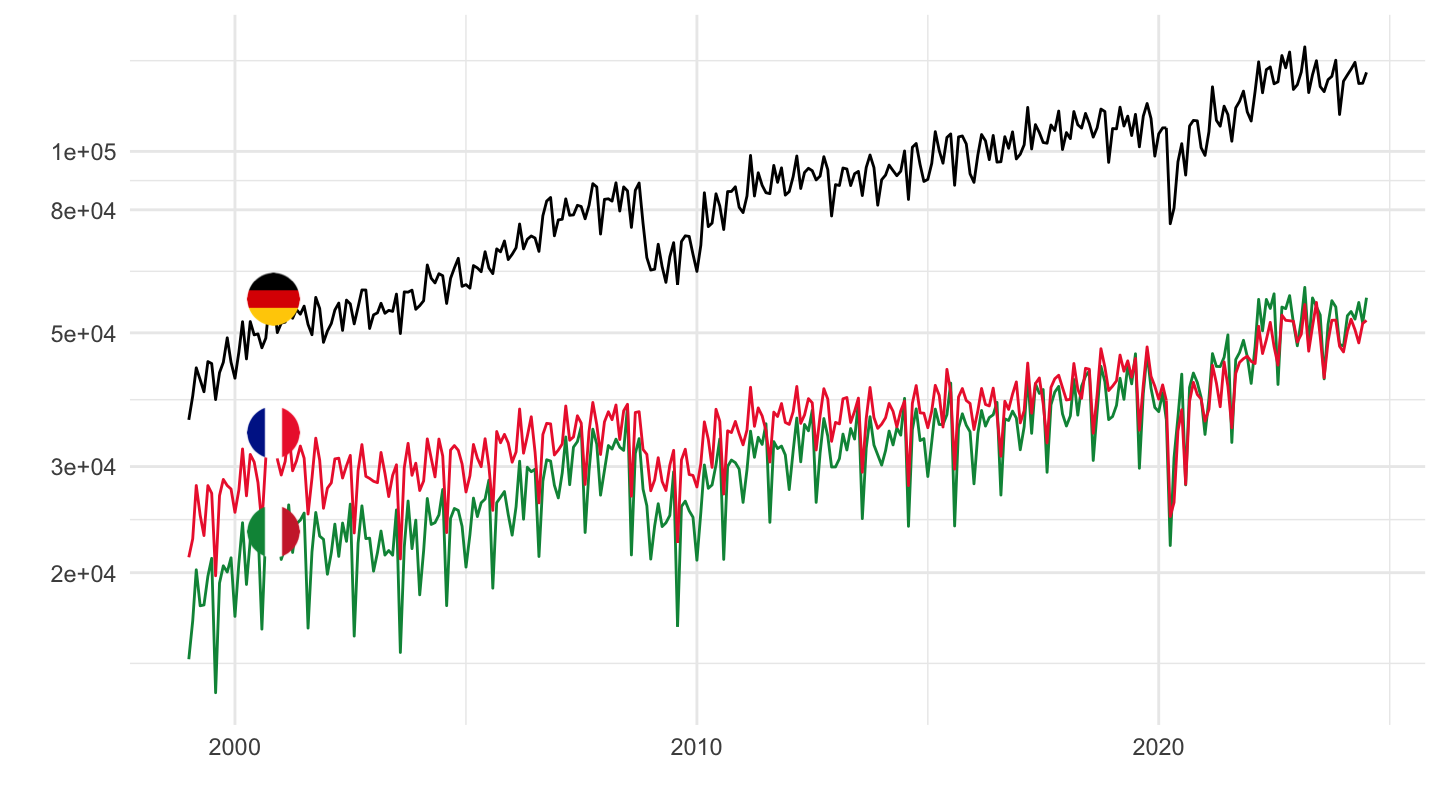
ext_st_27_2020msbec |>
  filter(stk_flow == "BAL_RT",
         indic_et == "TRD_VAL",
         partner == "WORLD",
         bclas_bec == "TOTAL",
         geo %in% c("FR", "DE", "IT")) |>
  month_to_date() |>

  add_flag_color("Geo") |>
  ggplot() + geom_line(aes(x = date, y = values, color = color)) +
  theme_minimal() + scale_color_identity() + add_flags +
  scale_y_continuous(breaks = 1000*seq(-20, 60, 5)) + xlab("") + ylab("")
ext_st_27_2020msbec |>
  filter(stk_flow == "BAL_RT",
         indic_et == "TRD_VAL",
         partner == "WORLD",
         bclas_bec == "TOTAL",
         geo %in% c("FR", "DE", "IT")) |>
  month_to_date() |>
  filter(date >= ymd("2015-01-01")) |>

  add_flag_color("Geo") |>
  ggplot() + geom_line(aes(x = date, y = values, color = color)) +
  theme_minimal() + scale_color_identity() + add_flags +
  scale_y_continuous(breaks = 1000*seq(-20, 60, 5)) + xlab("") + ylab("") +
  scale_x_date(breaks = "1 year",
               labels = date_format("%Y"))
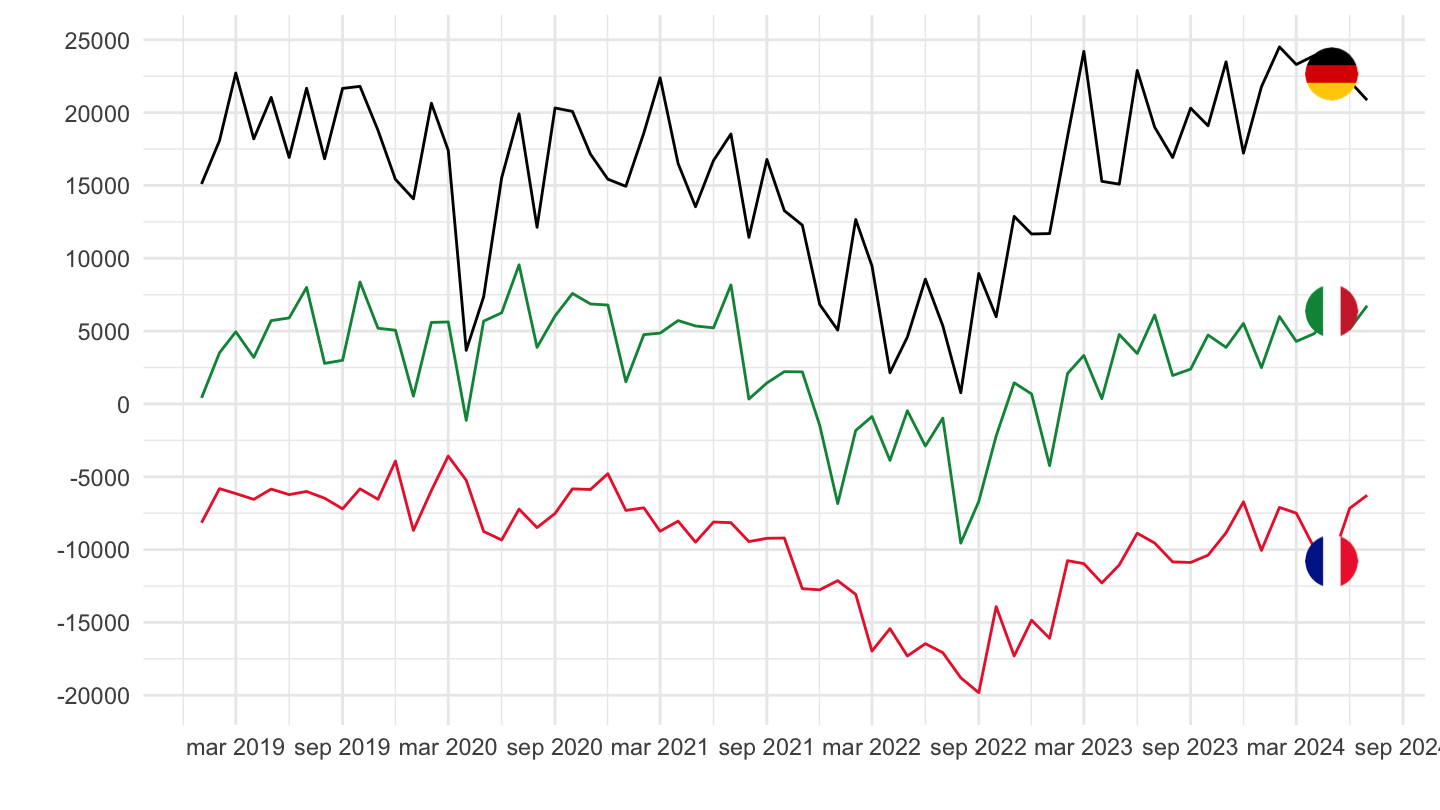
ext_st_27_2020msbec |>
  filter(stk_flow == "BAL_RT",
         indic_et == "TRD_VAL",
         partner == "WORLD",
         bclas_bec == "TOTAL",
         geo %in% c("FR", "DE", "IT")) |>
  month_to_date() |>
  filter(date >= ymd("2019-01-01")) |>

  add_flag_color("Geo") |>
  ggplot() + geom_line(aes(x = date, y = values, color = color)) +
  theme_minimal() + scale_color_identity() + add_flags +
  scale_y_continuous(breaks = 1000*seq(-20, 60, 5)) + xlab("") + ylab("") +
  scale_x_date(breaks = "6 months",
               labels = date_format("%b %Y"))