Share of European Union EU27 (from 2020) in the World Trade - ext_lt_introeu27_2020
Data - Eurostat
Info
Last observation: Annual: 2025 (N = 432)
First observation: Annual: 2002 (N = 576)
Last data update: 23 jul 2026, 22:47. Last compile: 24 jul 2026, 01:37
Structure
Exports
Code
ext_lt_introeu27_2020 %>%
  filter(geo %in% c("EU27_2020", "CN_X_HK", "US"),
         # B1GQ: Gross domestic product at market prices
         indic_et == "PC_EXP_WRL",
         sitc06 == "TOTAL") %>%

  mutate(Geo = ifelse(geo == "CN_X_HK", "China", Geo)) %>%
  mutate(Geo = ifelse(geo == "EU27_2020", "Europe", Geo)) %>%
  year_to_date %>%
  left_join(colors, by = c("Geo" = "country")) %>%
  mutate(values = values/100) %>%
  ggplot + geom_line(aes(x = date, y = values, color = color)) +
  scale_color_identity() + theme_minimal()  + add_3flags + xlab("") + ylab("% of World Exports") +
  scale_x_date(breaks = as.Date(paste0(seq(1960, 2100, 2), "-01-01")),
               labels = date_format("%Y")) +
  theme(legend.position = c(0.3, 0.85),
        legend.title = element_blank()) +
  scale_y_continuous(breaks = 0.01*seq(0, 100, 1),
                labels = percent_format(acc = 1))
Trade Balance
Europe, China, United States
Code
ext_lt_introeu27_2020 %>%
  filter(geo %in% c("EU27_2020", "CN_X_HK", "US"),
         indic_et == "MIO_BAL_VAL",
         sitc06 == "TOTAL") %>%
  mutate(Geo = ifelse(geo == "CN_X_HK", "China", Geo)) %>%
  mutate(Geo = ifelse(geo == "EU27_2020", "Europe", Geo)) %>%
  year_to_date %>%
  left_join(colors, by = c("Geo" = "country")) %>%
  mutate(values = values/1e6) %>%
  ggplot + geom_line(aes(x = date, y = values, color = color)) +
  scale_color_identity() + theme_minimal() + add_3flags + xlab("") + ylab("Trade balance (Tn€)") +
  scale_x_date(breaks = as.Date(paste0(seq(1960, 2100, 2), "-01-01")),
               labels = date_format("%Y")) +
  theme(legend.position = c(0.3, 0.15),
        legend.title = element_blank()) +
  geom_hline(yintercept = 0, linetype = "dashed", color = "black")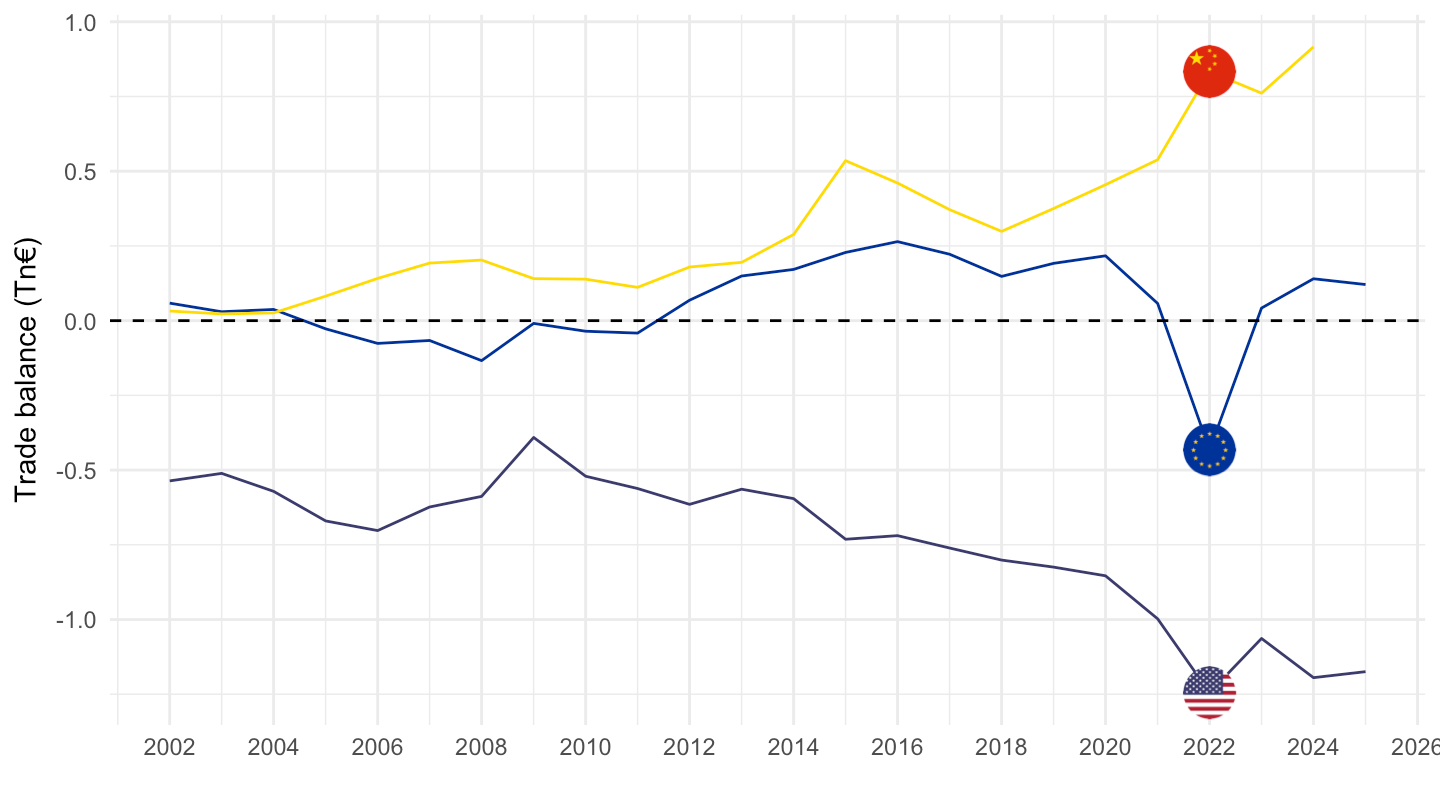
Latest Year: Exports, Imports, Balance
Code
latest_y <- ext_lt_introeu27_2020 %>%
  filter(geo == "EU27_2020", sitc06 == "TOTAL", indic_et == "MIO_BAL_VAL", !is.na(values)) %>%
  summarise(m = max(time)) %>%
  pull(m)

ext_lt_introeu27_2020 %>%
  filter(sitc06 == "TOTAL",
         time == latest_y,
         indic_et %in% c("MIO_EXP_VAL", "MIO_IMP_VAL", "MIO_BAL_VAL")) %>%
  mutate(values = round(values/1000, 1)) %>%
  select(Geo, Indic_et, values) %>%
  spread(Indic_et, values) %>%
  arrange(desc(`Exports in million of ECU/EURO`)) %>%
print_table_conditional()| Geo | Exports in million of ECU/EURO | Imports in million of ECU/EURO | Trade balance in million ECU/EURO |
|---|---|---|---|
| European Union - 27 countries (from 2020) | 2643.8 | 2523.0 | 120.8 |
| United States | 1926.7 | 3101.1 | -1174.5 |
| Japan | 653.3 | 668.5 | -15.3 |
| South Korea | 627.4 | 558.9 | 68.5 |
| Mexico | 589.3 | 587.3 | 2.1 |
| Singapore | 500.9 | 446.0 | 55.0 |
| Canada | 499.1 | 505.4 | -6.3 |
| United Kingdom | 491.0 | 839.7 | -348.7 |
| Brazil | 308.6 | 260.1 | 48.5 |