International trade of EU, the euro area and the Member States by SITC product group - ext_lt_intertrd
Data - Eurostat
Info
Last observation: Annual: 2025 (N = 2,362)
First observation: Annual: 2002 (N = 2,362)
Last data update: 23 jul 2026, 23:07. Last compile: 24 jul 2026, 01:36
Structure
Share of exports to EU in total exports
EU, Germany, France, Spain, Italy
Code
ext_lt_intertrd %>%
  filter(geo %in% c("DE", "FR", "ES", "IT", "NL"),
         partner == "WORLD",
         # B1GQ: Gross domestic product at market prices
         indic_et == "MIO_EXP_VAL",
         sitc06 == "TOTAL") %>%

  left_join(world_exports, by = "time") %>%
  mutate(Geo = ifelse(geo == "EU27_2020", "Europe", Geo)) %>%
  year_to_date %>%
  left_join(colors, by = c("Geo" = "country")) %>%
  mutate(color = ifelse(geo == "NL", color2, color)) %>%
  mutate(values = values/world_exports) %>%
  ggplot + geom_line(aes(x = date, y = values, color = color)) +
  scale_color_identity() + theme_minimal()  + add_5flags + xlab("") +
  ylab("Part des exportations dans les exportations de la Zone € (%)") +
  scale_x_date(breaks = as.Date(paste0(seq(1960, 2100, 1), "-01-01")),
               labels = date_format("%Y")) +
  scale_y_continuous(breaks = 0.01*seq(0, 100, 1),
                labels = percent_format(acc = 1))
France, Spain, Italy, Belgium, Netherlands
Code
ext_lt_intertrd %>%
  filter(geo %in% c("FR", "ES", "IT", "NL", "BE"),
         partner == "WORLD",
         # B1GQ: Gross domestic product at market prices
         indic_et == "MIO_EXP_VAL",
         sitc06 == "TOTAL") %>%

  left_join(world_exports, by = "time") %>%
  mutate(Geo = ifelse(geo == "EU27_2020", "Europe", Geo)) %>%
  year_to_date %>%
  left_join(colors, by = c("Geo" = "country")) %>%
  mutate(color = ifelse(geo == "NL", color2, color)) %>%
  mutate(values = values/world_exports) %>%
  ggplot + geom_line(aes(x = date, y = values, color = color)) +
  scale_color_identity() + theme_minimal()  + add_5flags + xlab("") +
  ylab("Part des exportations dans les exportations de la Zone € (%)") +
  scale_x_date(breaks = as.Date(paste0(seq(1960, 2100, 1), "-01-01")),
               labels = date_format("%Y")) +
  scale_y_continuous(breaks = 0.01*seq(0, 100, 1),
                labels = percent_format(acc = 1))
Finland, Austria, Portugal, Greece, Ireland
Code
ext_lt_intertrd %>%
  filter(geo %in% c("FI", "AT", "PT", "EL", "IE"),
         partner == "WORLD",
         # B1GQ: Gross domestic product at market prices
         indic_et == "MIO_EXP_VAL",
         sitc06 == "TOTAL") %>%

  left_join(world_exports, by = "time") %>%
  mutate(Geo = ifelse(geo == "EU27_2020", "Europe", Geo)) %>%
  year_to_date %>%
  left_join(colors, by = c("Geo" = "country")) %>%
  mutate(color = ifelse(geo == "NL", color2, color)) %>%
  mutate(values = values/world_exports) %>%
  ggplot + geom_line(aes(x = date, y = values, color = color)) +
  scale_color_identity() + theme_minimal()  + add_5flags + xlab("") +
  ylab("Part des exportations dans les exportations de la Zone € (%)") +
  scale_x_date(breaks = as.Date(paste0(seq(1960, 2100, 1), "-01-01")),
               labels = date_format("%Y")) +
  scale_y_continuous(breaks = 0.01*seq(0, 100, 1),
                labels = percent_format(acc = 1))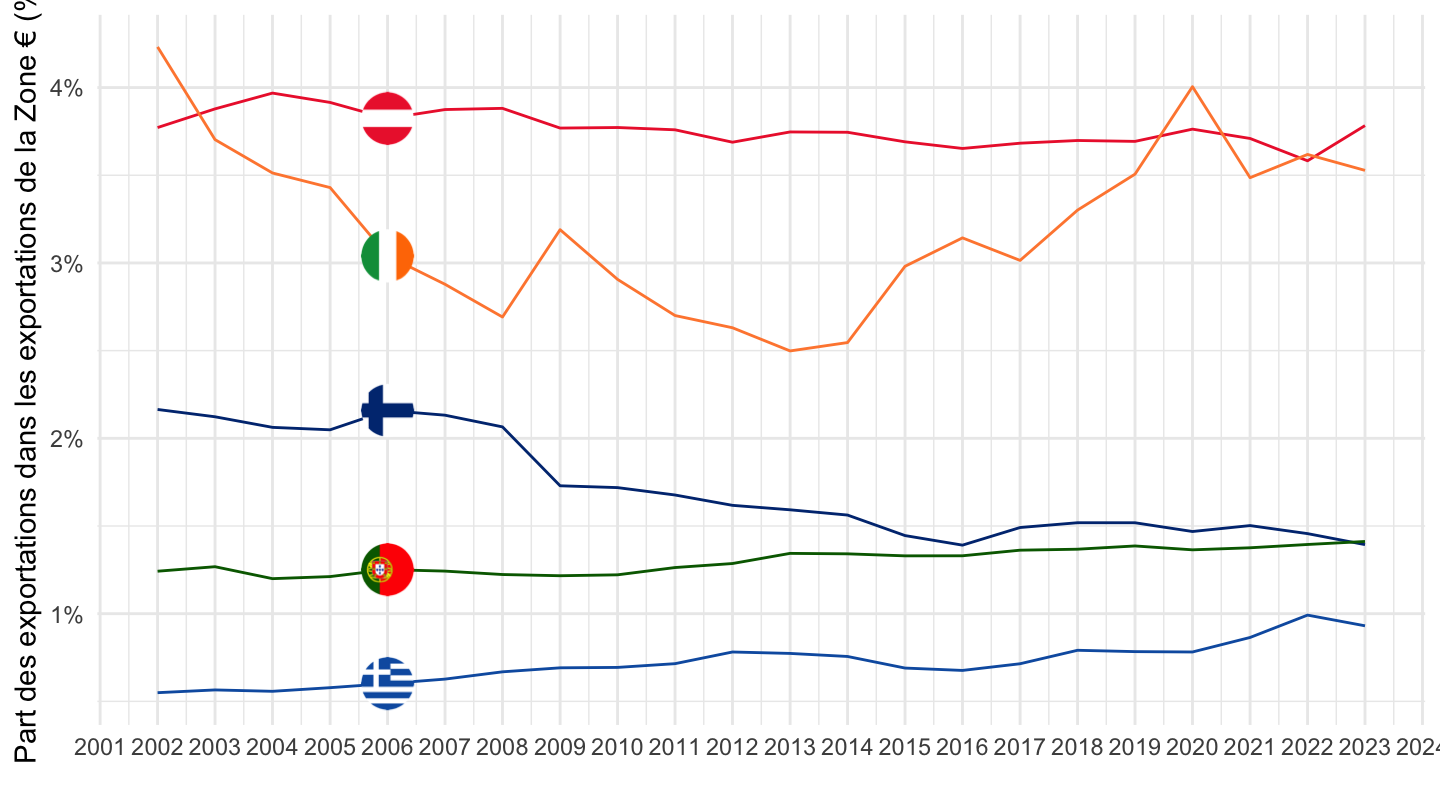
Slovakia, Lithuania, Slovenia, Luxembourg
Code
ext_lt_intertrd %>%
  filter(geo %in% c("SK", "LT", "SI", "LU"),
         partner == "WORLD",
         # B1GQ: Gross domestic product at market prices
         indic_et == "MIO_EXP_VAL",
         sitc06 == "TOTAL") %>%

  left_join(world_exports, by = "time") %>%
  mutate(Geo = ifelse(geo == "EU27_2020", "Europe", Geo)) %>%
  year_to_date %>%
  left_join(colors, by = c("Geo" = "country")) %>%
  mutate(color = ifelse(geo == "NL", color2, color)) %>%
  mutate(values = values/world_exports) %>%
  ggplot + geom_line(aes(x = date, y = values, color = color)) +
  scale_color_identity() + theme_minimal()  + add_4flags + xlab("") +
  ylab("Part des exportations dans les exportations de la Zone € (%)") +
  scale_x_date(breaks = as.Date(paste0(seq(1960, 2100, 1), "-01-01")),
               labels = date_format("%Y")) +
  scale_y_continuous(breaks = 0.01*seq(0, 100, .2),
                labels = percent_format(acc = .1))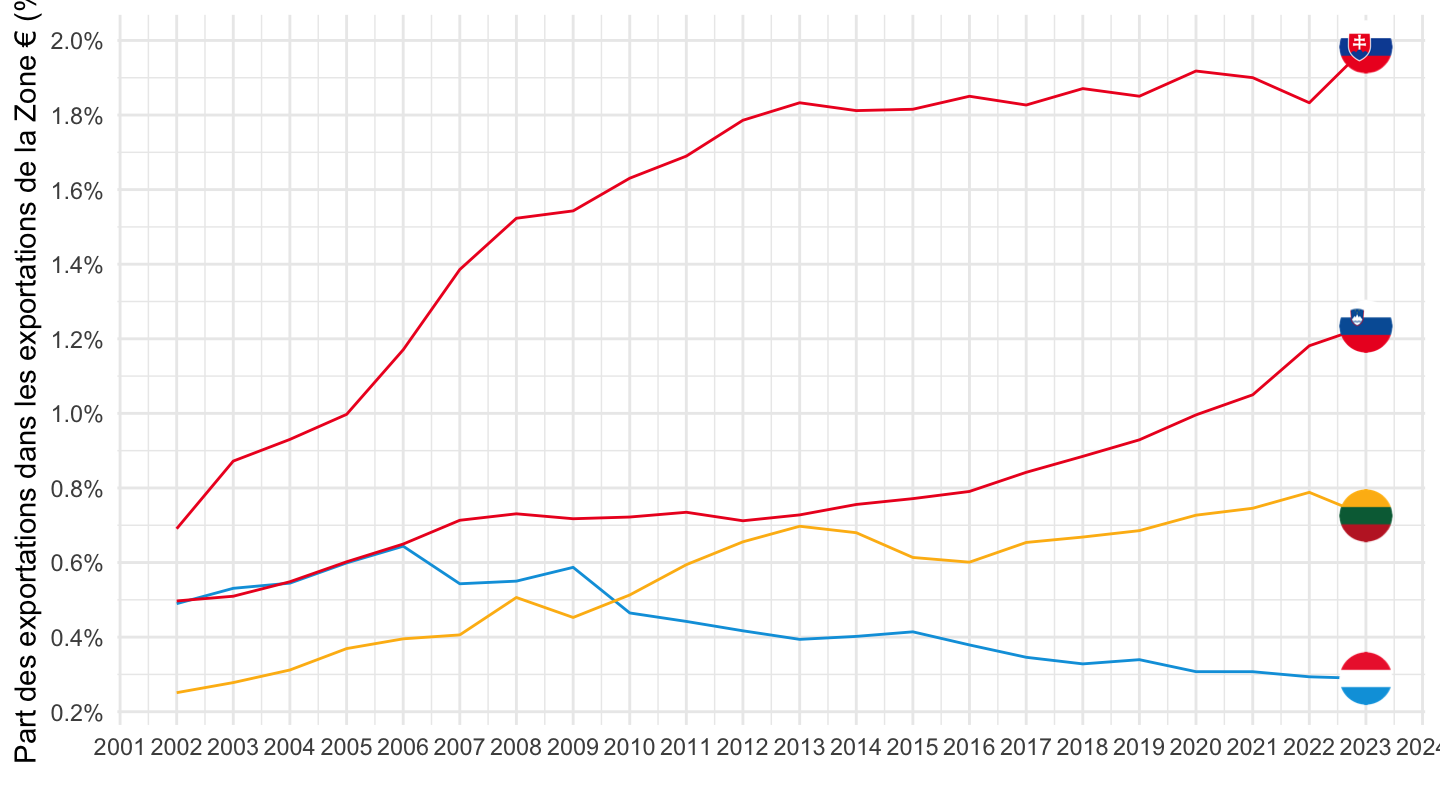
Latvia, Estonia, Cyprus, Malta
Code
ext_lt_intertrd %>%
  filter(geo %in% c("LV", "EE", "CY", "MT"),
         partner == "WORLD",
         # B1GQ: Gross domestic product at market prices
         indic_et == "MIO_EXP_VAL",
         sitc06 == "TOTAL") %>%

  left_join(world_exports, by = "time") %>%
  mutate(Geo = ifelse(geo == "EU27_2020", "Europe", Geo)) %>%
  year_to_date %>%
  left_join(colors, by = c("Geo" = "country")) %>%
  mutate(color = ifelse(geo == "NL", color2, color)) %>%
  mutate(values = values/world_exports) %>%
  ggplot + geom_line(aes(x = date, y = values, color = color)) +
  scale_color_identity() + theme_minimal()  + add_4flags + xlab("") +
  ylab("Part des exportations dans les exportations de la Zone € (%)") +
  scale_x_date(breaks = as.Date(paste0(seq(1960, 2100, 1), "-01-01")),
               labels = date_format("%Y")) +
  scale_y_continuous(breaks = 0.01*seq(0, 100, .1),
                labels = percent_format(acc = .1))
Share of imports to EU in total imports
EU, Germany, France, Spain, Italy
Code
ext_lt_intertrd %>%
  filter(geo %in% c("DE", "FR", "ES", "IT", "NL"),
         partner == "WORLD",
         # B1GQ: Gross domestic product at market prices
         indic_et == "MIO_IMP_VAL",
         sitc06 == "TOTAL") %>%

  left_join(world_imports, by = "time") %>%
  mutate(Geo = ifelse(geo == "EU27_2020", "Europe", Geo)) %>%
  year_to_date %>%
  left_join(colors, by = c("Geo" = "country")) %>%
  mutate(color = ifelse(geo == "NL", color2, color)) %>%
  mutate(values = values/world_imports) %>%
  ggplot + geom_line(aes(x = date, y = values, color = color)) +
  scale_color_identity() + theme_minimal()  + add_5flags + xlab("") +
  ylab("Part des importations dans les importations de la Zone € (%)") +
  scale_x_date(breaks = as.Date(paste0(seq(1960, 2100, 1), "-01-01")),
               labels = date_format("%Y")) +
  scale_y_continuous(breaks = 0.01*seq(0, 100, 1),
                labels = percent_format(acc = 1))
France, Spain, Italy, Belgium, Netherlands
Code
ext_lt_intertrd %>%
  filter(geo %in% c("FR", "ES", "IT", "NL", "BE"),
         partner == "WORLD",
         # B1GQ: Gross domestic product at market prices
         indic_et == "MIO_IMP_VAL",
         sitc06 == "TOTAL") %>%

  left_join(world_imports, by = "time") %>%
  mutate(Geo = ifelse(geo == "EU27_2020", "Europe", Geo)) %>%
  year_to_date %>%
  left_join(colors, by = c("Geo" = "country")) %>%
  mutate(color = ifelse(geo == "NL", color2, color)) %>%
  mutate(values = values/world_imports) %>%
  ggplot + geom_line(aes(x = date, y = values, color = color)) +
  scale_color_identity() + theme_minimal()  + add_5flags + xlab("") +
  ylab("Part des importations dans les importations de la Zone € (%)") +
  scale_x_date(breaks = as.Date(paste0(seq(1960, 2100, 1), "-01-01")),
               labels = date_format("%Y")) +
  scale_y_continuous(breaks = 0.01*seq(0, 100, 1),
                labels = percent_format(acc = 1))
Finland, Austria, Portugal, Greece, Ireland
Code
ext_lt_intertrd %>%
  filter(geo %in% c("FI", "AT", "PT", "EL", "IE"),
         partner == "WORLD",
         # B1GQ: Gross domestic product at market prices
         indic_et == "MIO_IMP_VAL",
         sitc06 == "TOTAL") %>%

  left_join(world_imports, by = "time") %>%
  mutate(Geo = ifelse(geo == "EU27_2020", "Europe", Geo)) %>%
  year_to_date %>%
  left_join(colors, by = c("Geo" = "country")) %>%
  mutate(color = ifelse(geo == "NL", color2, color)) %>%
  mutate(values = values/world_imports) %>%
  ggplot + geom_line(aes(x = date, y = values, color = color)) +
  scale_color_identity() + theme_minimal()  + add_5flags + xlab("") +
  ylab("Part des importations dans les importations de la Zone € (%)") +
  scale_x_date(breaks = as.Date(paste0(seq(1960, 2100, 1), "-01-01")),
               labels = date_format("%Y")) +
  scale_y_continuous(breaks = 0.01*seq(0, 100, 1),
                labels = percent_format(acc = 1))
Slovakia, Lithuania, Slovenia, Luxembourg
Code
ext_lt_intertrd %>%
  filter(geo %in% c("SK", "LT", "SI", "LU"),
         partner == "WORLD",
         # B1GQ: Gross domestic product at market prices
         indic_et == "MIO_IMP_VAL",
         sitc06 == "TOTAL") %>%

  left_join(world_imports, by = "time") %>%
  mutate(Geo = ifelse(geo == "EU27_2020", "Europe", Geo)) %>%
  year_to_date %>%
  left_join(colors, by = c("Geo" = "country")) %>%
  mutate(color = ifelse(geo == "NL", color2, color)) %>%
  mutate(values = values/world_imports) %>%
  ggplot + geom_line(aes(x = date, y = values, color = color)) +
  scale_color_identity() + theme_minimal()  + add_4flags + xlab("") +
  ylab("Part des importations dans les importations de la Zone € (%)") +
  scale_x_date(breaks = as.Date(paste0(seq(1960, 2100, 1), "-01-01")),
               labels = date_format("%Y")) +
  scale_y_continuous(breaks = 0.01*seq(0, 100, .2),
                labels = percent_format(acc = .1))
Latvia, Estonia, Cyprus, Malta
Code
ext_lt_intertrd %>%
  filter(geo %in% c("LV", "EE", "CY", "MT"),
         partner == "WORLD",
         # B1GQ: Gross domestic product at market prices
         indic_et == "MIO_IMP_VAL",
         sitc06 == "TOTAL") %>%

  left_join(world_imports, by = "time") %>%
  mutate(Geo = ifelse(geo == "EU27_2020", "Europe", Geo)) %>%
  year_to_date %>%
  left_join(colors, by = c("Geo" = "country")) %>%
  mutate(color = ifelse(geo == "NL", color2, color)) %>%
  mutate(values = values/world_imports) %>%
  ggplot + geom_line(aes(x = date, y = values, color = color)) +
  scale_color_identity() + theme_minimal()  + add_4flags + xlab("") +
  ylab("Part des importations dans les importations de la Zone € (%)") +
  scale_x_date(breaks = as.Date(paste0(seq(1960, 2100, 1), "-01-01")),
               labels = date_format("%Y")) +
  scale_y_continuous(breaks = 0.01*seq(0, 100, .1),
                labels = percent_format(acc = .1))
Share of imports to EU in total imports
EU, Germany, France, Spain, Italy
Code
ext_lt_intertrd %>%
  filter(geo %in% c("EU27_2020", "DE", "FR", "ES", "IT", "NL"),
         # B1GQ: Gross domestic product at market prices
         indic_et == "PC_IMP_EU",
         sitc06 == "TOTAL") %>%

  mutate(Geo = ifelse(geo == "EU27_2020", "Europe", Geo)) %>%
  year_to_date %>%
  left_join(colors, by = c("Geo" = "country")) %>%
  mutate(values = values/100) %>%
  ggplot + geom_line(aes(x = date, y = values, color = color)) +
  scale_color_identity() + theme_minimal()  + add_6flags + xlab("") +
  ylab("Share of imports from EU in total imports (%)") +
  scale_x_date(breaks = as.Date(paste0(seq(1960, 2100, 5), "-01-01")),
               labels = date_format("%Y")) +
  scale_y_continuous(breaks = 0.01*seq(0, 100, 1),
                labels = percent_format(acc = 1))