
Last observation: août 2026 (N = 438)
First observation: janv. 1994 (N = 876)
Last data update: 18 oct. 2026, 23:24
Last compile: 25 oct. 2026, 22:43
ert_eff_ic_m |>
  filter(geo %in% c("FR", "DE", "IT", "ES"),
         exch_rt == "NEER_IC42") |>
  month_to_date() |>
  add_flag_color("Geo") |>
  ggplot() + geom_line(aes(x = date, y = values, color = color)) +
  theme_minimal() + scale_color_identity() + add_flags +
  scale_x_date(breaks = as.Date(paste0(seq(1990, 2100, 5), "-01-01")),
               labels = date_format("%Y")) +
  xlab("") + ylab("Nominal effective exchange rate (2015 = 100)")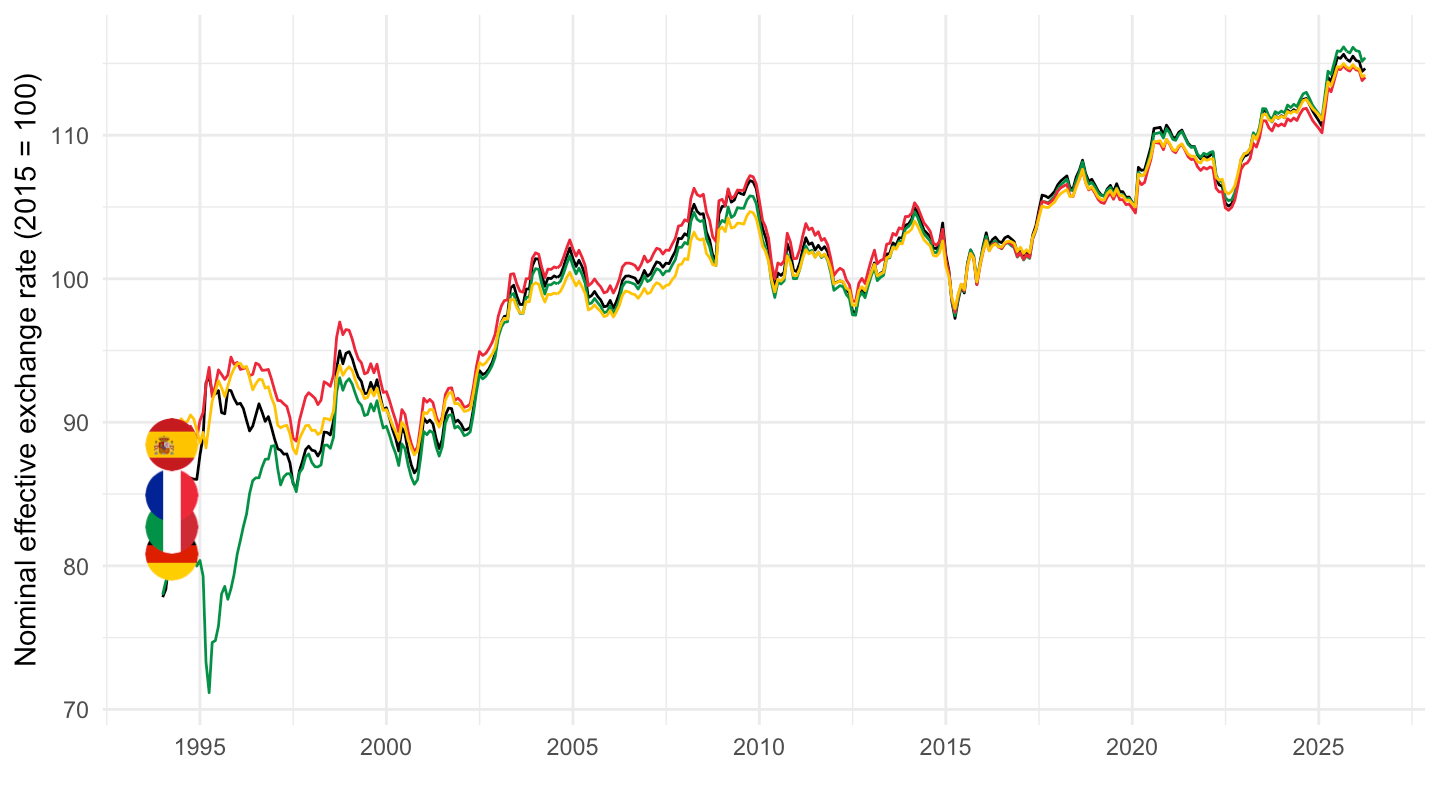
ert_eff_ic_m |>
  filter(geo == "FR",
         exch_rt %in% c("NEER_IC42", "REER_IC42_CPI")) |>
  month_to_date() |>
  ggplot() + geom_line(aes(x = date, y = values, color = Exch_rt)) +
  theme_minimal() +
  theme(legend.position = c(0.35, 0.15),
        legend.title = element_blank()) +
  scale_x_date(breaks = as.Date(paste0(seq(1990, 2100, 5), "-01-01")),
               labels = date_format("%Y")) +
  xlab("") + ylab("Effective exchange rate (2015 = 100)") +
  scale_color_discrete(labels = c("Nominal (42 partners)", "Real, CPI-deflated (42 partners)"))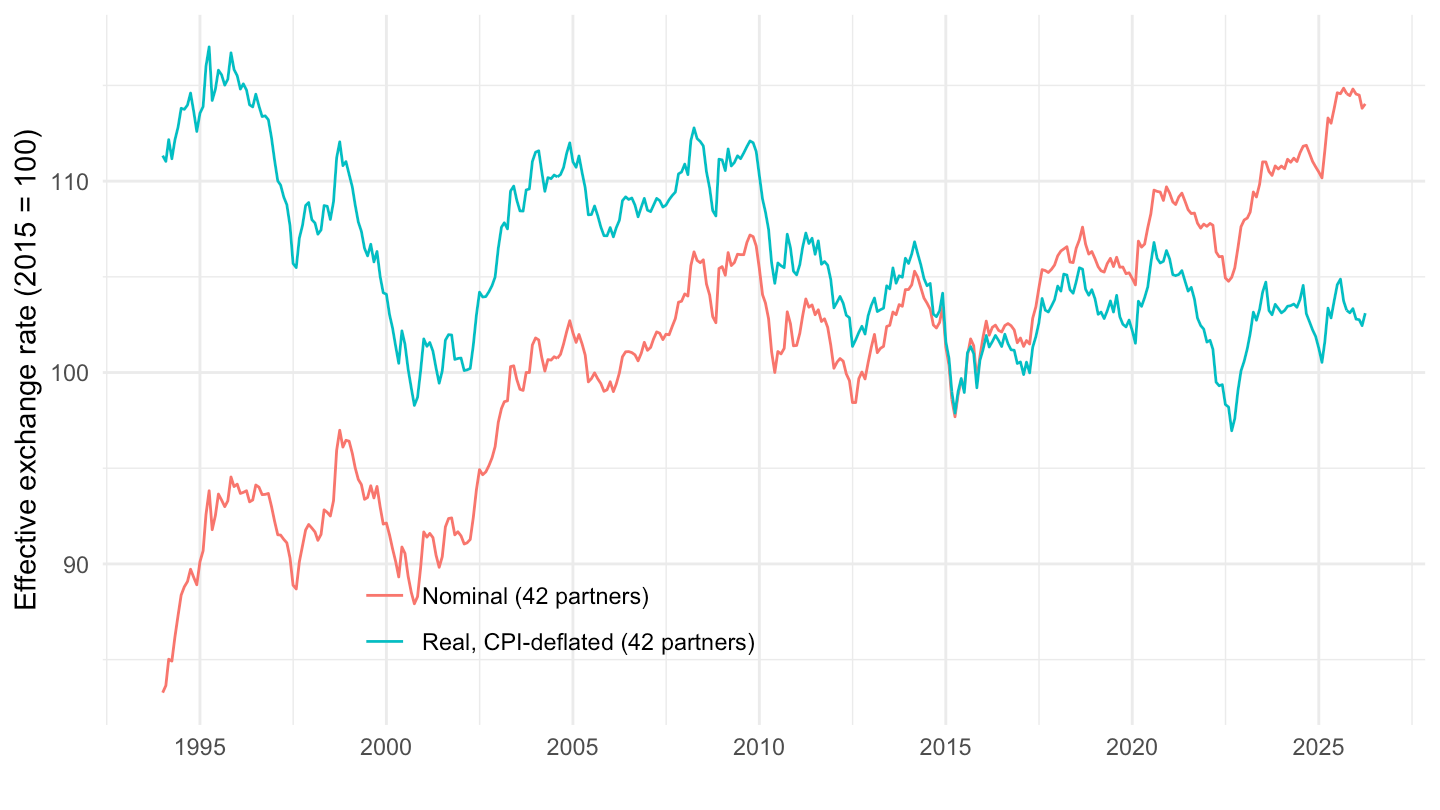
latest_m <- ert_eff_ic_m |>
  filter(exch_rt == "NEER_IC42",
         geo %in% c("FR", "DE", "IT", "ES", "NL", "PL"),
         !is.na(values)) |>
  summarise(m = max(time)) |>
  pull(m)

ert_eff_ic_m |>
  filter(geo %in% c("FR", "DE", "IT", "ES", "NL", "PL"),
         exch_rt %in% c("NEER_IC42", "REER_IC42_CPI"),
         time == latest_m) |>
  select(Exch_rt, Geo, values) |>
  spread(Geo, values) |>
print_table_conditional()| Exch_rt | France | Germany | Italy | Netherlands | Poland | Spain |
|---|---|---|---|---|---|---|
| Nominal effective exchange rate - 42 trading partners (industrial countries) | 105.92576 | 105.8637 | 106.97282 | 104.3623 | 107.9851 | 105.6212 |
| Real effective exchange rate (deflator: consumer price index - 42 trading partners - industrial countries ) | 98.63136 | 103.7569 | 99.48724 | 105.5494 | 118.2880 | 101.9537 |