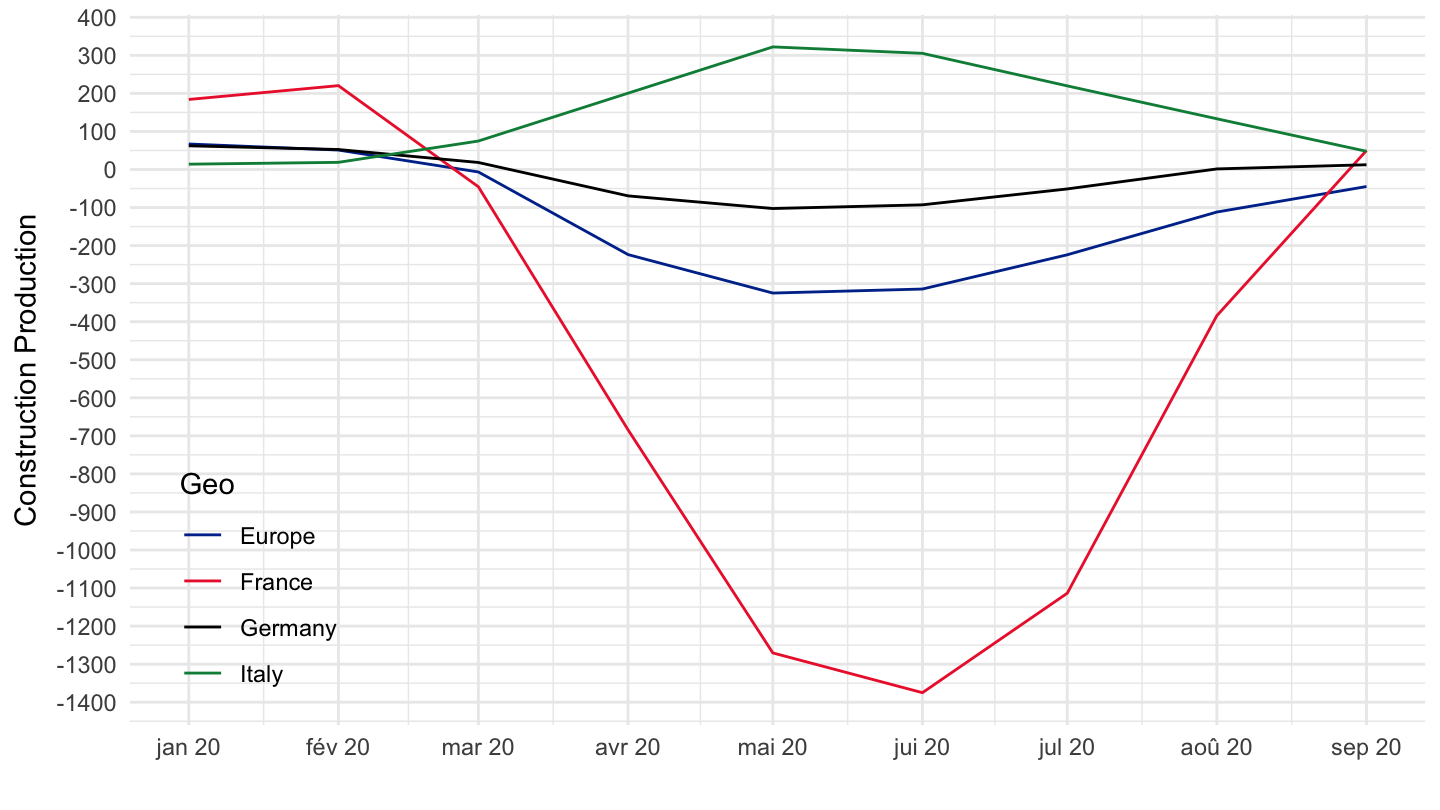
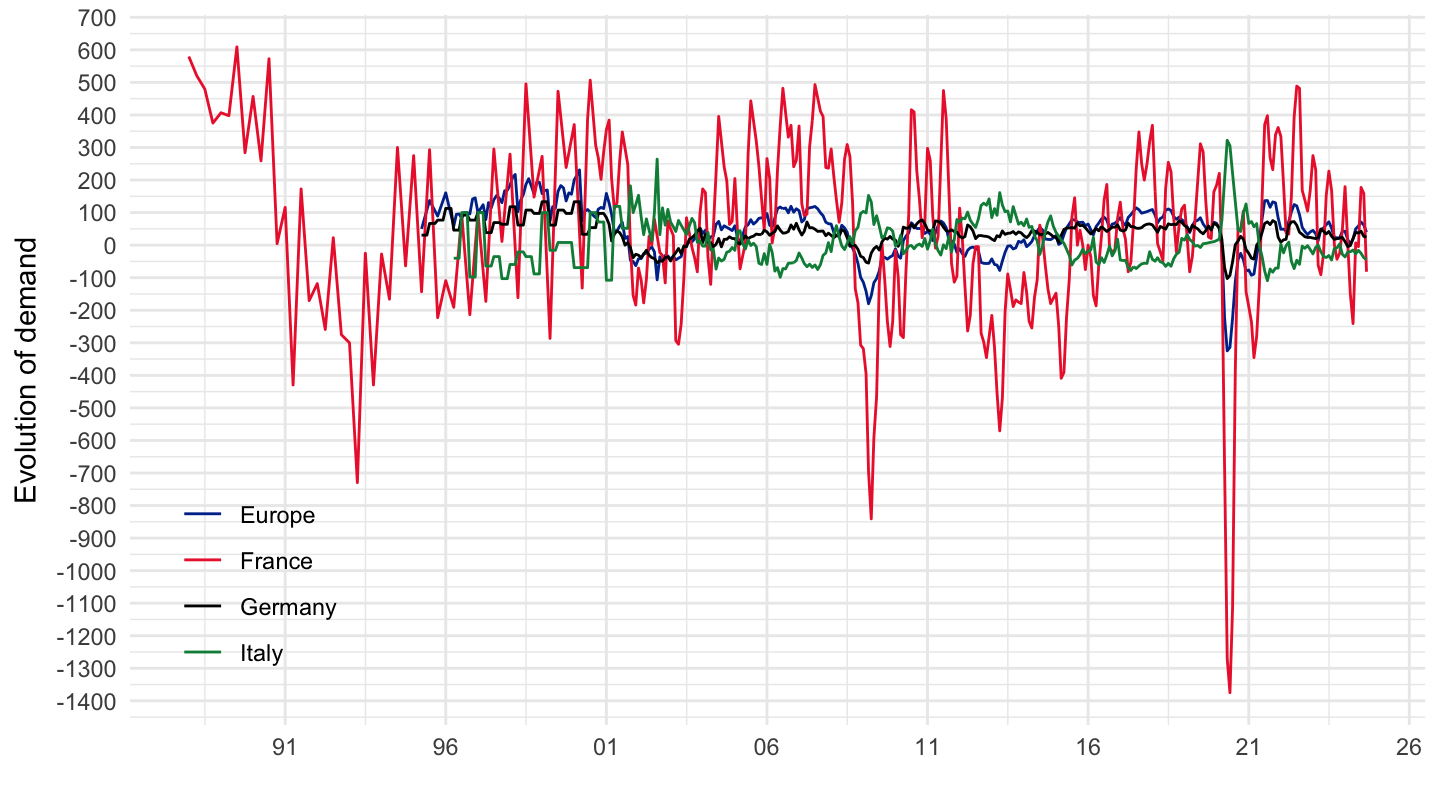
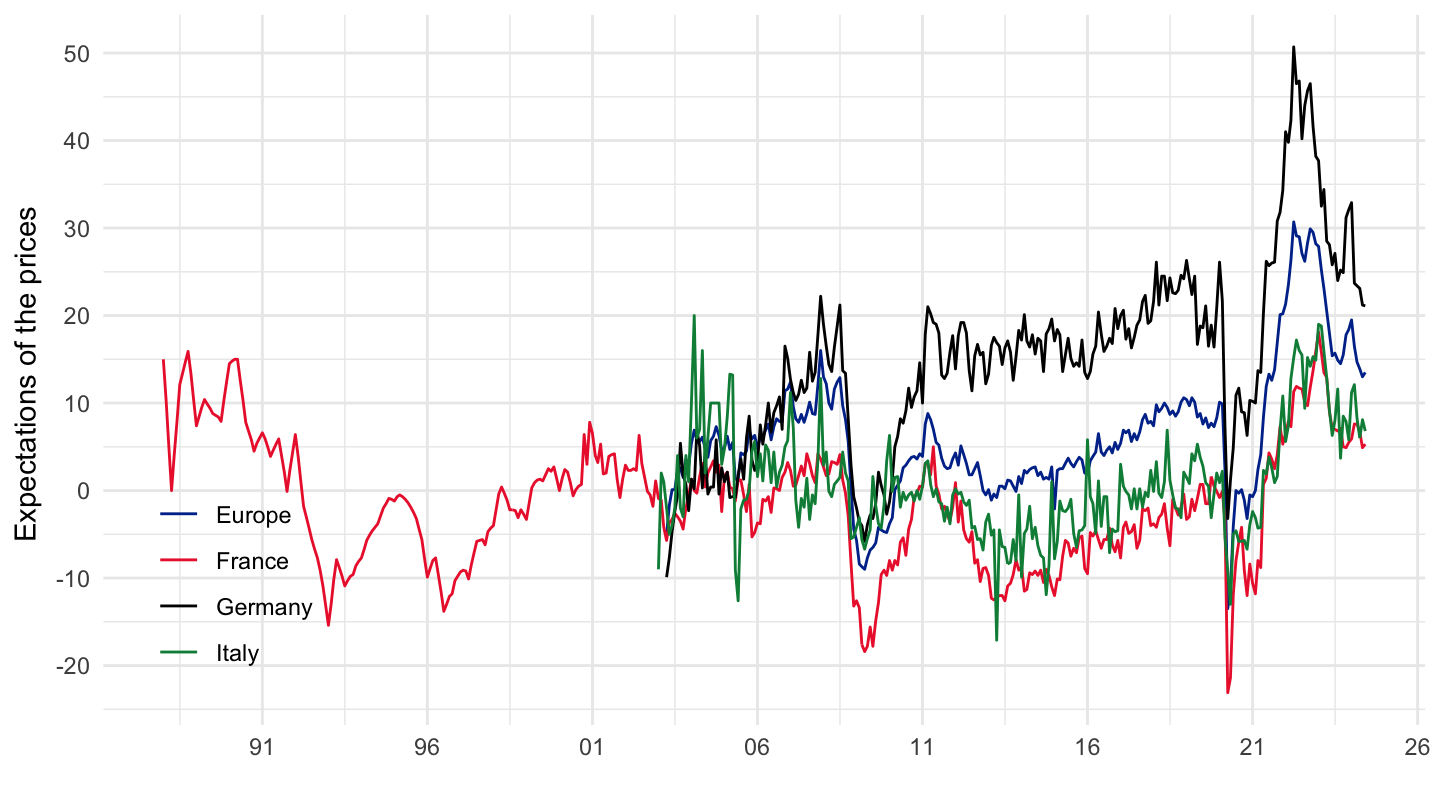
ei_bsse_m_r2 %>%
  filter(indic == "BS-SARM",
         geo %in% c("FR", "DE", "IT", "EU27_2020"),
         s_adj == "NSA") %>%
  select(geo, time, values) %>%
  group_by(geo) %>%
  mutate(values = 100*values/values[time == "1997M01"]) %>%
  left_join(geo, by = "geo") %>%
  mutate(Geo = ifelse(geo == "DE", "Germany", Geo),
         Geo = ifelse(geo == "EU27_2020", "Europe", Geo)) %>%
  month_to_date %>%
  filter(date >= as.Date("2020-01-01"),
         date <= as.Date("2020-09-01")) %>%
  ggplot() + ylab("Construction Production") + xlab("") + theme_minimal() +
  geom_line(aes(x = date, y = values, color = Geo)) +
  scale_color_manual(values = c("#003399", "#ED2939", "#000000", "#008c45")) +
  scale_x_date(breaks = "1 month",
               labels = date_format("%b %y")) +
  theme(legend.position = c(0.1, 0.2)) +
  scale_y_continuous(breaks = seq(-3000, 2000, 100))


