
Last observation: mars 2023 (N = 48)
First observation: avr. 2006 (N = 48)
Last data update: 09 sept. 2026, 07:56
Last compile: 25 oct. 2026, 22:41
ei_bsfs_m |>
  filter(indic == "BS-FCI",
         nace_r2 == "K",
         geo %in% c("EA", "EU27_2020")) |>
  month_to_date() |>
  add_flag_color("Geo") |>
  ggplot() + geom_line(aes(x = date, y = values, color = color)) +
  scale_color_identity() + add_flags +
  theme_minimal() +
  scale_x_date(breaks = as.Date(paste0(seq(2006, 2100, 2), "-01-01")),
               labels = date_format("%Y")) +
  theme(legend.position = c(0.25, 0.15),
        legend.title = element_blank()) +
  xlab("") + ylab("Financial services confidence indicator") +
  geom_hline(yintercept = 0, linetype = "dashed", color = "black")
ei_bsfs_m |>
  filter(geo == "EA",
         nace_r2 == "K",
         indic %in% c("BS-BSDP3", "BS-DEVP3", "BS-EEVP3")) |>
  month_to_date() |>
  ggplot() + geom_line(aes(x = date, y = values, color = Indic)) +
  theme_minimal() +
  scale_x_date(breaks = as.Date(paste0(seq(2006, 2100, 2), "-01-01")),
               labels = date_format("%Y")) +
  theme(legend.position = "bottom",
        legend.title = element_blank()) +
  guides(color = guide_legend(nrow = 3)) +
  xlab("") + ylab("Balance of opinions (past 3 months)") +
  geom_hline(yintercept = 0, linetype = "dashed", color = "black")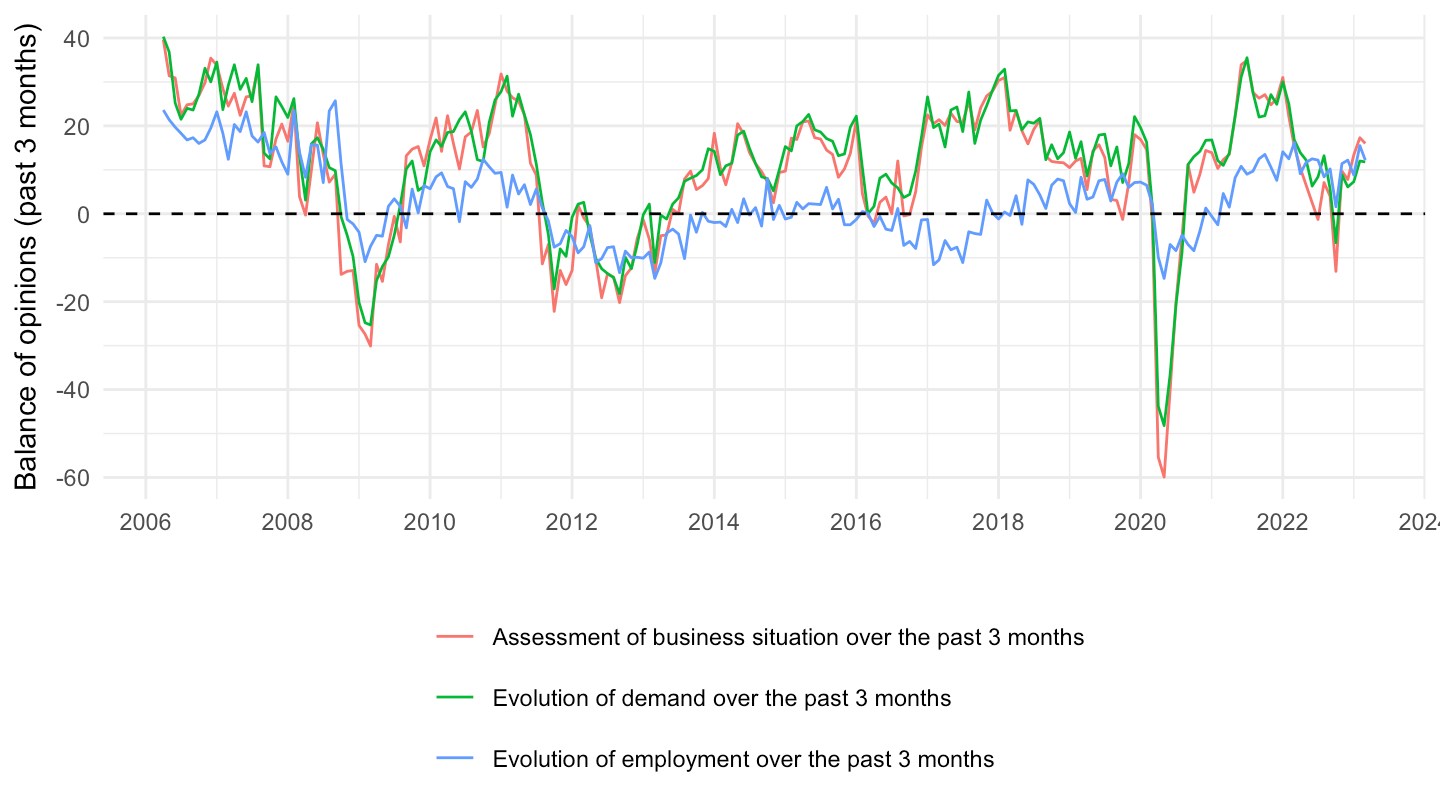
indic <- read_parquet("indic_fr.parquet")
ei_bsfs_m |>

  group_by(indic, Indic) |>
  summarise(Nobs = n()) |>
  arrange(-Nobs) |>
print_table_conditional()| indic | Indic | Nobs |
|---|---|---|
| BS-BSDP3 | Assessment of business situation over the past 3 months | 1632 |
| BS-DEVP3 | Evolution of demand over the past 3 months | 1632 |
| BS-DEXN3 | Evolution of demand expected over the next 3 months | 1632 |
| BS-EEVP3 | Evolution of employment over the past 3 months | 1632 |
| BS-EEXN3 | Evolution of employment expected over the next 3 months | 1632 |
| BS-FCI | Financial services confidence indicator | 1632 |