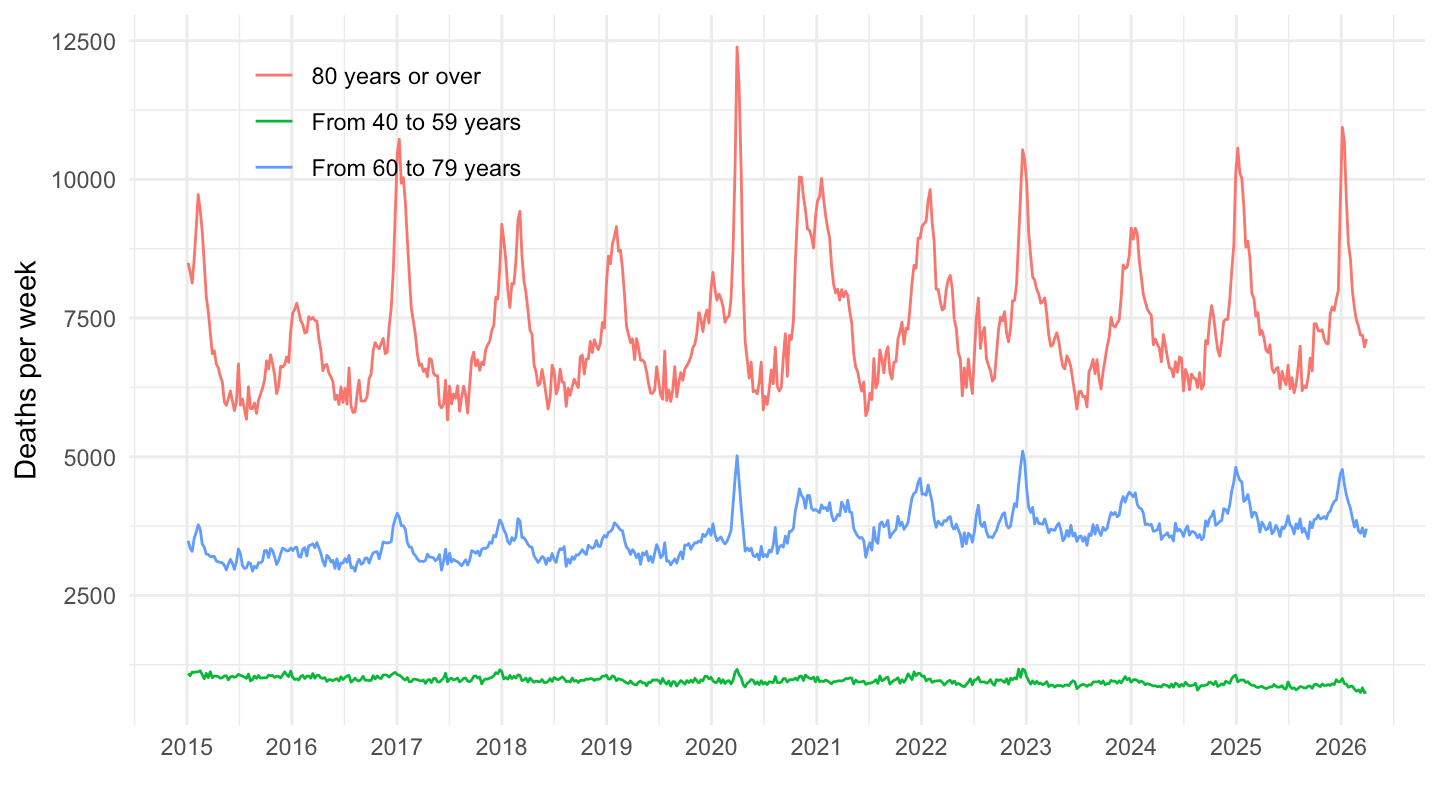
Last observation: 2026-W32 (N = 567)
First observation: 2000-W01 (N = 13464)
Last data update: 17 sept. 2026, 23:11
Last compile: 04 oct. 2026, 23:03
demo_r_mwk3_20 |>
  filter(geo == "FR",
         age == "TOTAL",
         sex %in% c("F", "M")) |>
  mutate(year = time |> substr(1, 4) |> as.integer(),
         week = time |> substr(7, 8) |> as.integer(),
         jan4 = as.Date(paste0(year, "-01-04")),
         monday_w1 = jan4 - (as.integer(format(jan4, "%u")) - 1),
         date = monday_w1 + (week - 1)*7) |>
  select(-year, -week, -jan4, -monday_w1, -time) |>

  ggplot() + geom_line(aes(x = date, y = values, color = Sex)) +
  theme_minimal() +
  scale_x_date(breaks = as.Date(paste0(seq(2000, 2100, 2), "-01-01")),
               labels = date_format("%Y")) +
  theme(legend.position = c(0.15, 0.85),
        legend.title = element_blank()) +
  xlab("") + ylab("Deaths per week")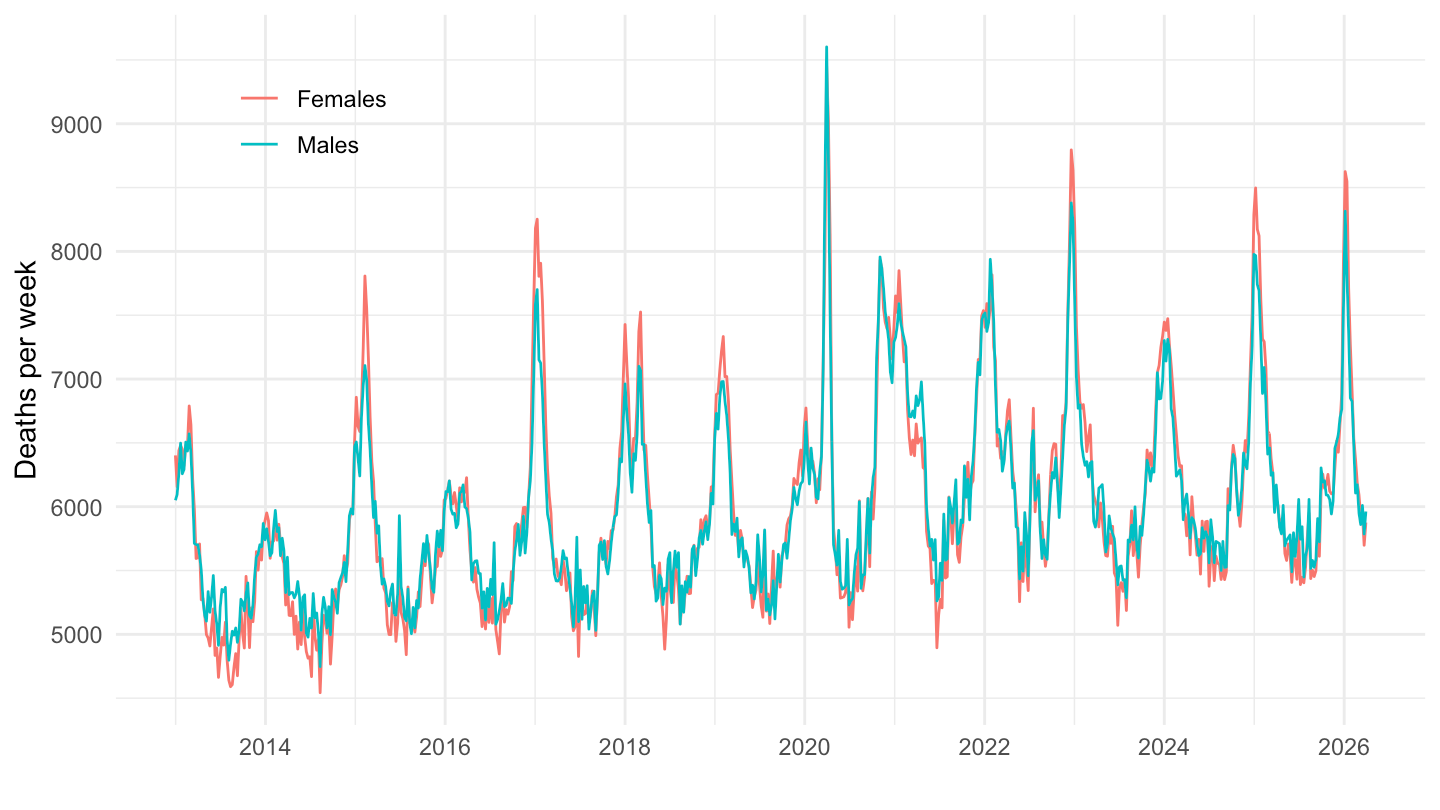
demo_r_mwk3_20 |>
  filter(geo == "FR",
         sex == "T",
         age %in% c("Y40-59", "Y60-79", "Y_GE80")) |>
  mutate(year = time |> substr(1, 4) |> as.integer(),
         week = time |> substr(7, 8) |> as.integer(),
         jan4 = as.Date(paste0(year, "-01-04")),
         monday_w1 = jan4 - (as.integer(format(jan4, "%u")) - 1),
         date = monday_w1 + (week - 1)*7) |>
  select(-year, -week, -jan4, -monday_w1, -time) |>
  filter(date >= as.Date("2015-01-01")) |>

  ggplot() + geom_line(aes(x = date, y = values, color = Age)) +
  theme_minimal() +
  scale_x_date(breaks = as.Date(paste0(seq(2000, 2100, 1), "-01-01")),
               labels = date_format("%Y")) +
  theme(legend.position = c(0.2, 0.85),
        legend.title = element_blank()) +
  xlab("") + ylab("Deaths per week")