Code
tibble(DOWNLOAD_TIME = as.Date(file.info("~/iCloud/website/data/eurostat/bop_exms6_q.RData")$mtime)) %>%
print_table_conditional()| DOWNLOAD_TIME |
|---|
| 2026-04-14 |
Data - Eurostat
tibble(DOWNLOAD_TIME = as.Date(file.info("~/iCloud/website/data/eurostat/bop_exms6_q.RData")$mtime)) %>%
print_table_conditional()| DOWNLOAD_TIME |
|---|
| 2026-04-14 |
bop_exms6_q %>%
  group_by(time) %>%
  summarise(Nobs = n()) %>%
  arrange(desc(time)) %>%
  head(1) %>%
print_table_conditional()| time | Nobs |
|---|---|
| 2024 | 936 |
bop_exms6_q %>%
  left_join(unit, by = "unit") %>%
  group_by(unit, Unit) %>%
  summarise(Nobs = n()) %>%
  arrange(-Nobs) %>%
print_table_conditional| unit | Unit | Nobs |
|---|---|---|
| PC_WRL | Percentage of world total | 2927 |
| PCH_WRL_1Y | Percentage of world total - 1-year change | 2804 |
| PC_OECD | Percentage of OECD total | 2594 |
| PCH_WRL_3Y | Percentage of world total - 3 year change | 2475 |
| PCH_WRL_5Y | Percentage of world total - 5-year change | 2312 |
| PC_OECD_EU | Percentage of the total of OECD countries and EU Member States not in OECD | 2298 |
| PCH_OECD_EU_1Y | Percentage of OECD and non-OECD EU countries total - 1-year change | 1998 |
| PCH_OECD_5Y | Percentage of OECD total - 5-year change | 1976 |
| PCH_OECD_EU_3Y | Percentage of OECD and non-OECD EU countries total - 3-year change | 1854 |
| PCH_OECD_EU_5Y | Percentage of the total of OECD countries and EU Member States not in OECD - 5-year change | 1698 |
bop_exms6_q %>%
  left_join(bop_item, by = "bop_item") %>%
  group_by(bop_item, Bop_item) %>%
  summarise(Nobs = n()) %>%
  arrange(-Nobs) %>%
print_table_conditional| bop_item | Bop_item | Nobs |
|---|---|---|
| GS | Goods and services | 7736 |
| G | Goods | 7600 |
| S | Services | 7600 |
bop_exms6_q %>%
  left_join(partner, by = "partner") %>%
  group_by(partner, Partner) %>%
  summarise(Nobs = n()) %>%
  arrange(-Nobs) %>%
print_table_conditional| partner | Partner | Nobs |
|---|---|---|
| WRL_REST | Rest of the world | 21787 |
| EXT_EU27_2020 | Extra-EU27 (from 2020) | 633 |
| EXT_EU28 | Extra-EU28 (2013-2020) | 282 |
| EXT_EA20 | Extra-euro area - 20 countries (2023-2025) | 234 |
bop_exms6_q %>%
  left_join(geo, by = "geo") %>%
  group_by(geo, Geo) %>%
  summarise(Nobs = n()) %>%
  arrange(-Nobs) %>%
  mutate(Geo = ifelse(geo == "DE", "Germany", Geo)) %>%
  mutate(Flag = gsub(" ", "-", str_to_lower(Geo)),
         Flag = paste0('<img src="../../bib/flags/vsmall/', Flag, '.png" alt="Flag">')) %>%
  select(Flag, everything()) %>%
{if (is_html_output()) datatable(., filter = 'top', rownames = F, escape = F) else .}bop_exms6_q %>%
group_by(time) %>%
summarise(Nobs = n()) %>%
arrange(desc(time)) %>%
print_table_conditional()bop_exms6_q %>%
filter(geo %in% c("FR", "DE", "IT", "ES", "NL"),
unit == "PC_WRL",
bop_item == "GS") %>%
left_join(geo, by = "geo") %>%
year_to_date %>%
mutate(values = values / 100) %>%
left_join(colors, by = c("Geo" = "country")) %>%
mutate(color = ifelse(geo == "NL", color2, color)) %>%
ggplot + geom_line(aes(x = date, y = values, color = color)) +
scale_color_identity() + theme_minimal() + xlab("") +
ylab("Goods and Services, Market Share (% of World Total)") + add_5flags +
scale_x_date(breaks = as.Date(paste0(seq(1960, 2020, 5), "-01-01")),
labels = date_format("%Y")) +
theme(legend.position = c(0.75, 0.8),
legend.title = element_blank()) +
scale_y_continuous(breaks = 0.01*seq(-30, 30, 1),
labels = percent_format(a = 1))
bop_exms6_q %>%
  filter(geo %in% c("FR", "DE", "IT", "ES", "EU27_2020"),
         unit == "PC_WRL",
         bop_item == "G") %>%
  left_join(geo, by = "geo") %>%
  year_to_date %>%
  filter(date >= as.Date("1995-01-01")) %>%
  mutate(values = values / 100) %>%
  mutate(Geo = ifelse(geo == "EU27_2020", "Europe", Geo)) %>%
  left_join(colors, by = c("Geo" = "country")) %>%
  mutate(color = ifelse(geo == "NL", color2, color)) %>%
  ggplot + geom_line(aes(x = date, y = values, color = color)) +
  scale_color_identity() + theme_minimal()  + xlab("") +
  ylab("Biens, Parts de Marché (% du Monde)") + add_5flags +
  scale_x_date(breaks = as.Date(paste0(seq(1960, 2020, 5), "-01-01")),
               labels = date_format("%Y")) +
  theme(legend.position = c(0.75, 0.8),
        legend.title = element_blank()) +
  scale_y_continuous(breaks = 0.01*seq(-30, 30, 1),
                labels = percent_format(a = 1))
bop_exms6_q %>%
  filter(geo %in% c("FR", "DE", "IT", "ES", "NL"),
         unit == "PC_WRL",
         bop_item == "S") %>%
  left_join(geo, by = "geo") %>%
  year_to_date %>%
  mutate(values = values / 100) %>%
  left_join(colors, by = c("Geo" = "country")) %>%
  mutate(color = ifelse(geo == "NL", color2, color)) %>%
  ggplot + geom_line(aes(x = date, y = values, color = color)) +
  scale_color_identity() + theme_minimal()  + xlab("") +
  ylab("Goods, Market Share (% of World Total)") + add_5flags +
  scale_x_date(breaks = as.Date(paste0(seq(1960, 2020, 5), "-01-01")),
               labels = date_format("%Y")) +
  theme(legend.position = c(0.75, 0.8),
        legend.title = element_blank()) +
  scale_y_continuous(breaks = 0.01*seq(-30, 30, 1),
                labels = percent_format(a = 1))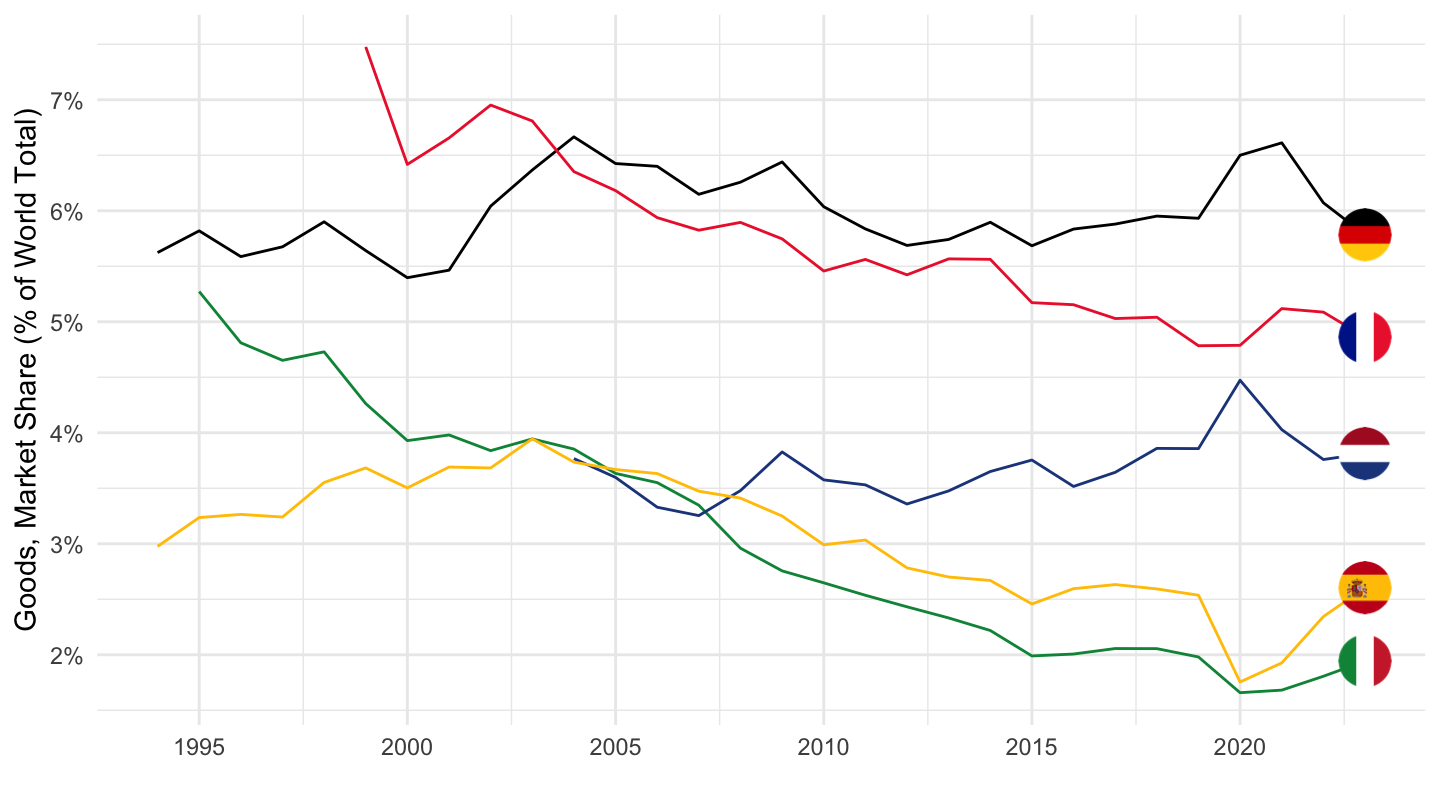
bop_exms6_q %>%
  filter(geo == "FR",
         unit == "PC_WRL") %>%
  left_join(bop_item, by = "bop_item") %>%
  year_to_date %>%
  mutate(values = values / 100) %>%
  ggplot + geom_line(aes(x = date, y = values, color = Bop_item)) +
  scale_color_manual(values = viridis(4)[1:3]) +
  theme_minimal()  + xlab("") + ylab("") +
  scale_x_date(breaks = as.Date(paste0(seq(1960, 2020, 5), "-01-01")),
               labels = date_format("%Y")) +
  theme(legend.position = c(0.75, 0.8),
        legend.title = element_blank()) +
  scale_y_continuous(breaks = 0.01*seq(-30, 30, 1),
                labels = percent_format(a = 1))
bop_exms6_q %>%
  filter(geo == "DE",
         unit == "PC_WRL") %>%
  left_join(bop_item, by = "bop_item") %>%
  year_to_date %>%
  mutate(values = values / 100) %>%
  ggplot + geom_line(aes(x = date, y = values, color = Bop_item)) +
  scale_color_manual(values = viridis(4)[1:3]) +
  theme_minimal()  + xlab("") + ylab("") +
  scale_x_date(breaks = as.Date(paste0(seq(1960, 2020, 5), "-01-01")),
               labels = date_format("%Y")) +
  theme(legend.position = c(0.75, 0.8),
        legend.title = element_blank()) +
  scale_y_continuous(breaks = 0.01*seq(-30, 30, 1),
                labels = percent_format(a = 1))
bop_exms6_q %>%
  filter(geo == "IT",
         unit == "PC_WRL") %>%
  left_join(bop_item, by = "bop_item") %>%
  year_to_date %>%
  mutate(values = values / 100) %>%
  ggplot + geom_line(aes(x = date, y = values, color = Bop_item)) +
  scale_color_manual(values = viridis(4)[1:3]) +
  theme_minimal()  + xlab("") + ylab("") +
  scale_x_date(breaks = as.Date(paste0(seq(1960, 2020, 5), "-01-01")),
               labels = date_format("%Y")) +
  theme(legend.position = c(0.75, 0.8),
        legend.title = element_blank()) +
  scale_y_continuous(breaks = 0.01*seq(-30, 30, 1),
                labels = percent_format(a = 1))