| source | dataset | Title | .html | .rData |
|---|---|---|---|---|
| ec | CONSUMPTION | Consumption - CONSUMPTION | 2026-07-24 | 2026-07-24 |
Consumption - CONSUMPTION
Data - ec
Info
sector
Code
CONSUMPTION %>%
  group_by(sector, Sector) %>%
  summarise(Nobs = n()) %>%
print_table_conditional| sector | Sector | Nobs |
|---|---|---|
| TOT | TOTAL Consumer | 322734 |
question
Code
CONSUMPTION %>%
  group_by(question, Questions) %>%
  summarise(Nobs = n()) %>%
print_table_conditional| question | Questions | Nobs |
|---|---|---|
| 1 | Financial situation over last 12 months | 23419 |
| 10 | Savings at present | 22597 |
| 11 | Savings over next 12 months | 23162 |
| 12 | Statement on financial situation of household | 23169 |
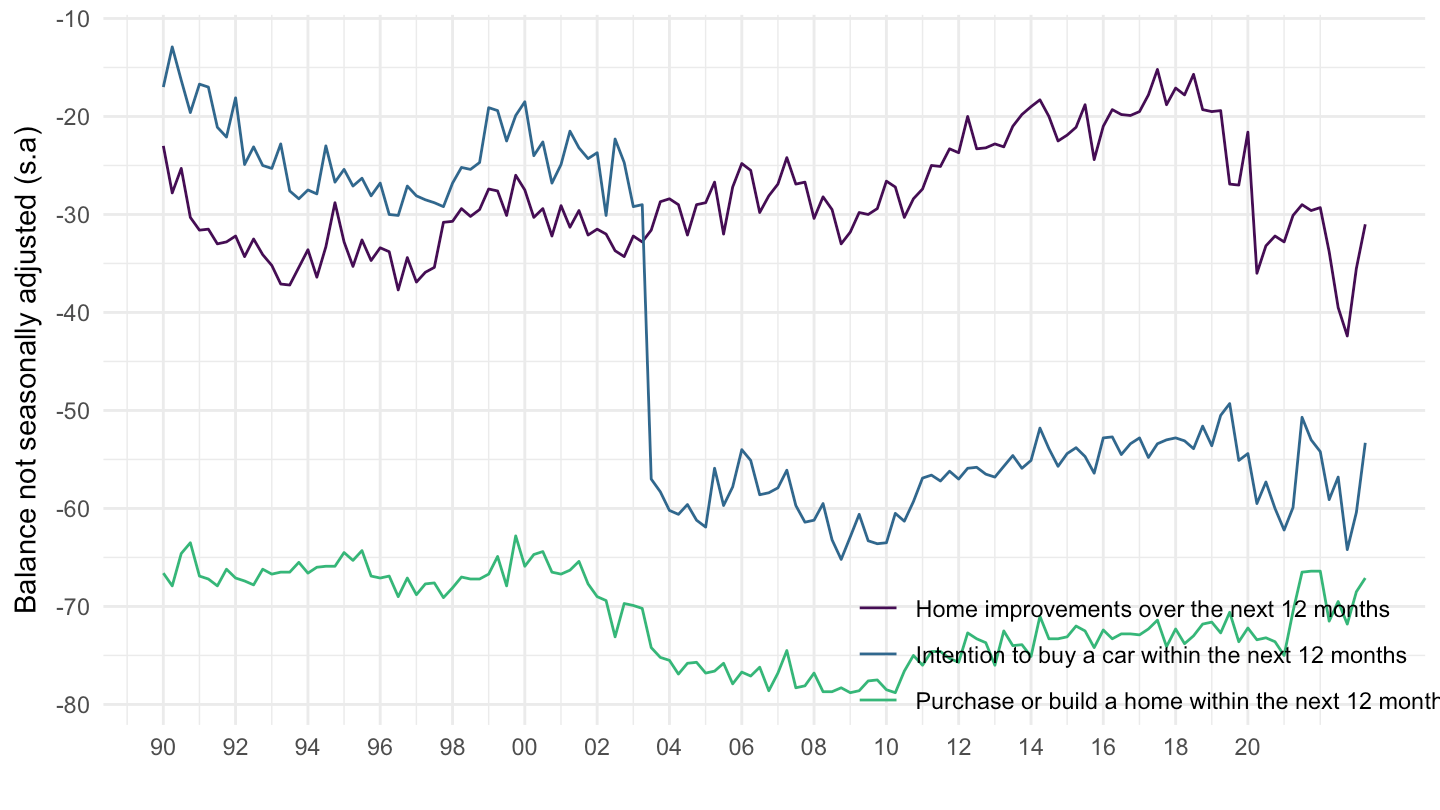
| 13 | Intention to buy a car within the next 12 months | 6934 |
| 14 | Purchase or build a home within the next 12 months | 6864 |
| 15 | Home improvements over the next 12 months | 6926 |
| 2 | Financial situation over next 12 months | 23419 |
| 3 | General economic situation over last 12 months | 23419 |
| 4 | General economic situation over next 12 months | 23419 |
| 5 | Price trends over last 12 months | 23172 |
| 6 | Price trends over next 12 months | 23172 |
| 7 | Unemployment expectations over next 12 months | 23374 |
| 8 | Major purchases at present | 23334 |
| 9 | Major purchases over next 12 months | 23177 |
| COF | Confidence Indicator (Q1 + Q2 + Q4 + Q9) / 4 | 23177 |
answers
Code
CONSUMPTION %>%
  group_by(answers, Answers) %>%
  summarise(Nobs = n()) %>%
print_table_conditional| answers | Answers | Nobs |
|---|---|---|
| B | Balance not seasonally adjusted (n.s.a) | 161890 |
| BS | Balance seasonally adjusted (s.a) | 160844 |
country
Code
CONSUMPTION %>%
  group_by(country, Country) %>%
  summarise(Nobs = n()) %>%
  mutate(Flag = gsub(" ", "-", str_to_lower(gsub(" ", "-", Country))),
         Flag = paste0('<img src="../../icon/flag/vsmall/', Flag, '.png" alt="Flag">')) %>%
  select(Flag, everything()) %>%
  {if (is_html_output()) datatable(., filter = 'top', rownames = F, escape = F) else .}
freq
Code
CONSUMPTION %>%
  group_by(freq, Frequency) %>%
  summarise(Nobs = n()) %>%
print_table_conditional| freq | Frequency | Nobs |
|---|---|---|
| M | Monthly | 302010 |
| Q | Quarterly | 20724 |
Germany
Home improvements, Intention to buy a car, Purchase or build a home
Code
CONSUMPTION %>%
  filter(country == "DE",
         question %in% c("13", "14", "15"),
         answers == "B") %>%
  ggplot + theme_minimal() + xlab("") + ylab("Balance not seasonally adjusted (s.a)") +
  geom_line(aes(x = period, y = value, color = Questions)) +
  scale_x_date(breaks = as.Date(paste0(seq(1960, 2100, 5), "-01-01")),
               labels = date_format("%Y")) +
  theme(legend.position = c(0.8, 0.1),
        legend.title = element_blank()) +
  scale_y_continuous(breaks = seq(-200, 60, 10))