Last observation: 2025 (N = 68)
First observation: 2006 (N = 1)
Last data update: 19 oct. 2026, 23:31
Last compile: 19 oct. 2026, 23:31
Source : DSED, ministère de l’Intérieur (sous-direction des visas, SDV). Champ : France, toutes nationalités. Colonne tableau : Général, Court séjour par motif, Long séjour total, Long séjour par motif, Passeport talent, Nationalités (15 premières).
`la-delivrance-de-visas-aux-etrangers` |>
  filter(tableau == "Général", categorie %in% c("Total visas demandés", "Total visas délivrés", "Visas refusés")) |>
  ggplot(aes(x = date, y = value / 1e6, color = categorie)) +
  geom_line() + geom_point(size = 0.8) + theme_minimal() +
  xlab("") + ylab("Millions de visas") +
  scale_x_date(date_breaks = "2 years", labels = date_format("%Y")) +
  theme(legend.position = "bottom", legend.title = element_blank())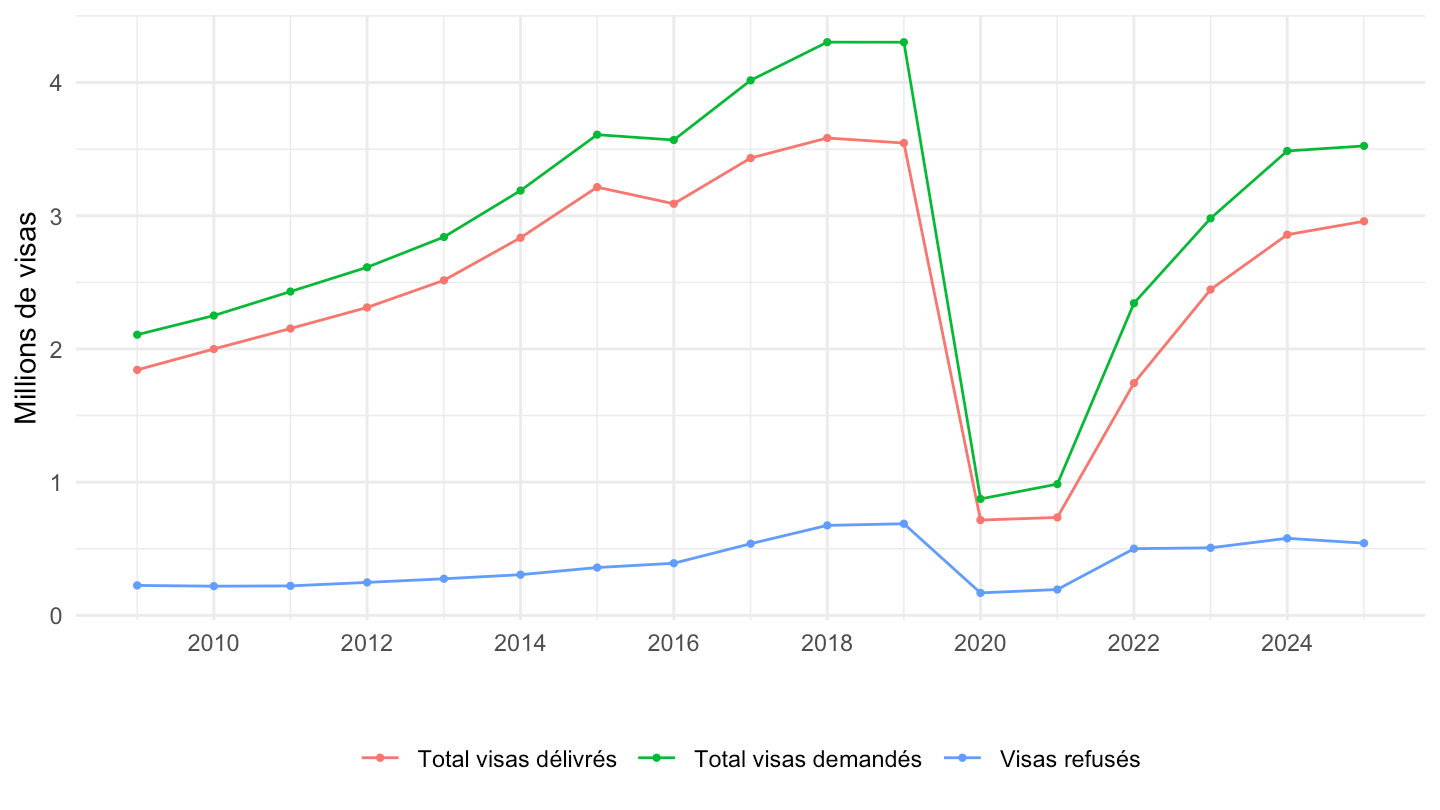
`la-delivrance-de-visas-aux-etrangers` |>
  filter(tableau == "Général", categorie %in% c("Total visas demandés", "Visas refusés")) |>
  select(date, categorie, value) |>
  pivot_wider(names_from = categorie, values_from = value) |>
  ggplot(aes(x = date, y = `Visas refusés` / `Total visas demandés`)) +
  geom_line() + geom_point() + theme_minimal() + xlab("") +
  ylab("Visas refusés / visas demandés") +
  scale_x_date(date_breaks = "2 years", labels = date_format("%Y")) +
  scale_y_continuous(labels = percent_format(accuracy = 1), limits = c(0, NA))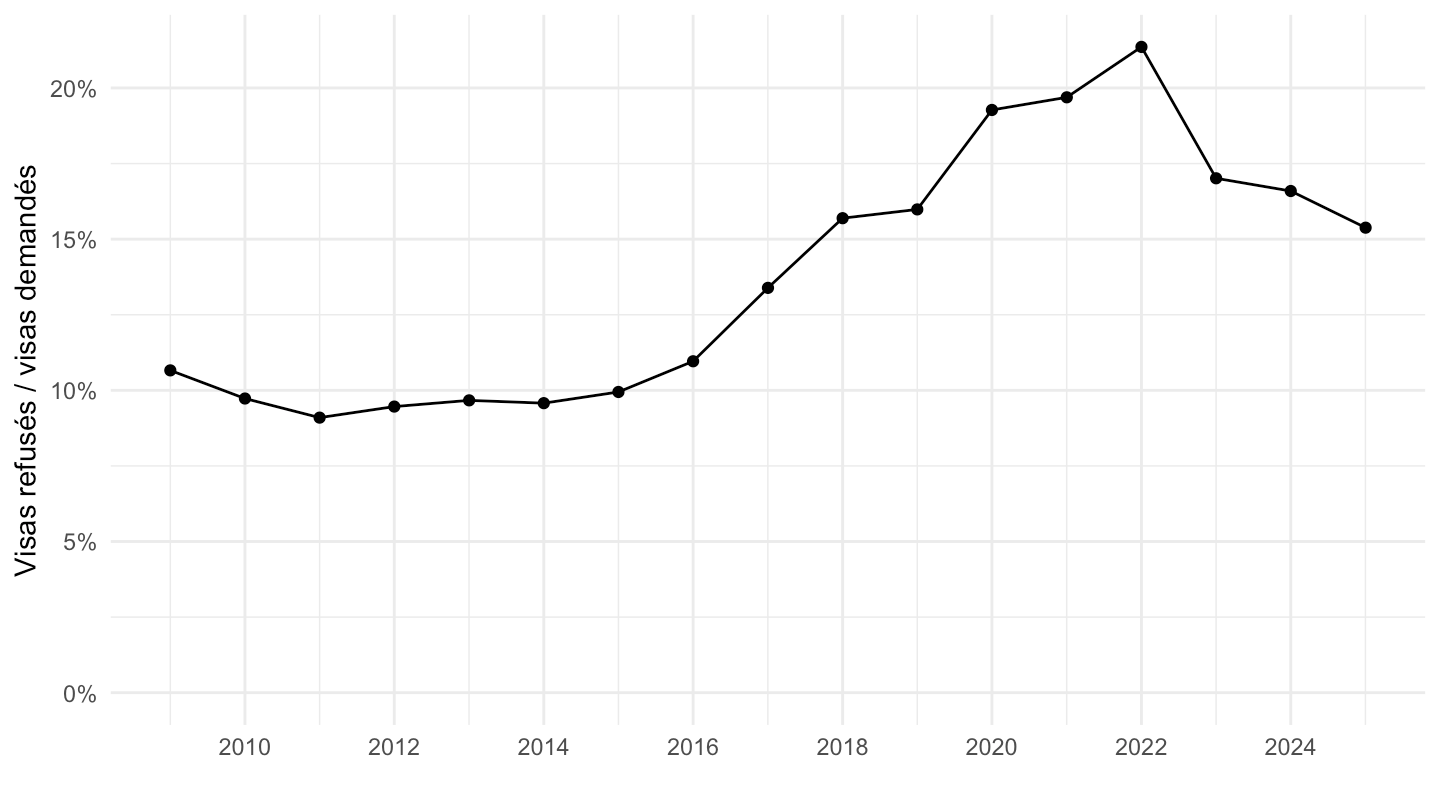
`la-delivrance-de-visas-aux-etrangers` |>
  filter(tableau == "Général", str_detect(categorie, "^Visas délivrés - ")) |>
  mutate(categorie = str_remove(categorie, "^Visas délivrés - ")) |>
  ggplot(aes(x = date, y = value / 1e6, fill = categorie)) +
  geom_area() + theme_minimal() + xlab("") + ylab("Millions de visas délivrés") +
  scale_x_date(date_breaks = "2 years", labels = date_format("%Y")) +
  theme(legend.position = "bottom", legend.title = element_blank())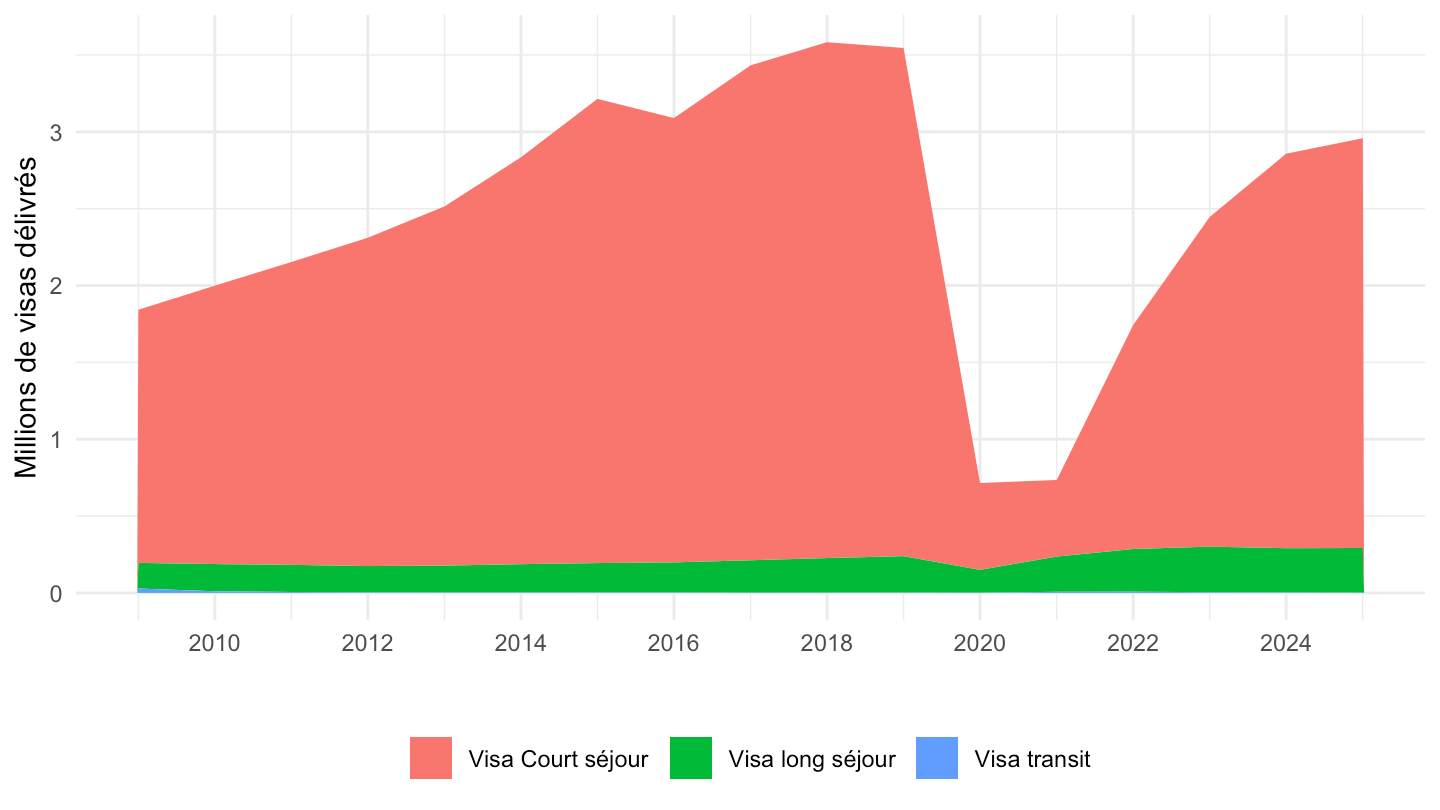
`la-delivrance-de-visas-aux-etrangers` |>
  filter(tableau == "Court séjour par motif", sous_categorie == "Visas délivrés", categorie != "Total") |>
  ggplot(aes(x = date, y = value / 1e6, fill = categorie)) +
  geom_area() + theme_minimal() + xlab("") + ylab("Millions de visas de court séjour délivrés") +
  scale_x_date(date_breaks = "2 years", labels = date_format("%Y")) +
  theme(legend.position = "bottom", legend.title = element_blank())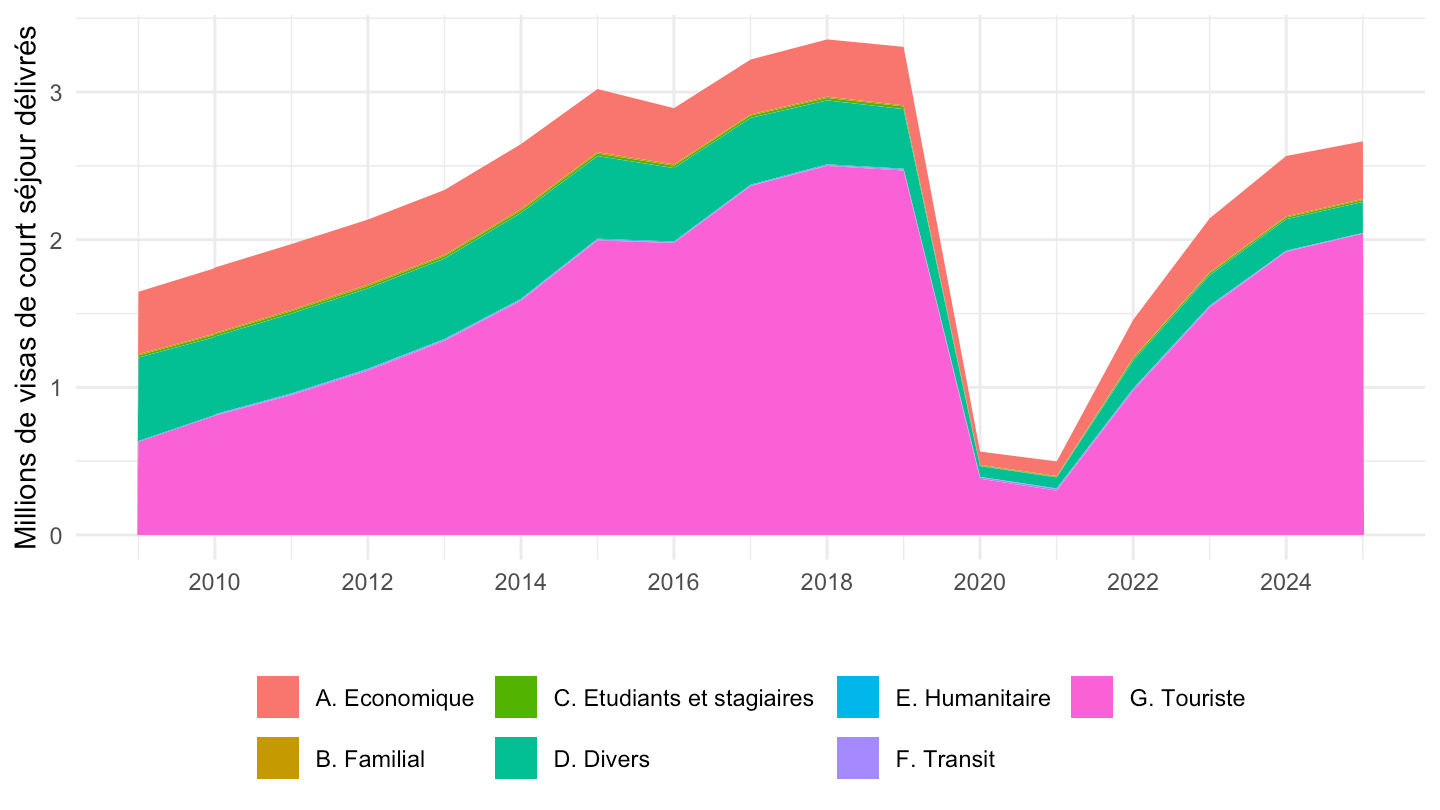
`la-delivrance-de-visas-aux-etrangers` |>
  filter(tableau == "Court séjour par motif", categorie == "Total") |>
  select(date, sous_categorie, value) |>
  pivot_wider(names_from = sous_categorie, values_from = value) |>
  ggplot(aes(x = date, y = `dont visas de circulation` / `Visas délivrés`)) +
  geom_line() + geom_point() + theme_minimal() + xlab("") +
  ylab("Visas de circulation / visas de court séjour délivrés") +
  scale_x_date(date_breaks = "2 years", labels = date_format("%Y")) +
  scale_y_continuous(labels = percent_format(accuracy = 1), limits = c(0, NA))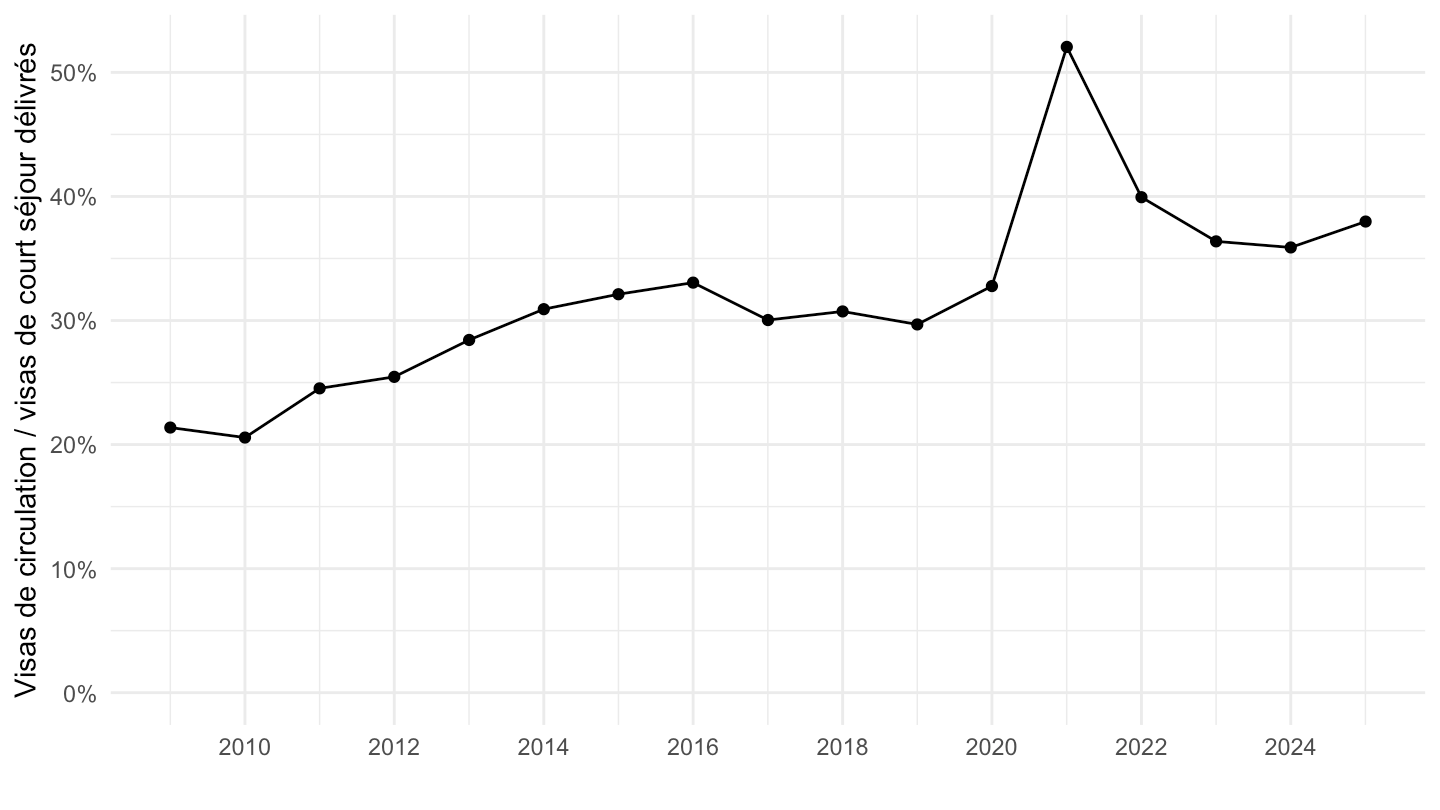
`la-delivrance-de-visas-aux-etrangers` |>
  filter(tableau == "Long séjour total") |>
  ggplot(aes(x = date, y = value / 1e3, color = categorie)) +
  geom_line() + geom_point(size = 0.8) + theme_minimal() +
  xlab("") + ylab("Milliers de visas de long séjour") +
  scale_x_date(date_breaks = "2 years", labels = date_format("%Y")) +
  theme(legend.position = "bottom", legend.title = element_blank())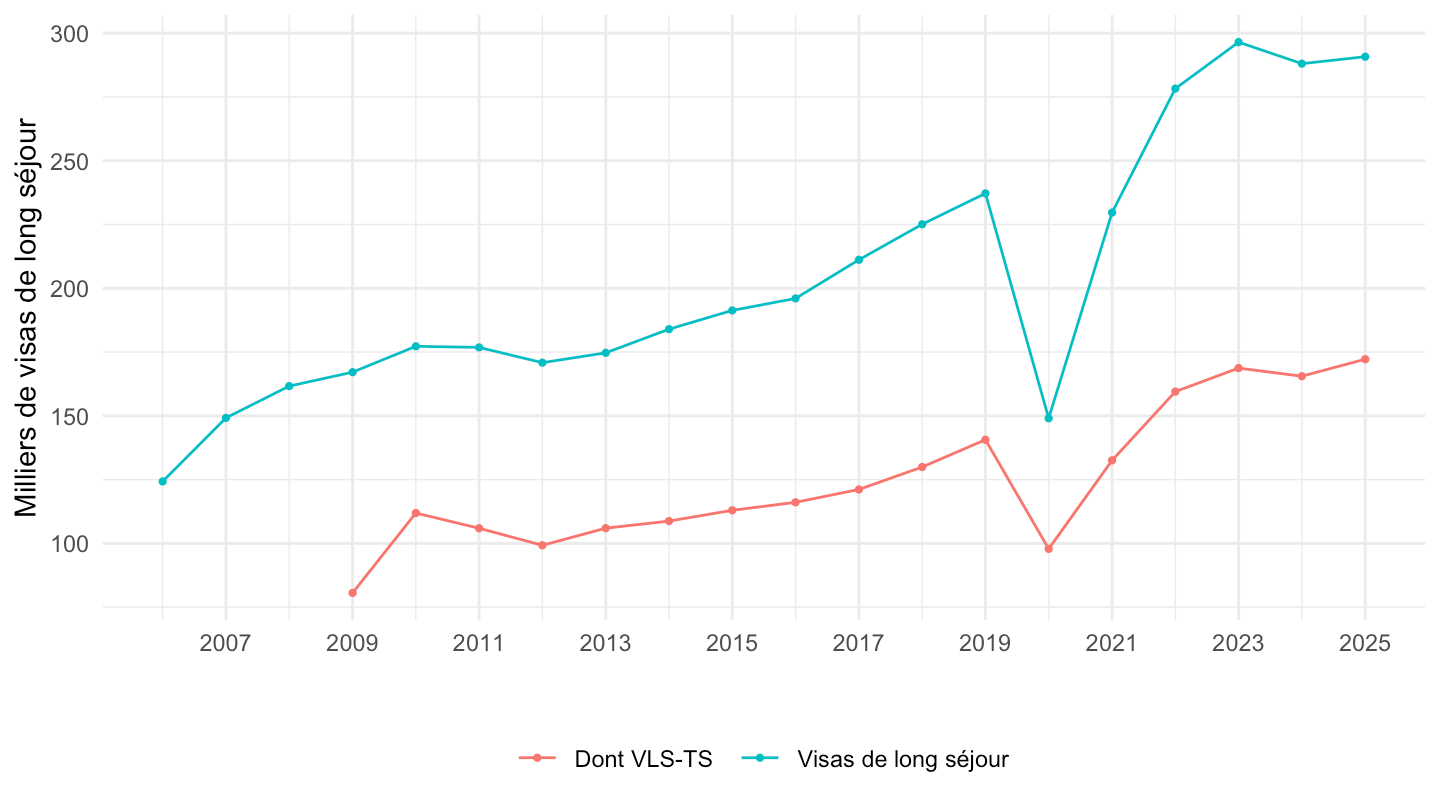
`la-delivrance-de-visas-aux-etrangers` |>
  filter(tableau == "Long séjour par motif", str_starts(motif, "Total"), motif != "Total général") |>
  mutate(motif = str_remove(motif, "^Total ")) |>
  ggplot(aes(x = date, y = value / 1e3, color = motif)) +
  geom_line() + geom_point(size = 0.8) + theme_minimal() +
  xlab("") + ylab("Milliers de visas de long séjour") +
  scale_x_date(date_breaks = "2 years", labels = date_format("%Y")) +
  theme(legend.position = "bottom", legend.title = element_blank())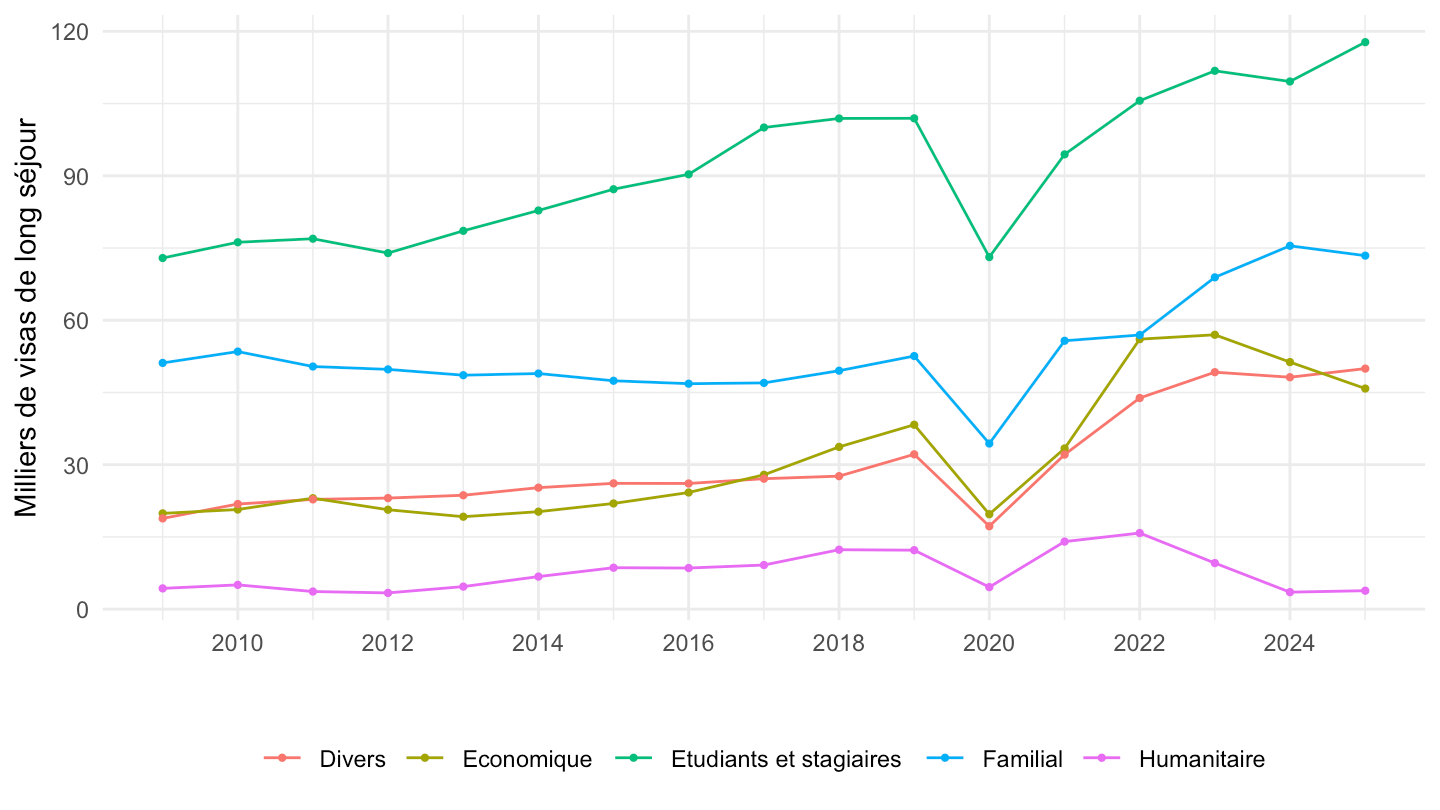
`la-delivrance-de-visas-aux-etrangers` |>
  filter(tableau == "Passeport talent", !str_starts(motif, "Total")) |>
  ggplot(aes(x = date, y = value / 1e3, fill = categorie)) +
  geom_col() + theme_minimal() + xlab("") + ylab("Milliers de visas") +
  scale_x_date(date_breaks = "1 year", labels = date_format("%Y")) +
  theme(legend.position = "bottom", legend.title = element_blank())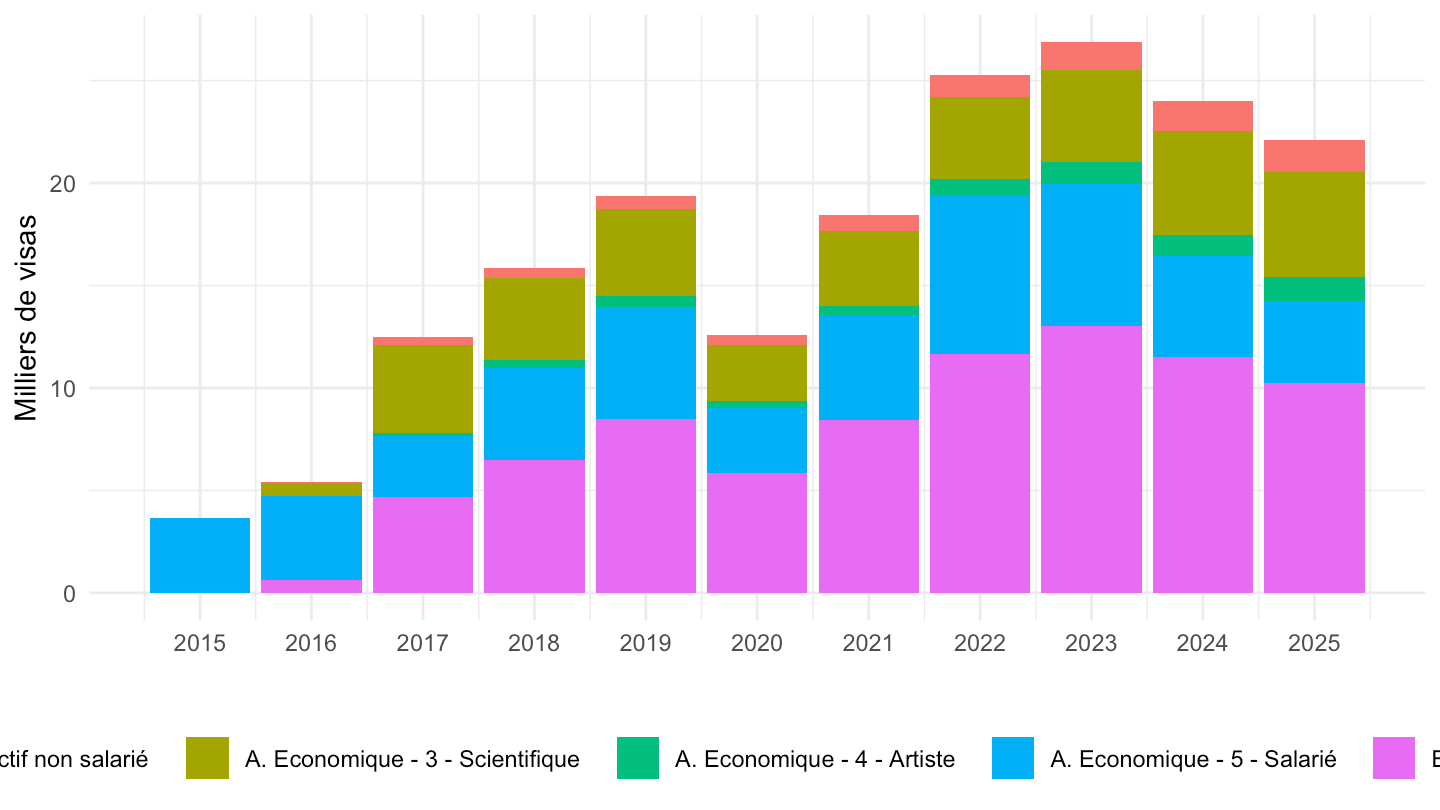
`la-delivrance-de-visas-aux-etrangers` |>
  filter(tableau == "Nationalités (15 premières)", annee == 2025) |>
  mutate(categorie = fct_reorder(str_to_title(categorie), value)) |>
  ggplot(aes(x = categorie, y = value / 1e3)) +
  geom_col(fill = "#2166ac") + coord_flip() + theme_minimal() +
  xlab("") + ylab("Milliers de visas délivrés")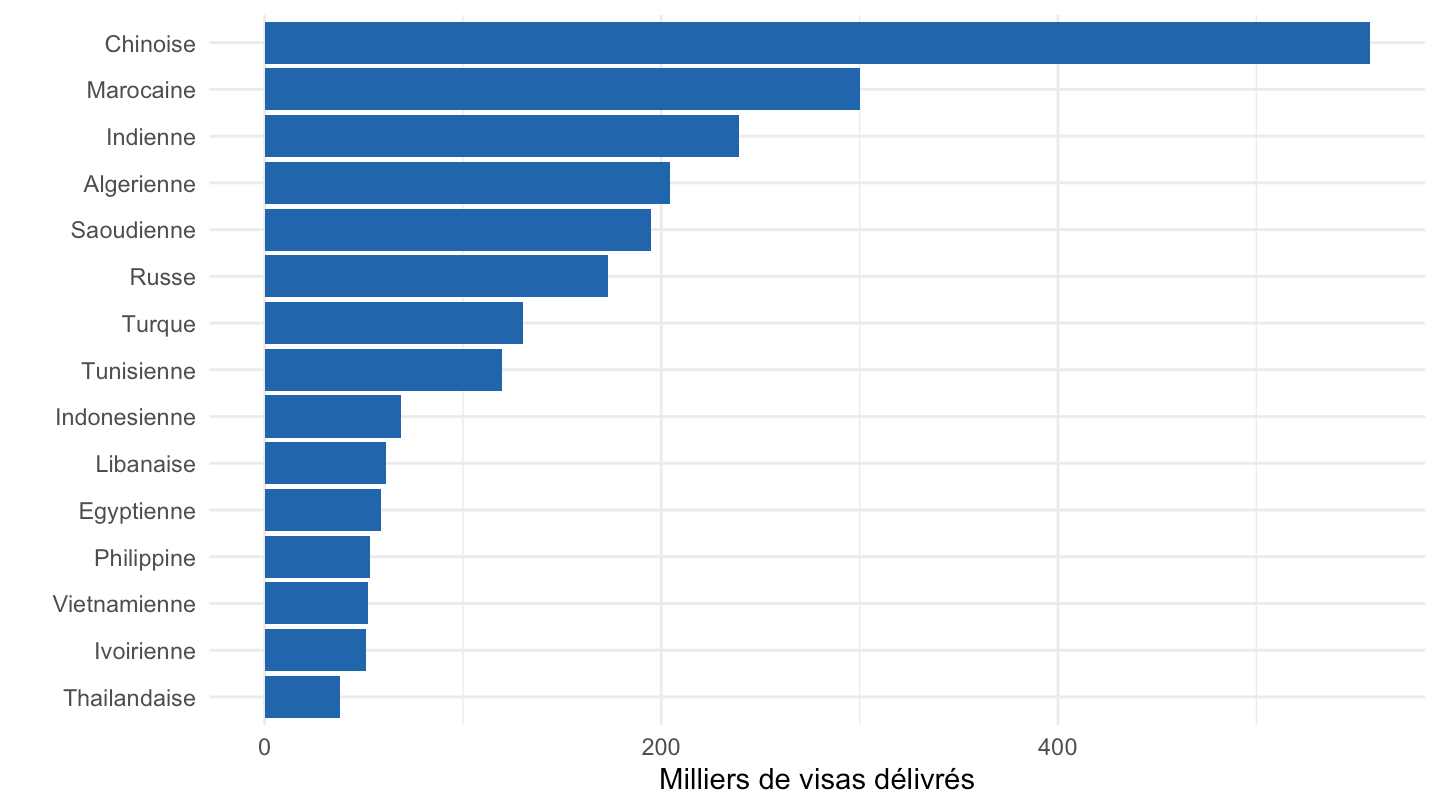
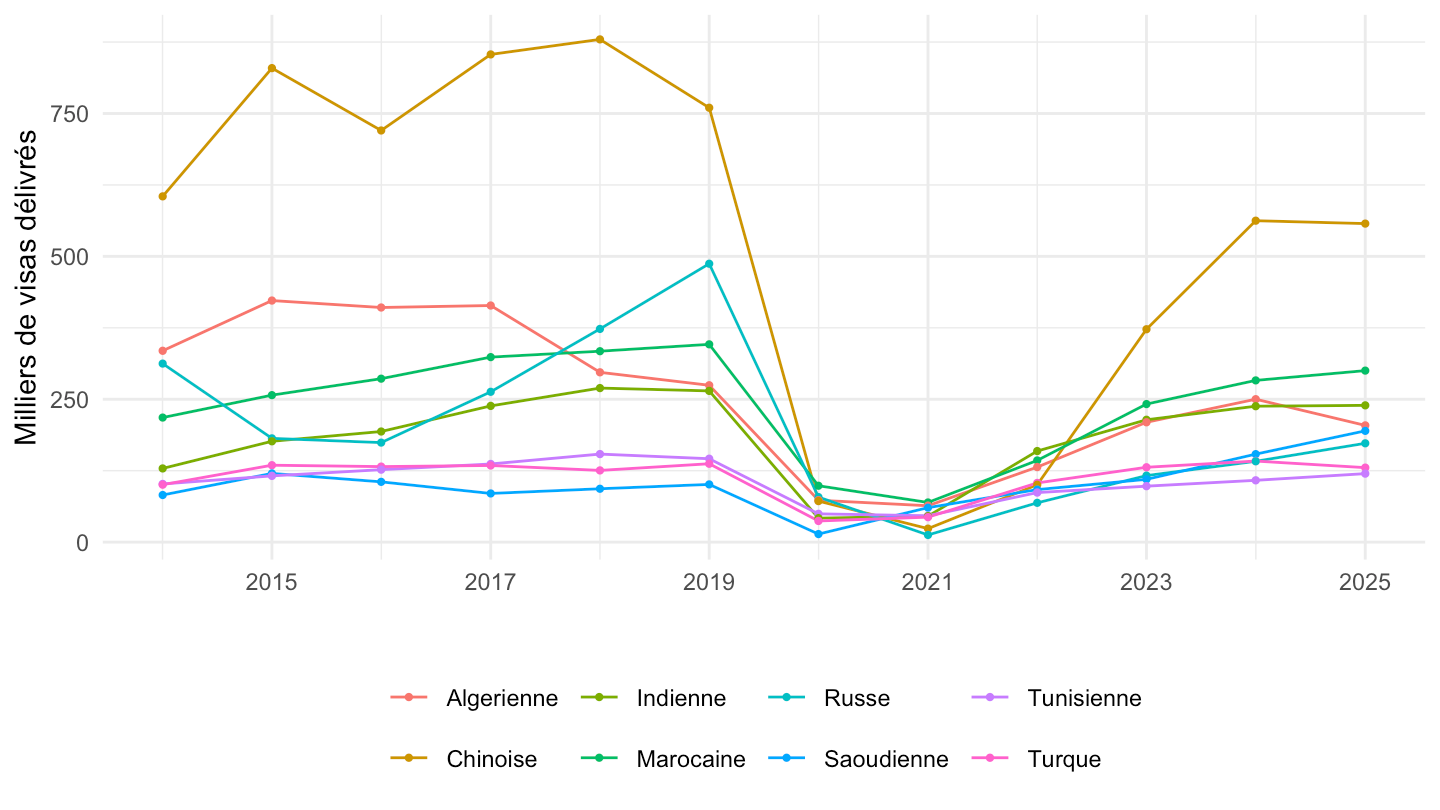
principales <- c("CHINOISE", "MAROCAINE", "ALGERIENNE", "INDIENNE", "RUSSE", "SAOUDIENNE", "TURQUE", "TUNISIENNE")
`la-delivrance-de-visas-aux-etrangers` |>
  filter(tableau == "Nationalités (15 premières)", categorie %in% principales) |>
  mutate(categorie = str_to_title(categorie)) |>
  ggplot(aes(x = date, y = value / 1e3, color = categorie)) +
  geom_line() + geom_point(size = 0.8) + theme_minimal() +
  xlab("") + ylab("Milliers de visas délivrés") +
  scale_x_date(date_breaks = "2 years", labels = date_format("%Y")) +
  theme(legend.position = "bottom", legend.title = element_blank())