Last data update: 21 sept. 2026, 15:49
Last compile: 10 oct. 2026, 00:16
mc_cat |>
  filter(is.na(varpartition), vargroupage == "classeAge10") |>
  group_by(type, catlib) |>
  summarise(taux = weighted.mean(txstanddir, poids1), .groups = "drop") |>
  ggplot() +
  geom_col(aes(x = reorder(catlib, taux), y = taux, fill = type), position = "dodge") +
  coord_flip() +
  theme_minimal() + xlab("") + ylab("Taux standardisé (France entière)") +
  scale_y_continuous(labels = percent_format(accuracy = 0.1)) +
  scale_fill_viridis_d() +
  theme(legend.position = "bottom", legend.title = element_blank())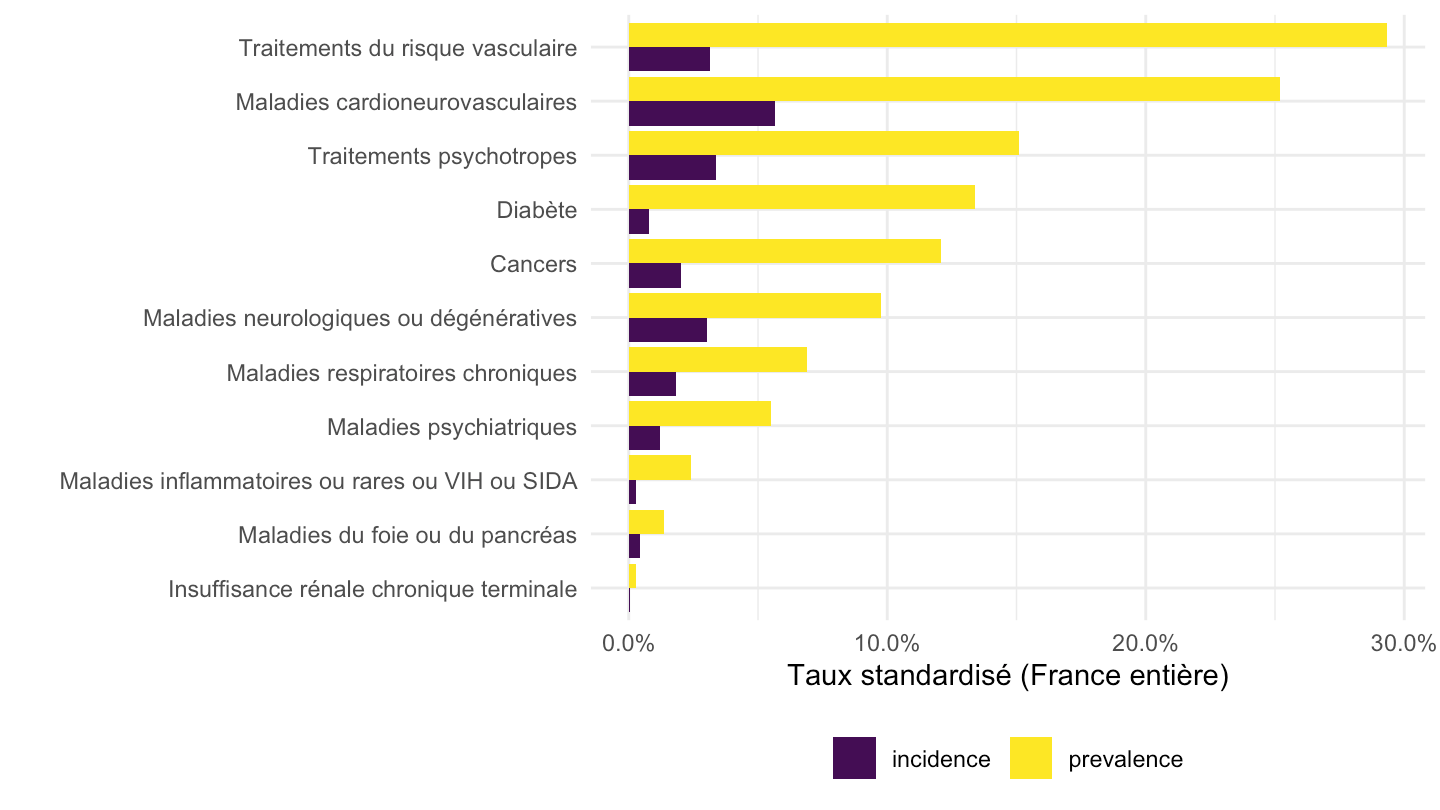
mc_cat |>
  filter(type == "prevalence", is.na(varpartition), vargroupage == "FISC_NIVVIEM_E2015_S_moy_10") |>
  mutate(decile = as.integer(valgroupage)) |>
  ggplot() +
  geom_line(aes(x = decile, y = txstanddir, color = catlib)) +
  geom_point(aes(x = decile, y = txstanddir, color = catlib), size = 0.8) +
  facet_wrap(~catlib, scales = "free_y", labeller = labeller(catlib = scales::label_wrap(20))) +
  theme_minimal() + xlab("Décile de niveau de vie (1 = plus modeste)") + ylab("Prévalence standardisée") +
  scale_x_continuous(breaks = 1:10) +
  scale_y_continuous(labels = percent_format(accuracy = 0.1)) +
  scale_color_viridis_d() +
  theme(legend.position = "none",
        strip.text = element_text(size = 7.5),
        axis.text.x = element_text(size = 6))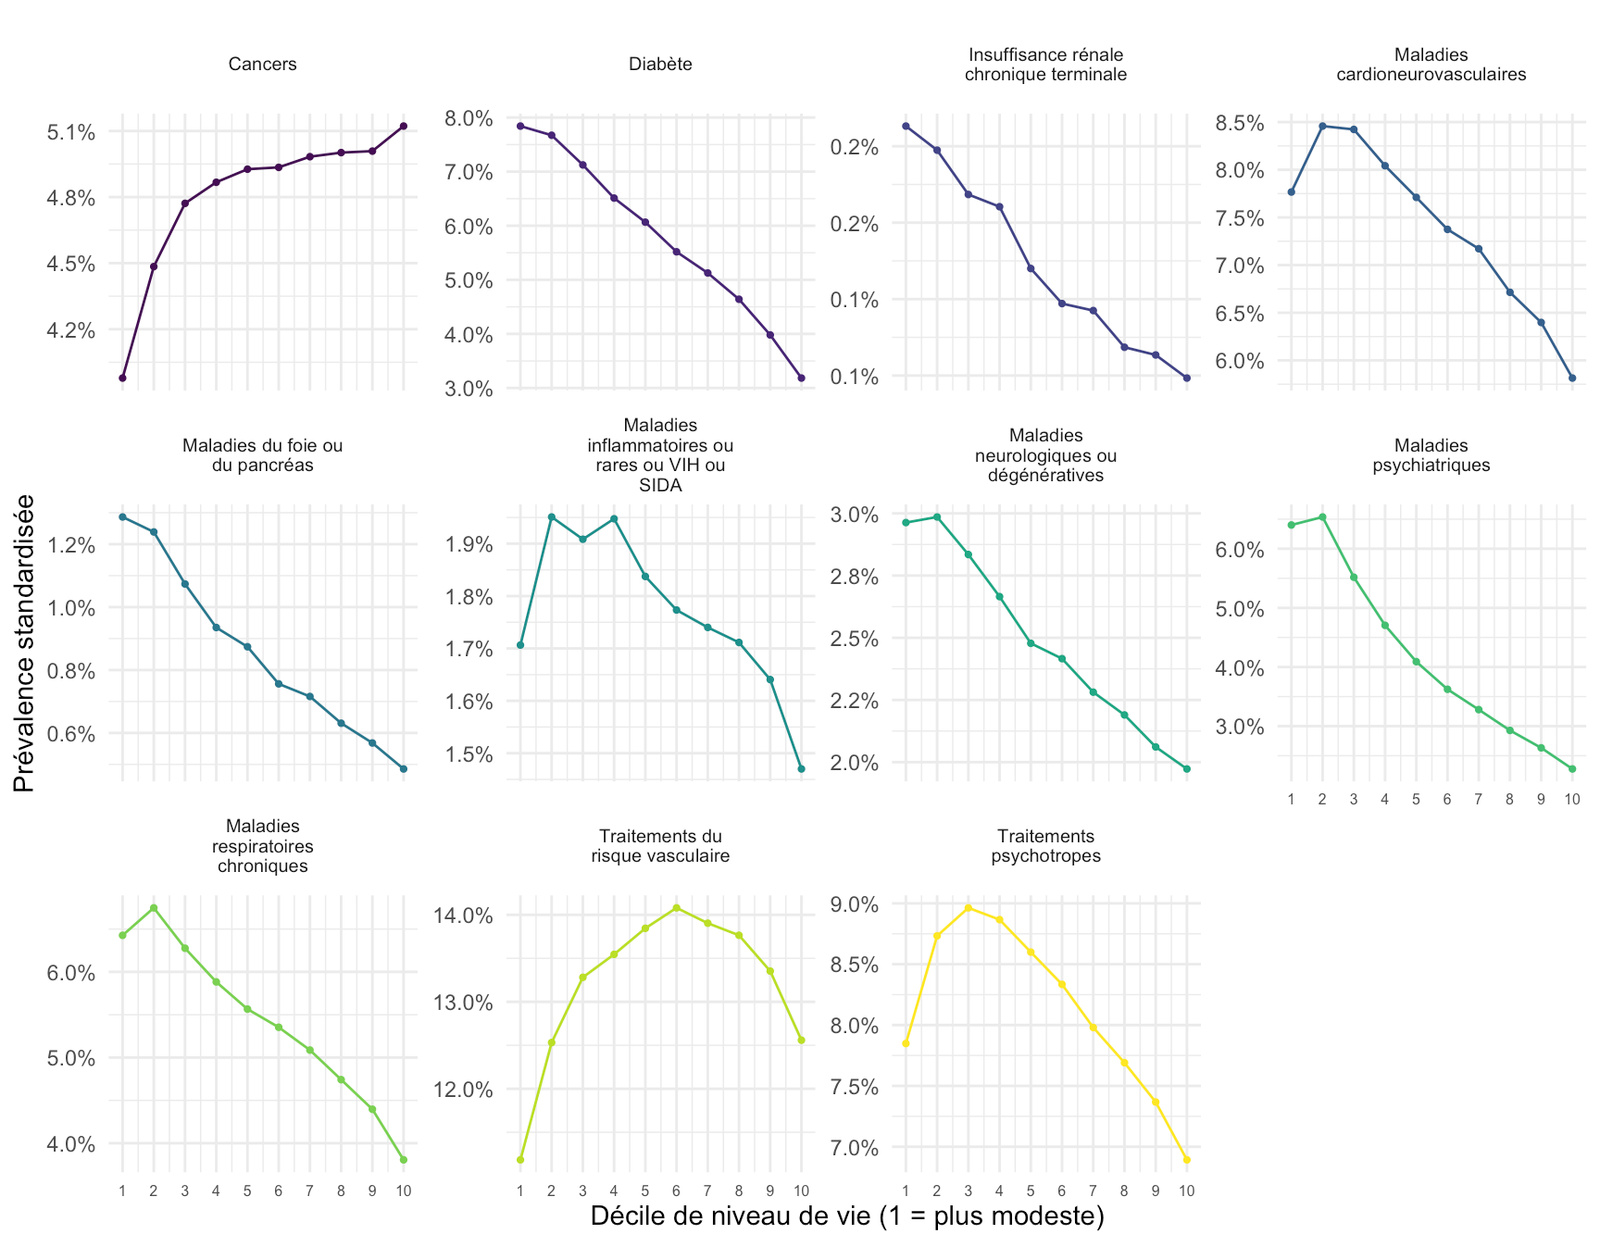
mc_cat |>
  filter(type == "prevalence", is.na(varpartition), vargroupage == "SEXE") |>
  mutate(sexe = recode(valgroupage, F = "Femmes", M = "Hommes")) |>
  ggplot() +
  geom_col(aes(x = reorder(catlib, txstanddir), y = txstanddir, fill = sexe), position = "dodge") +
  coord_flip() +
  theme_minimal() + xlab("") + ylab("Prévalence standardisée") +
  scale_y_continuous(labels = percent_format(accuracy = 0.1)) +
  scale_fill_viridis_d() +
  theme(legend.position = "bottom", legend.title = element_blank())
mc_cat |>
  filter(type == "prevalence", is.na(varpartition), vargroupage == "classeAge10") |>
  mutate(classe_age = factor(valgroupage, levels = age_levels)) |>
  ggplot() +
  geom_line(aes(x = classe_age, y = txstanddir, color = catlib, group = catlib)) +
  theme_minimal() + xlab("") + ylab("Prévalence standardisée") +
  scale_y_continuous(labels = percent_format(accuracy = 0.1)) +
  scale_color_viridis_d() +
  theme(legend.position = "bottom", legend.title = element_blank()) +
  guides(color = guide_legend(nrow = 4))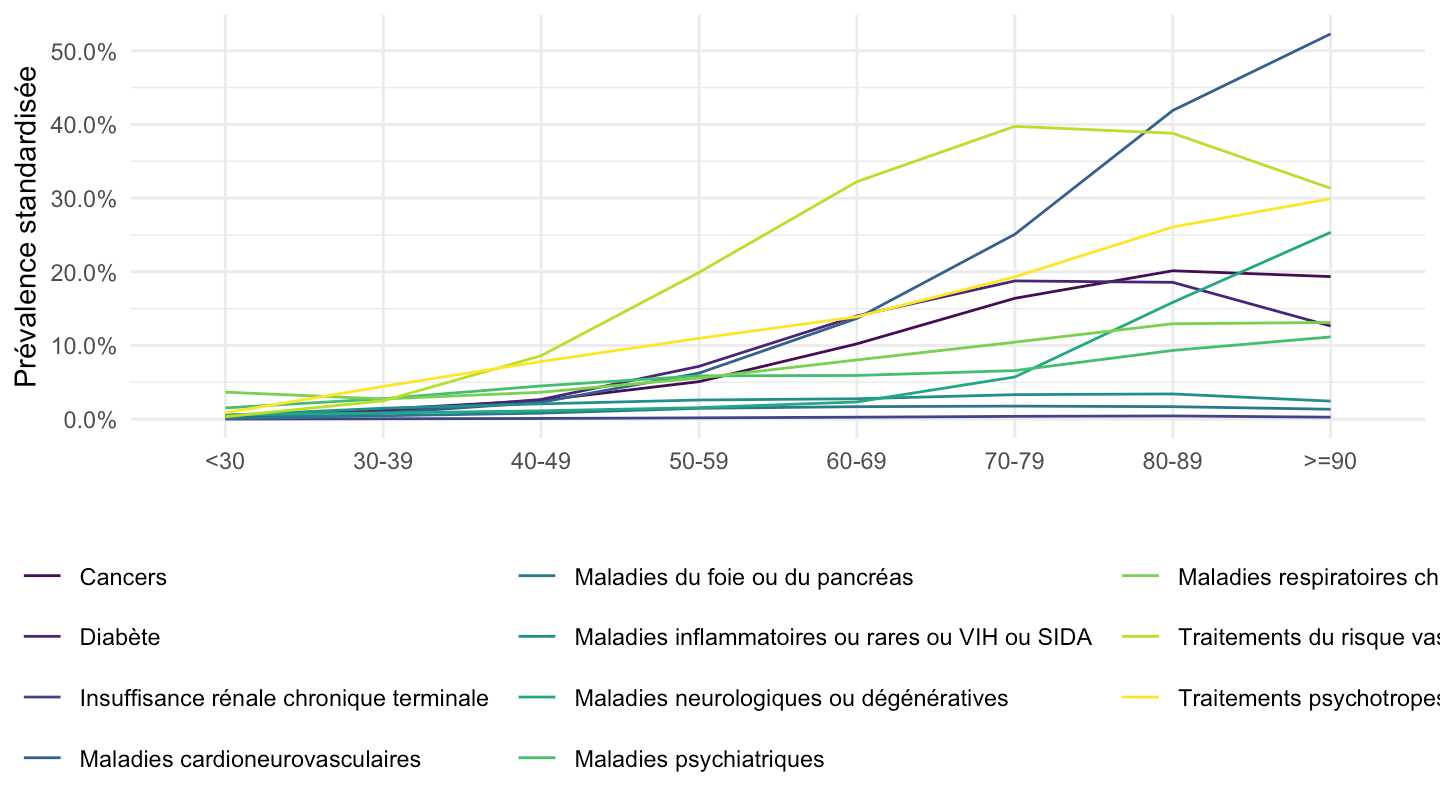
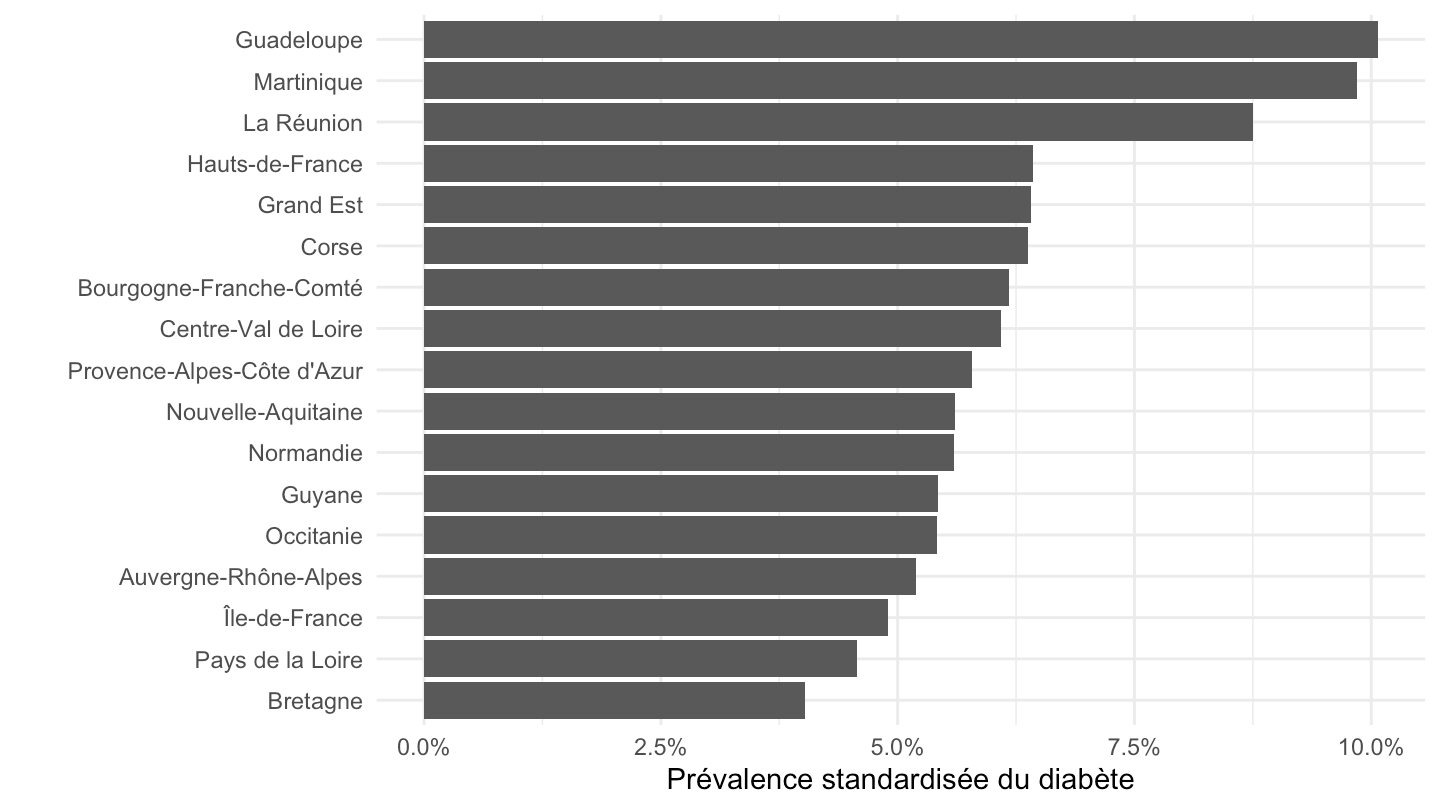
mc_cat |>
  filter(type == "prevalence", vartauxlib == "Diabète", varpartition == "FISC_REG_S", is.na(vargroupage)) |>
  mutate(region = recode(valpartition, !!!reg_labels)) |>
  ggplot() +
  geom_col(aes(x = reorder(region, txstanddir), y = txstanddir)) +
  coord_flip() +
  theme_minimal() + xlab("") + ylab("Prévalence standardisée du diabète") +
  scale_y_continuous(labels = percent_format(accuracy = 0.1))