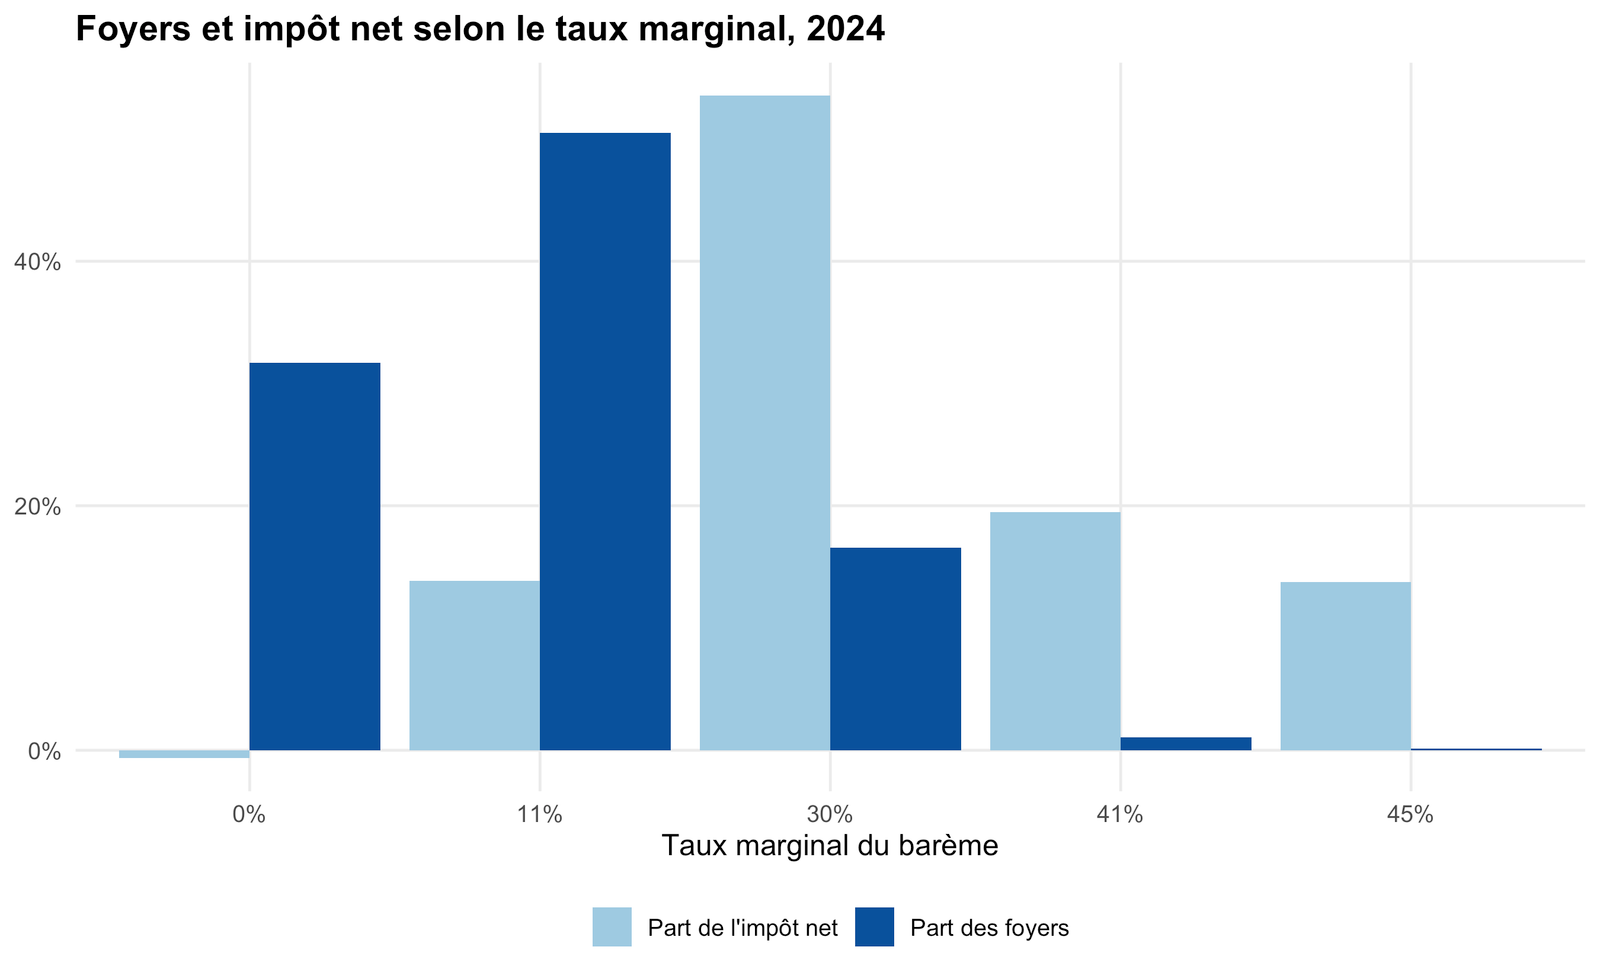
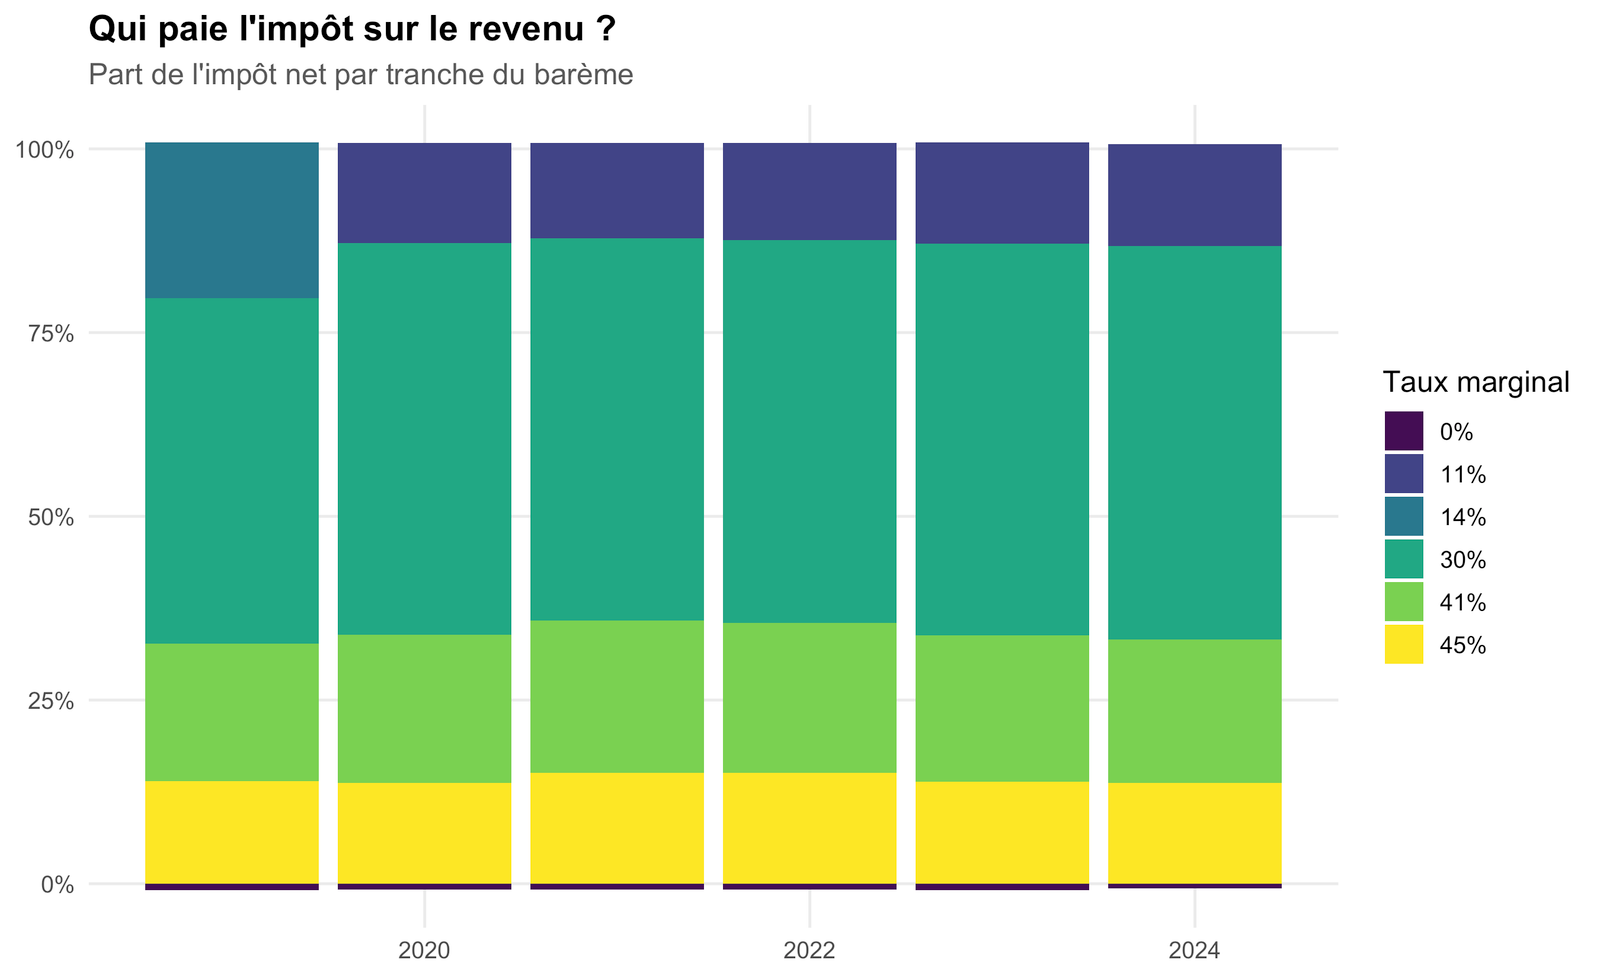
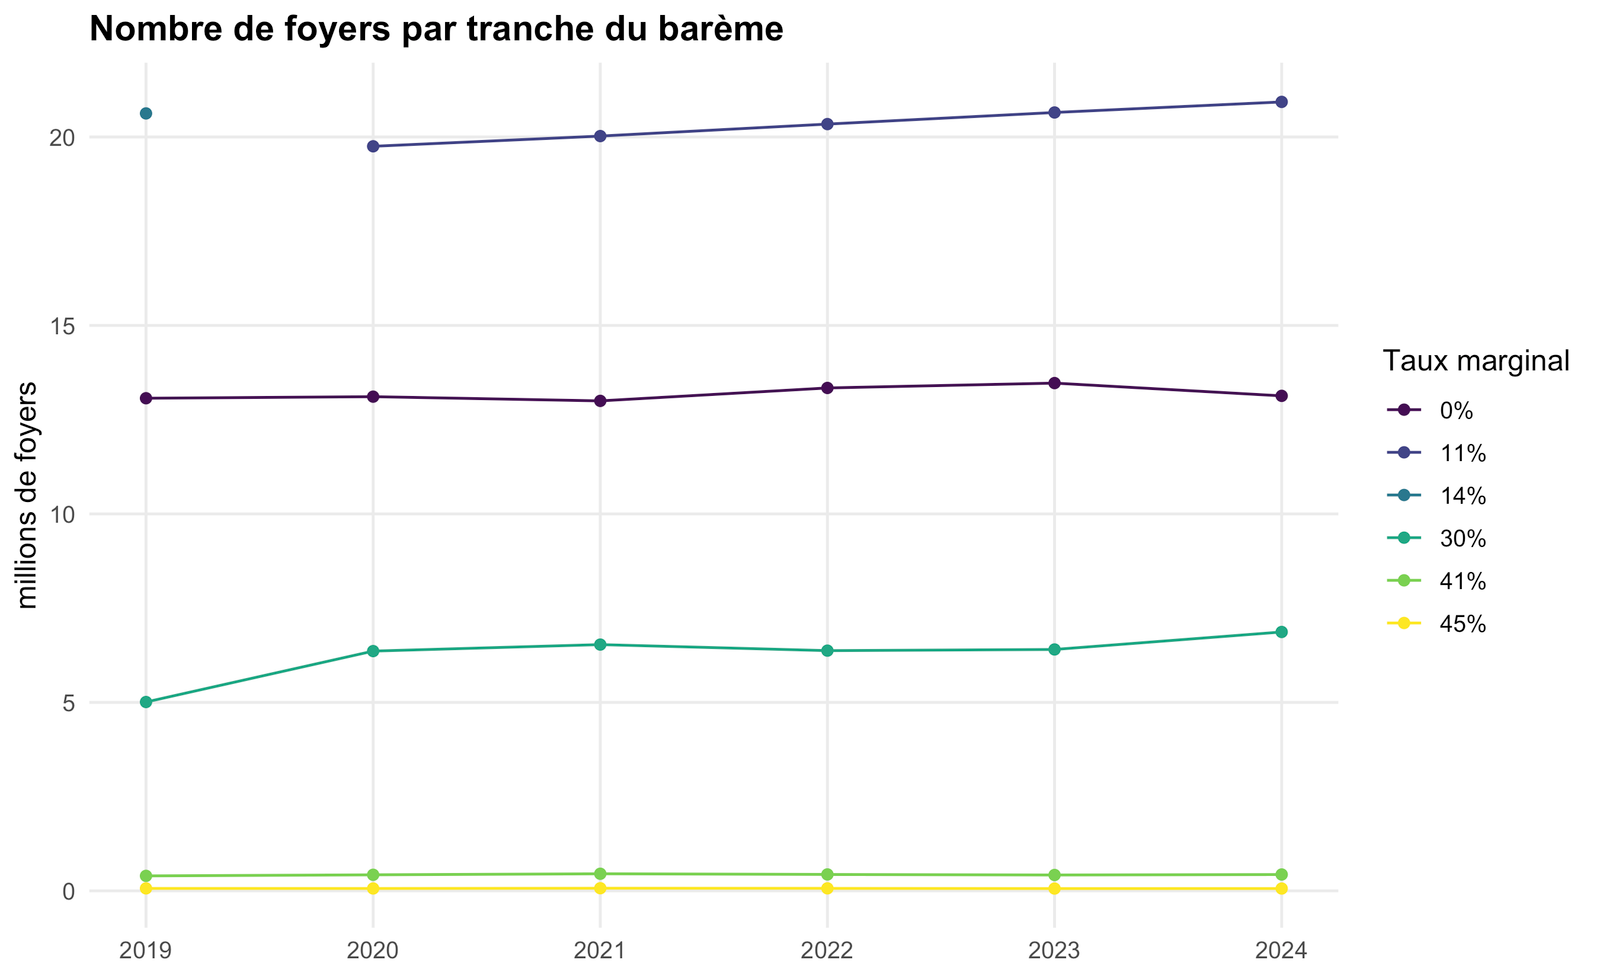
Source : DGFIP, statistiques sur l’impôt sur le revenu. Foyers (en milliers) et impôt net (en millions d’euros) selon la tranche du barème dans laquelle se situe le quotient familial.
Foyers et impôt par tranche, dernière année
Code
dernier <-max(irt$annee)irt |> dplyr::filter(annee == dernier, tranche !="TOTAL") |> dplyr::mutate(taux =factor(scales::percent(taux_marginal, accuracy =1))) |> dplyr::select(taux, `Part des foyers`= part_foyers, `Part de l'impôt net`= part_impot) |> tidyr::pivot_longer(-taux) |>ggplot(aes(taux, value, fill = name)) +geom_col(position ="dodge") +scale_y_continuous(labels = scales::label_percent(accuracy =1)) +scale_fill_manual(values =c("#9ecae1", "#08519c"), name =NULL) +labs(title =paste0("Foyers et impôt net selon le taux marginal, ", dernier),x ="Taux marginal du barème", y =NULL) + theme_dgfip +theme(legend.position ="bottom")
Part de l’impôt net payée par chaque tranche, 2019-2024
Code
irt |> dplyr::filter(tranche !="TOTAL") |> dplyr::mutate(taux =factor(scales::percent(taux_marginal, accuracy =1))) |>ggplot(aes(annee, part_impot, fill = taux)) +geom_col() +scale_y_continuous(labels = scales::label_percent(accuracy =1)) +scale_fill_viridis_d(name ="Taux marginal") +labs(title ="Qui paie l'impôt sur le revenu ?", subtitle ="Part de l'impôt net par tranche du barème", x =NULL, y =NULL) + theme_dgfip
Nombre de foyers par tranche
Code
irt |> dplyr::filter(tranche !="TOTAL") |> dplyr::mutate(taux =factor(scales::percent(taux_marginal, accuracy =1))) |>ggplot(aes(annee, nb_foyers /1000, colour = taux)) +geom_line() +geom_point() +scale_colour_viridis_d(name ="Taux marginal") +labs(title ="Nombre de foyers par tranche du barème", x =NULL, y ="millions de foyers") + theme_dgfip